Nucleosynthesis in Massive Stars With Improved Nuclear and Stellar Physics
Abstract
We present the first calculations to follow the evolution of all stable nuclei and their radioactive progenitors in stellar models computed from the onset of central hydrogen burning through explosion as Type II supernovae. Calculations are performed for Pop I stars of 15, 19, 20, 21, and 25 using the most recently available experimental and theoretical nuclear data, revised opacity tables, neutrino losses, and weak interaction rates, and taking into account mass loss due to stellar winds. A novel “adaptive” reaction network is employed with a variable number of nuclei (adjusted each time step) ranging from on the main sequence to during the explosion. The network includes, at any given time, all relevant isotopes from hydrogen through polonium (). Even the limited grid of stellar masses studied suggests that overall good agreement can be achieved with the solar abundances of nuclei between O and Zr. Interesting discrepancies are seen in the 20 model and, so far, only in that model, that are a consequence of the merging of the oxygen, neon, and carbon shells about a day prior to core collapse. We find that, in some stars, most of the “-process” nuclei can be produced in the convective oxygen burning shell moments prior to collapse; in others, they are made only in the explosion. Serious deficiencies still exist in all cases for the -process isotopes of Ru and Mo.
1 Introduction
The nucleosynthetic yields of massive stars are important to many areas of astronomical research. Besides the inherent interest in understanding our nuclear origins, the abundances made in supernovae are used to diagnose models for the explosion and as input to still grander models for the formation and chemical evolution of galaxies and the intergalactic medium. They are the target of x-ray observations of supernova remnants and gamma-ray studies of radioactivities in the interstellar medium. Some can be used as cosmochronometers, others power the light curves, still others appear as anomalous abundances found in tiny meteroitic grains in our own solar system.
For these reasons, nucleosynthesis calculations have a long history and a sizable community that carries them out. Most recently, nucleosynthesis in massive stars has been studied by Woosley & Weaver (1995, WW95); Thielemann et al. (1996); Limongi et al. (2000) and others. With this paper, we embark on a new survey, similar to WW95, that will ultimately include stars of many masses and initial metallicities. The characteristics of this new study are improvements in the stellar physics (mass loss rates, opacities, reaction network, etc., § 2) and revisions to nuclear reaction rates (§ 3) that have occurred during the last eight years.
This first paper particularly addresses recent improvements in nuclear physics. For elements heavier than about silicon, the nuclear level densities are sufficiently high (provided the particle separation energies are not too small) that the statistical - or “Hauser-Feshbach” - model can be used. Here, in their maiden voyage, we use rates calculated using the NON-SMOKER code (Rauscher et al., 1997; Rauscher & Thielemann, 1998). The reaction library, from which the network is drawn, includes all nuclei from the proton-drip line to the neutron-drip line and elements up to and including the actinides (Rauscher & Thielemann, 2000). For elements lighter than silicon, where they have been measured, results are taken from the laboratory. Several different compilations are explored. The most critical choices are the rates for C(O, Ne(,n)Mg, and Ne(Mg. In order to facilitate comparison, we have chosen a constant value equal to 1.2 times that of Buchmann (1996) for the C(O rate in all our calculations. For our standard models (defined in 3.1) we further adopt the lower bound of Käppeler et al. (1994) for Ne(,n)Mg (Hoffman et al., 2001). In future publications we will explore, in greater depth, the consequences of different choices for these rates (for C(O, see also Weaver & Woosley 1993; Boyes et al. 2002).
A novel reaction network is employed, unprecedented in size for stellar evolution calculations. The network used by WW95, large in its day, had about 200 nuclides and extended only to germanium. Studies using reaction networks of over 5000 nuclei have been carried out for single zones or regions of stars in order to obtain the -process, e.g., Cowan et al. (1985); Freiburghaus et al. (1999); Kratz et al. (1993), but “kilo-nuclide” studies of nucleosynthesis in complete stellar models (typically of 1000 zones each for 20,000 time steps) have not been done before. We describe in § 2.2 a dynamically evolving network that adds and subtracts nuclides as appropriate during the star’s life to ensure that all significant nuclear flows are contained. Our present survey uses a network that has the accuracy of a fixed network of 2500 isotopes.
Section 4 discusses aspects of the stellar evolution that are critical to the nucleosynthesis and § 5 gives the main results of our survey. We find overall good agreement of our nucleosynthesis calculations with solar abundances for intermediate mass elements (oxygen through zinc) as well as the “weak component” of the -process (A 90), and most of the -process isotopes. However, there is a systematic deficiency of -process isotopes below A 125 that is particularly acute for Mo and Ru, and around A 150. Possible explanations are discussed in § 5.5. We also find that the nucleosynthesis is at least as sensitive to the stellar model as to the nuclear physics and, in particular, find unusual results for a 20 model (in the sense that the results differ greatly from both the sun and those at either 19 or 21 ). This is because of the merging of convective oxygen, neon, and carbon shells that occurred well before collapse in that model and not in the others (§ 5).
2 Stellar Physics and Computational Procedure
All stellar models were calculated using the implicit hydrodynamics package, KEPLER (Weaver et al. 1978; WW95), with several improvements to the physical modeling of stellar structure and to the nuclear reaction network (see also Heger et al. 2001b; Hoffman et al. 2001; Rauscher et al. 2001). In the following, we discuss only those improvements. For further details on the basic approaches we refer the reader to the previous publications (e.g. see Weaver et al., 1978; Weaver & Woosley, 1993; Woosley & Weaver, 1995).
2.1 New And Improved Physics Since WW95
The most important change in stellar physics compared to WW95 is the inclusion of mass loss. The prescription employed (Nieuwenhuijzen & de Jager, 1990) gives a mass loss rate that is sensitive to surface temperature and luminosity. Operationally, the mass lost in each time step is subtracted from a stellar zone situated 0.01 below the surface of the star and the surface layers are automatically rezoned (dezoned) whenever necessary, while conserving mass, momentum, energy, and composition. The advection term for the enthalpy flux and the expansion term due to mass loss can be neglected in these outer layers since the energy input in the mass loss () is small compared to the luminosity. The total mass loss of our stars is dominated by the RSG phase and depends on the modeling of semiconvection and overshooting, and on the rate (Boyes et al., 2002). We obtain final masses that lie between the “normal” and the “double” mass loss rates of Schaller et al. (1992).
For temperatures below , the OPAL95 opacities are employed (Iglesias & Rogers, 1996). In particular, these result in a better representation of the hydrogen envelope in the red giant stage where the “iron bump” in the opacities of Iglesias & Rogers (1996) is known to be important (e.g., Heger et al., 1997). Above , the opacity was the same as in WW95 (and Weaver, Zimmerman, & Woosley 1978).
Plasma neutrino losses were updated to use the rates by Itoh et al. (1996, coding by F. Timmes, private communication). Hydrogen burning and weak losses during this phase were updated as described in Heger et al. (2000). Weak rates and weak neutrino losses in the late evolution stages now use the rates of Langanke & Martínez-Pinedo (2000; see Heger et al., 2001a, b).
Convection is basically treated as presented in Weaver et al. (1978); Weaver & Woosley (1993) (see also Woosley et al., 2002, for a recent summary). However, convective overshooting (on either side) is now suppressed for isolated convective zone interfaces to avoid a numerical instability present in the work of WW95. Changes to the nuclear reaction rates, both strong and weak, are discussed in § 3.
2.2 Dynamic Nuclear Reaction Network
As in WW95, two reaction networks are used. A small network directly coupled to the stellar model calculation provides the approximate nuclear energy generation rate (Weaver et al., 1978), i.e, is solved implicitly with the Newton-Raphson solver for each time-step in each zone. A larger one is used to track the nucleosynthesis. This smaller network is essentially the same as in WW95 and WZW78, but with updated nuclear rates as described in the following sections. For a study of small vs. large networks and their ability to accurately and efficiently provide input values of the nuclear energy generation rate during advance stages of stellar evolution see Timmes, Hoffman, & Woosley (2000).
The nucleosynthesis is coupled to convection in an “operator split” mode. At the end of each time-step for the evolutionary model, the large reaction network is called, for the existing conditions (temperature and density), and the chemical species are diffusively mixed. To save computer time, the composition is not updated in zones where the temperature is too low for any nuclear activity during the previous time step, though every zone participates in convective mixing, where appropriate, every time step.
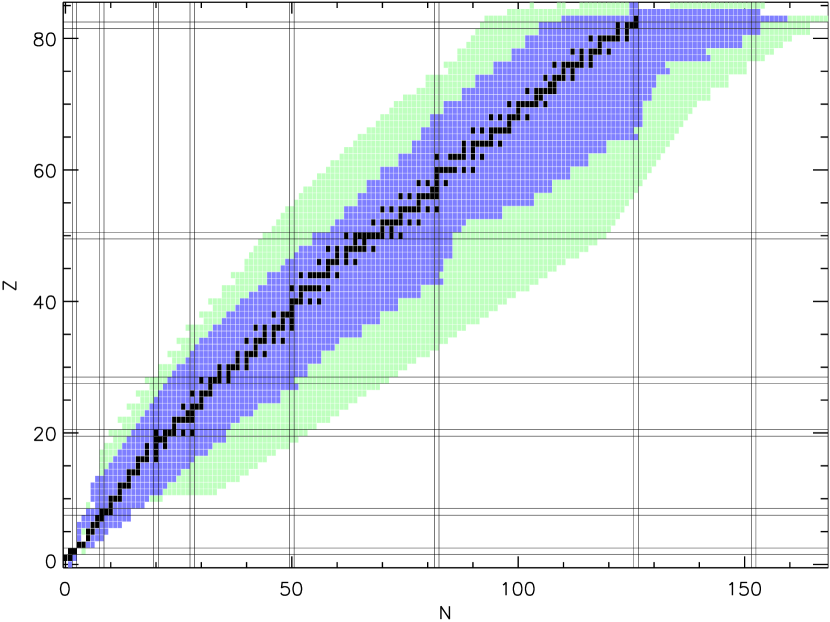
One of the major improvements over WW95 and other stellar models is that, for the first time, the synthesis of all nuclides of any appreciable abundance is followed simultaneously in an adaptive network. Using a library containing rate information for 4,679 isotopes from hydrogen to astatine, the “adaptive” network automatically adjusts its size to accommodate the current nuclear flows. This means the constitution of the network evolves to accommodate the most extreme thermodynamic conditions present anywhere in the model. If the mass fraction of an isotope exceeds a parameter, here , anywhere in the star, the neighboring isotopes, and all to which that species might decay, are added. Similarly, if the abundance of an isotope drops below , it is removed (unless it is along the decay chain of an abundant nucleus). Because different zones may become convectively coupled at unpredictable times, the same network must be used throughout the star. The network includes all strong reactions involving nucleons, -particles, and photons plus a few “special” reactions for light isotopes (like the triple process, C+C, etc.; for details see WW95) as well as all weak interactions - electron capture, positron decay, and beta-decay. The network is solved implicitly using a sparse matrix inverter (Timmes et al., 1995).
For our 15 star, for example, the network initially contained 645 isotopes during hydrogen burning, including 283 stable or long-lived species (like or ). This number grew to isotopes at the end of central helium burning (to accommodate the -process, during carbon (shell) burning, during oxygen burning, during oxygen shell burning, and at the presupernova stage. When the supernova shock hit the base of the helium shell causing a weak -process, the network reached its maximum size, . In total 2,435 different isotopes were included at one time or another. A network plot is shown in Fig. 1.
The major limitation of this network is that it purposefully does not include elements beyond astatine, i.e., the heavy -process and fission-cycling could not be followed. Given the current uncertainties in the explosion mechanism and our simplified treatment, a description of the high-entropy zones close to the proto-neutron star is beyond the scope of this paper. Thus, we did not calculate the -process that might occur in the neutrino wind (Woosley et al., 1994). Another limitation in the current implementation of the network is that it only includes one state per isotope, which limits its accuracy for a few isotopes like and .
3 Nuclear Physics
Since 1993, when the nuclear physics used in WW95 was “frozen”, there have been numerous revisions to nuclear reaction rates. In this work we are presenting our choice of a thoroughly updated standard rate set, including most recent experimental data and theoretical results. Numerically, the greatest fraction of nuclear information is theoretical, coming from a statistical model calculation (Rauscher & Thielemann, 2000), described in § 3.3. These theoretical rates are supplemented by experimental values where they are known. Details are discussed in the following sections and the experimental rates employed are summarized in Table 1. The table is truncated at Ca because above that, with the few exceptions indicated, all rates are either from Bao et al. (2000) for reactions (see Table LABEL:tab:macs for a listing of these nuclei) or Rauscher & Thielemann (2000).
The weak rates used here are discussed in § 3.4.
3.1 Experimental Rates Below Silicon
Nuclear reactions involving elements lighter than silicon are particularly important both for nucleosynthesis and determining the stellar structure. Our standard set of light element reaction rates begins with Caughlan & Fowler (1988) as updated by Hoffman et al. (2001) and Iliadis et al. (2001). Further minor modifications were made to the rates H(n,)D and He(n,)He (Thielemann et al., 1995). Table 1 gives the sources of all charged particle reaction rates not taken from Rauscher & Thielemann (2000). The proper references can be found in Table LABEL:tab:rrrm_expl.
Some important rates, e.g., those of Iliadis et al. (2001), have been given by these authors in tabular form and not as fitted functions of temperature. In Appendix A we describe a novel procedure that we shall follow for all such tabulations in the future and which we recommend to the community. The bulk of the temperature sensitivity is extracted from the rate using a simple fitting function that does not by itself give the necessary accuracy across the temperature grid. The ratios of the actual rate to the fitting function are then carried as a table in the computer and can be interpolated much more accurately than the rate itself.
Besides models that used this standard set of nuclear physics (the “S”-series of models; 15, 19, 20, 21, and 25 ), we also present calculations using two other rate sets. This was done to facilitate the comparison of different choices of reaction rates in otherwise identical stellar models. One other set was the NACRE compilation of charged particle rates Angulo et al. (1999) (Model series “N”; for 15, 20, and 25 ). For one 25 star, we used the network and rates of Hoffman et al. (2001). Since that work only included nuclear data up to about mass 110, the recalculation here used a similar static network of 477 nuclides (Set “H”; for 25 only).
3.1.1 C(O
Of utmost importance for nucleosynthesis is the rate adopted for C(,)O. The same value was used in all studies reported in this paper (sets S, N, H) since variation of this single rate would alter the stellar model and obscure the sensitivity to the other nuclear physics. The rate previously used in WW95 and Hoffman et al. (2001) was that of Caughlan & Fowler (1988) multiplied by 1.7. Here, the more recent evaluation of Buchmann (1996, 2000) was used as a basis for the temperature dependence, but the overall rate was multiplied by a factor of 1.2 to bring the recommended value keV barn into better accord with our standard keV barn (Weaver & Woosley, 1993). This value and temperature dependence is also consistent with recent measurements by Kunz et al. (2001a, b).
3.1.2 Ne(n)Mg and Ne()Mg
The reaction Ne(n)Mg, acting in competition with Ne()Mg, is critical for determining the strength of the helium-burning -process in massive stars (e.g., Käppeler et al., 1994). Here, while experimenting with several choices, the standard set employed is the lower limit of Käppeler et al. (1994; the same rates as used by Hoffman et al. 2001). This choice is in reasonable agreement with more recent work by Jaeger et al. (2001). Following an early recommendation by Wiescher (1995), only the resonance at 828 keV was considered in the rate for Ne(,n)Mg and the resonance at 633 keV was ignored. Further, the 828 keV resonance itself was given a strength equal to its 1 lower limit, 164 eV. The rate for Ne()Mg was that recommended by Käppeler et al., but with the strength for the 633 keV resonance multiplied by 0.5. The modified Käppeler et al. (1994) rates were merged with the rate given by Caughlan & Fowler (1988), which was used for temperatures . For model series N, we used the same (,) rate ( Buchmann 2000), but the recommended values for Ne(,)Mg, Ne(n)Mg, and all other rates provided by NACRE.
3.2 Experimental Rates Above Silicon
Additional experimental rates for nuclei heavier than silicon are given in Table 1. These are largely drawn from Hoffman & Woosley (1992). The entries in Table 1 are referenced in Table LABEL:tab:rrrm_expl.
Recent measurements of the reactions Ge(,)Se (Fülöp et al., 1996) and Sm(,)Gd (Somorjai et al., 1998) are of great importance for the -process yields. Especially the predictions of the latter reaction were found to be very sensitive to the optical model potential used (Woosley & Howard, 1990; Rauscher et al., 1996). For our rate library, the resulting experimental rates of both reactions were fitted to the format described in (Rauscher & Thielemann, 2000). The experimental information was also used to recalculate other rates involving the same potentials. See § 3.3 for a further discussion.
3.3 Hauser-Feshbach Rates
For those cases where experimental information was lacking and the level density was sufficiently high (typically ) we employed the Hauser-Feshbach rates obtained using the NON-SMOKER code (Rauscher et al., 1997; Rauscher & Thielemann, 1998). A library of theoretical reaction rates calculated with this code and fitted to an analytical function — ready to be incorporated into stellar model codes — was published recently, in the following (and in Table 1) referred to as RATH (Rauscher & Thielemann, 2000, 2001). It includes binary reaction rates involving nucleons, alpha-particles, and photons interacting with all possible targets from neon to bismuth and all isotopes of these elements from the proton to neutron drip-lines. It is thus the most extensive published library of theoretical reaction rates to date. For the network described here, we utilized the rates based on the FRDM set as these provide the most reliable description around the valley of stability.
Partition functions were also taken from Rauscher & Thielemann (2000), but were converted to the format defined in Holmes et al. (1976) to be used in KEPLER. This was achieved by fitting them with the appropriate functions. Low-lying nuclear levels had to be used for a few cases and in such a case the same information as for the NON-SMOKER calculation was utilized (Rauscher & Thielemann, 2001).
Recent investigations underline the fact that the +nucleus optical potential for intermediate and heavy targets is not well understood at astrophysically relevant energies. Although capture itself will be negligible for highly charged nuclei, the optical potential still is a necessary ingredient to determine the reverse (,) reaction which is important in the -process (Woosley & Howard, 1990; Rauscher et al., 1996). Two capture reactions have been studied experimentally close to the relevant energy range. While the reaction Ge(,)Se (Fülöp et al., 1996) was essentially well predicted by theory and needed only a small adjustment of the optical potential, Sm(,)Gd exhibited strong deviations from previous estimates (Somorjai et al., 1998). As stated above, the experimental rates were implemented in RATH format in our rate library. Moreover, for reasons of consistency, all reactions involving the channels +Ge and +Sm were recalculated with the statistical model code NON-SMOKER, utilizing the optical potentials derived from the capture data (Somorjai et al., 1998). The resulting fit parameters in RATH format are given in Table LABEL:tab:alpha.
Of special interest are -capture reactions on self-conjugate () target nuclei. The probabilities for these reactions are suppressed by isospin effects and require special treatment in any theoretical model. Capture data is scarce, even for lighter nuclei. Recently, Rauscher et al. (2000b) published a semi-empirical evaluation of resonance data (i.e. resonances taken not only from (,) reactions but also from other approaches) and compared it to predictions made with the code NON-SMOKER which includes an improved treatment of the isospin suppression effect (Rauscher & Thielemann, 1998). Reasonable agreement was found around . At lower temperatures either the statistical model was not applicable or had problems with the prediction of the optical potential (similar as discussed above), depending on the considered reaction. Since we need a reliable rate across the whole temperature range, a mixed approach was chosen: below a certain temperature the contributions of single resonances – taken from Rauscher et al. (2000b) – are added, above the statistical model rate renormalized to the experimental value at is used. Table LABEL:tab:iso lists the parameters and temperatures.
Also important are the rates for neutron capture. These directly affect both the neutron budget (acting as neutron ”poisons”), and the abundance of all -process isotopes, including many species below the iron group (see Table 3 of Woosley et al. 2002). Where available, the theoretical rates of RATH were supplemented by experiment using the Bao et al. (2000) compilation of recommended neutron capture cross sections. Because only 30 keV MACS (Maxwellian Averaged Cross Sections) are given in that reference, we renormalized the fits given in RATH in order to obtain the same MACS values at 30 keV, thus maintaining the (weak) temperature dependence of the theoretical rates. The normalization factors are given in Table LABEL:tab:macs. Both forward and reverse rates of RATH are multiplied by the same factor. For targets below Ne, for which statistical model calculations cannot be applied with any accuracy, a dependence of the cross section – leading to a constant rate – was assumed, unless other experimental information was available.
3.4 Weak Interactions
The experimental , , and decay rates of Tuli et al. (1995; calculated from the laboratory ground state half-life), and their respective branching ratios were implemented. Where feasible, a temperature-dependent weak rate was coded that couples the ground state to a shorter lived excited state (both assumed to be in thermal equilibrium, Clayton 1968). Further experimental decay rates were taken from Kratz et al. (1996; see also Möller et al. 1997). For all other targets, we used the theoretical and rates of Möller et al. (1997). As a special case, we implemented a temperature-dependent Ta decay rate (Belic et al., 2000).
Usually, the ground state rates are a lower bound to the actual weak decay rates. Where fitted functions are available, we also utilize temperature and density-dependent weak rates (Fuller et al., 1980, 1982a, 1982b, 1985) accounting for a continuum of excited states. An important change of the weak interaction rates for is brought about by the recent work of Langanke & Martínez-Pinedo (2000). Where information is available, we use Langanke & Martinez rates in preference to Fuller et al. Their inclusion leads to interesting changes in the presupernova structure (see § 4.1), but not so much in the abundances outside the iron core.
Neutrino losses are a critical aspect of stellar evolution in massive stars beginning with carbon burning. The dominant losses before silicon burning are due to thermal processes (chiefly pair-annihilation), which provide a loss term that is very roughly proportional to T in the range of interest for advanced burning stages (Clayton, 1968). This temperature sensitivity, combined with the need to burn heavier fuels at higher temperatures to surmount the increasing charge barriers, is what leads to the rapid decrease in lifetime to burn a given fuel, with obvious consequences for nucleosynthesis. We include the latest treatment (Itoh et al., 1996).
The neutrino flux of a core-collapse supernova is high enough to contribute to the nucleosynthesis of certain rare elements and isotopes. In this so-called -process, inelastic neutral-current scattering of a neutrino leads to the formation of an excited daughter nuclide which then decays by particle emission. Rare isotopes with highly abundant “neighbors” (or neighbors of their radioactive progenitors) can be significantly produced by this process. As previously used by WW95, we adopt the rates of Woosley et al. (1990).
4 Stellar Evolution
4.1 Presupernova Evolution
Table LABEL:tab:struc_models summarizes the presupernova properties of the new models. The helium, carbon-oxygen, and neon-oxygen cores are defined as the enclosed mass where hydrogen, helium, and carbon mass fractions, first drop below 1 %. The silicon core is defined by where silicon becomes more abundant than oxygen and the iron core by where the sum of the mass fractions of iron group nuclei first exceeds 50 % (all criteria applied moving inward). The deleptonized core is the region where the number of electrons per baryon, , drops below 0.49.
Revisions in opacity and the introduction of mass loss generally lead to smaller helium cores which also tend to decrease the mass of the carbon-oxygen and the silicon cores. Note, however, that the absolute values of these core masses depend on many uncertainties, in particular, in the efficiencies of mixing processes in the stellar interior - semiconvection, overshooting, and rotationally induced mixing (not included here; cf. also Imbriani et al. 2001). For example, the helium core of the new model S25 is about one solar mass smaller than in the equivalent 25 model of WW95. A model that was computed with the new opacity tables, but without mass loss, had about half a solar mass smaller helium core. Thus, we attribute the other half solar mass of decrease in helium core mass to the action of mass loss. Of course, the two effects are not entirely independent.
As a result of the reduced helium core size, our new models generally have lower carbon-oxygen and oxygen-neon cores. Due to the interaction of the different phases of shells burning, the sizes of the “inner cores” do not always monotonically change with the size of the helium core, though a general trend is followed (Woosley et al., 2002).
The change in the weak rates (Langanke & Martínez-Pinedo, 2000), important after central oxygen burning, leads to a increase in the central value of at the time of core collapse (over what would have resulted using (Fuller et al., 1980)), and the “deleptonized core” tends to contain less mass. More importantly, we find higher densities in the region which may affect the core collapse supernova mechanism due to correspondingly higher ram-pressure of the infalling matter (cf. Janka 2001). Further details concerning the effect of the new weak rates are discussed in Heger et al. (2001b).
4.2 Supernova Explosions
The most recent multi-dimensional calculations of core collapse and supernova explosion still offer little guidance as to the exact placement of the mass cut, the entropy and of the innermost ejecta, or even if a given model will explode (Herant et al. 1994; Burrows, Hayes, & Fryxell 1995; Janka & Müller 1996; Mezzacappa et al. 1998; Fryer & Heger 2000). Nucleosynthesis studies must still parameterize the explosion as best they can. In the present paper supernova explosions were simulated, as in WW95, by a piston that first moved inwards for 0.45 s to a radius of 500 km, and then rebounded to a radius of 10 000 km. For the inward motion, the initial velocity is the local velocity of the corresponding mass shell at the time of the presupernova model and the acceleration of the piston is a constant fraction of the actual local gravitational acceleration, . The arbitrary fraction is chosen such that the piston arrives at a radius of 500 in 0.45 . The subsequent outward movement also is a ballistic trajectory in a gravitational field given by a different constant fraction of the actual local gravitational acceleration. Now the factor is chosen such that an explosion of 1.2 of kinetic energy in the ejecta (measured at infinity) results in the 15 and 19 models. This much kinetic energy is commonly assumed for SN 1987A (e.g., Woosley 1988), but it could have been very different in other supernovae. For the heavier stars, this relatively modest energy gives large amounts of “fallback”, so that much of the interesting nucleosynthesis falls into the neutron star (see also WW95). Therefore, an alternate prescription that resulted in larger energies was used for the 20, 21, and 25 stars. The energy there was adjusted (increased) until the ejecta contained about 0.1 of . This is comparable to the mass of Ni, , commonly adopted for SN 1987A (e.g., Arnett et al. 1989). For Model S25P, which had the same presupernova evolution as Model S25, a still more powerful explosion was calculated that ejected about 0.2 of (see Tables LABEL:tab:struc_models and LABEL:tab:r).
The final mass cut outside the piston was determined by the mass that had settled on the piston at s after core collapse. Note that the amount of fallback resulting from this prescription depends on both the initial location of the piston used as well as its energy. In particular, the yields of Ti and Ni are very sensitive to the “final mass cut” often determined by the fallback.
The neutrino process (-process) during the supernova explosion was implemented using the same prescription as in WW95 and using the same cross sections. We used a neutrino pulse characterized by a total energy of 3 decaying exponentially on a time-scale of 3 . The neutrinos were assumed to have a mean energy of 4 for the electron neutrinos and 6 for the and neutrinos (different from WW95 who used 8 for the and neutrinos) The lower value is recommended by Myra & Burrows (1990).
5 Nucleosynthesis Results
Yields were determined for 15, 19, 20, 21, and 25 stars (Series S; Models S15, S19, ) with initial solar composition (Anders & Grevesse 1989; see also Table LABEL:tab:s) and the standard rate set (Table 1). Identical stellar models having 15, 20, 25 were also calculated using the NACRE rate set (Set N; see also Table 1). That is, all reactions given by NACRE were substituted for their counterparts, except for C(O; all rates not given by NACRE were left the same. A single 25 star was calculated that employed the rate set of Hoffman et al. (2001; Set H; see § 3.1) which is much smaller than our current network.
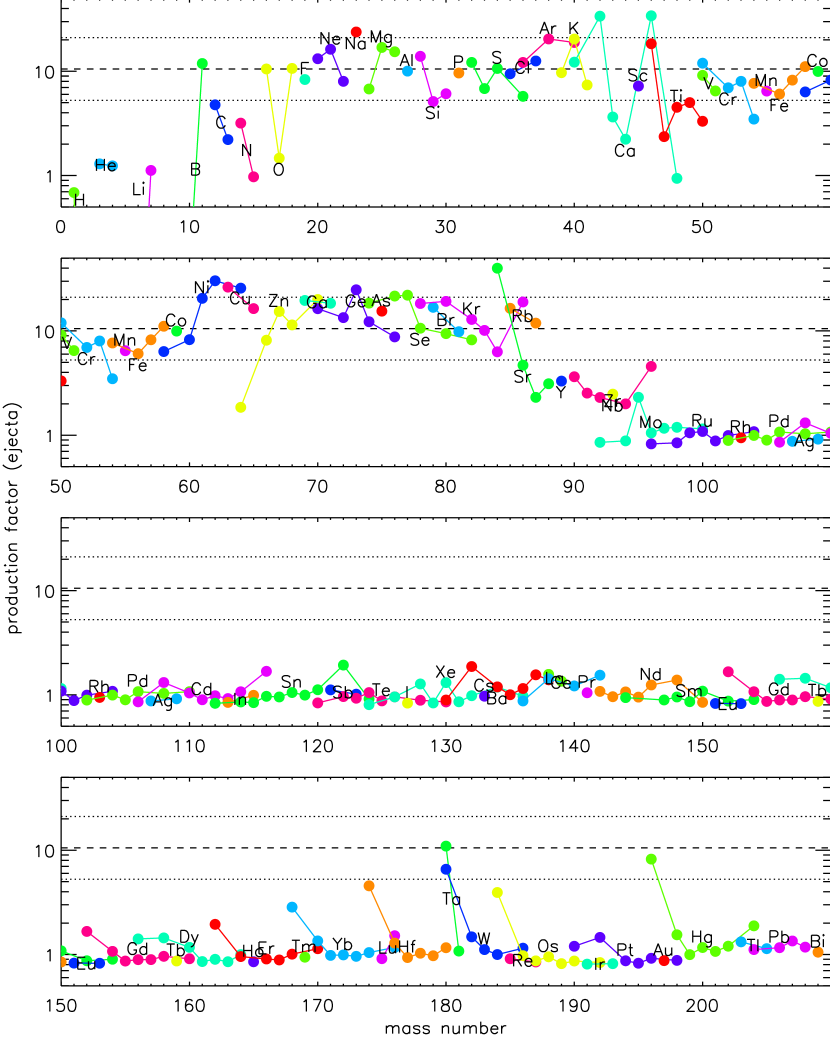
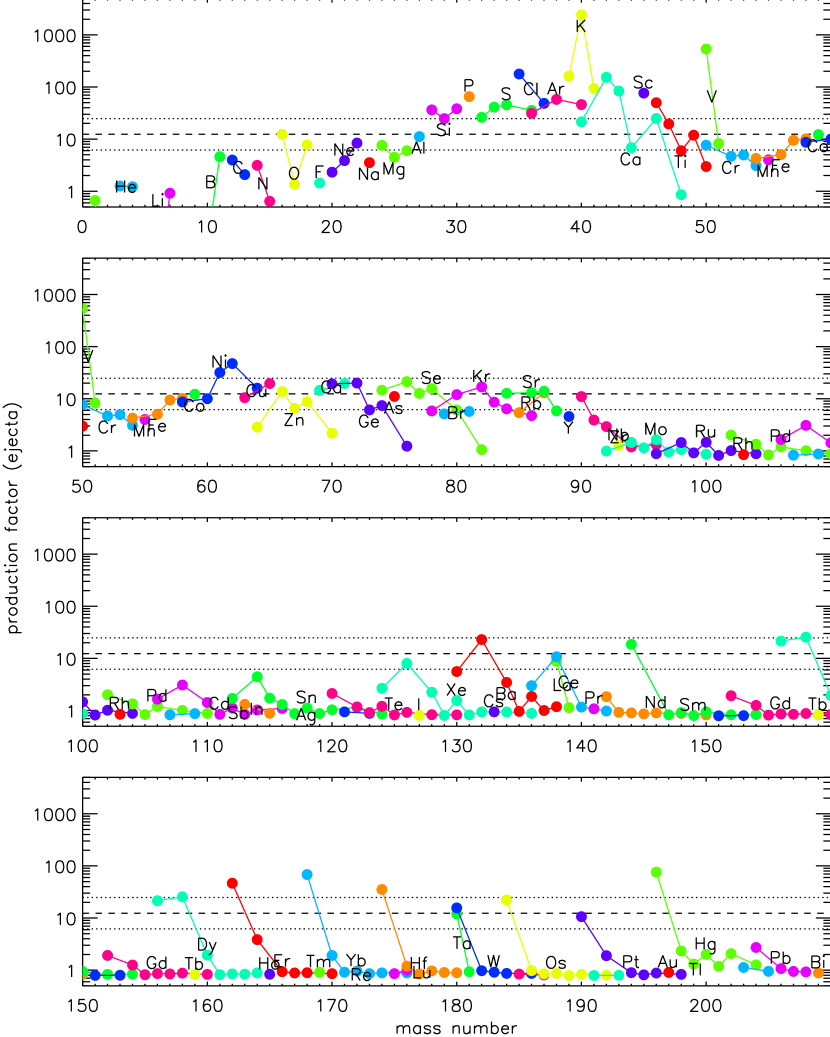
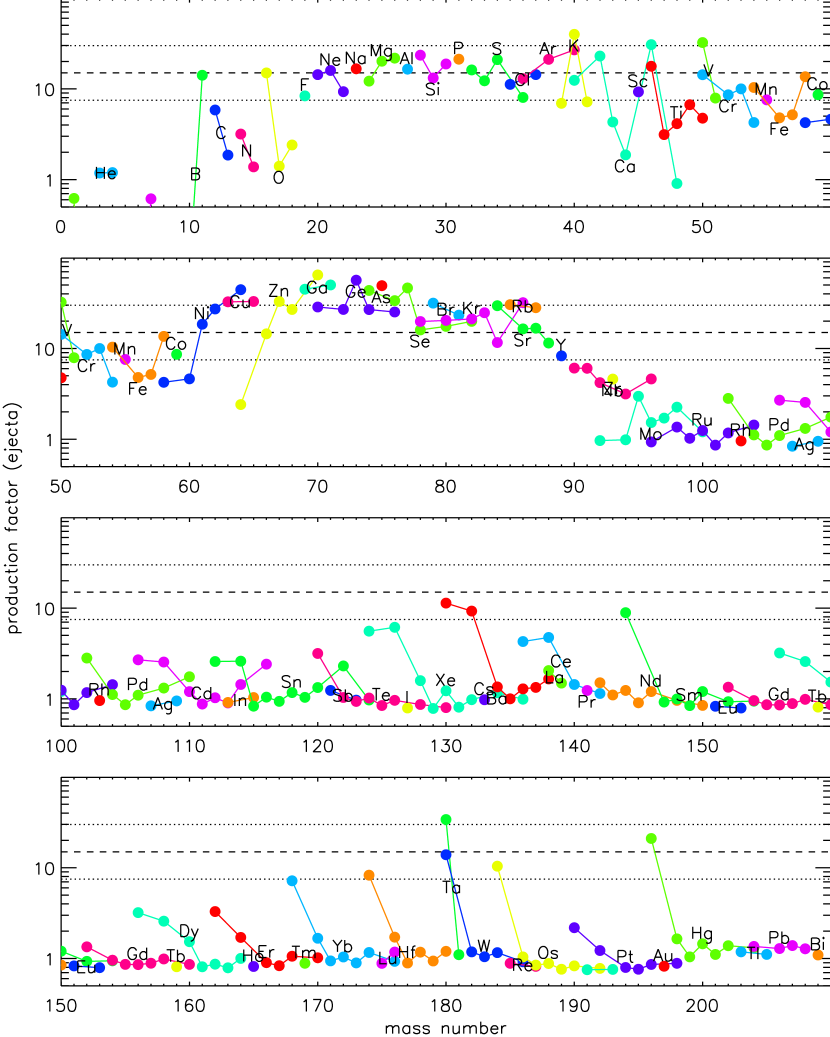
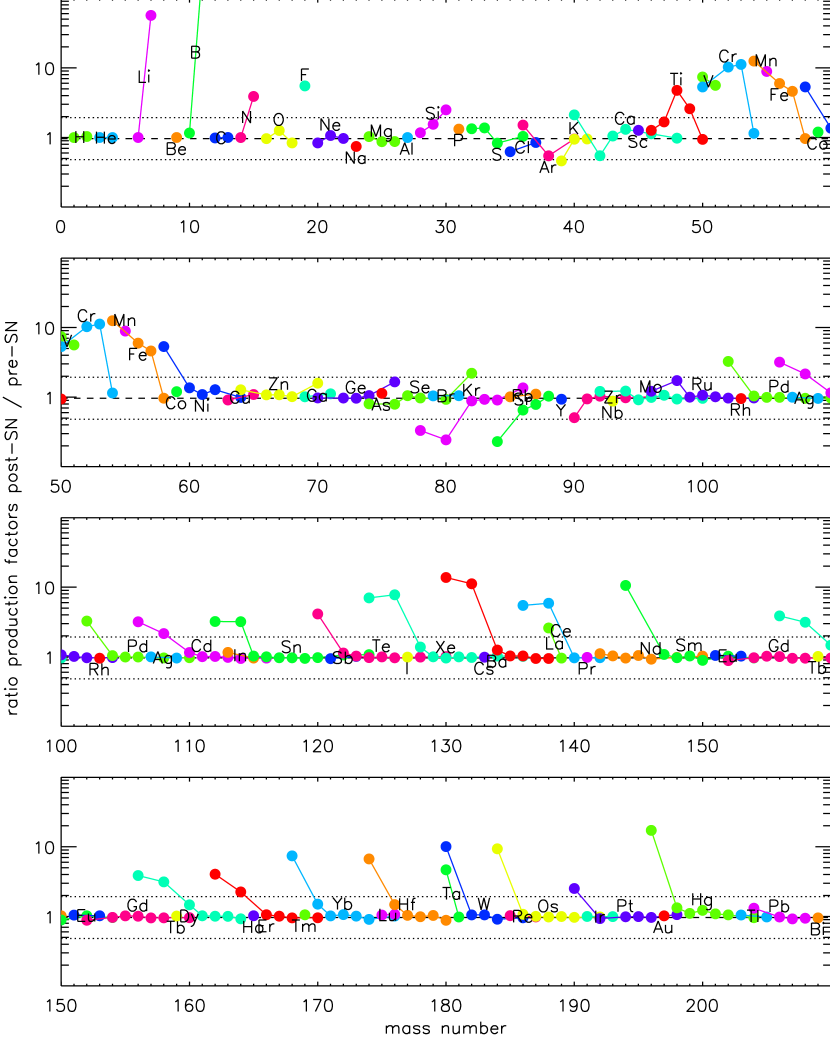
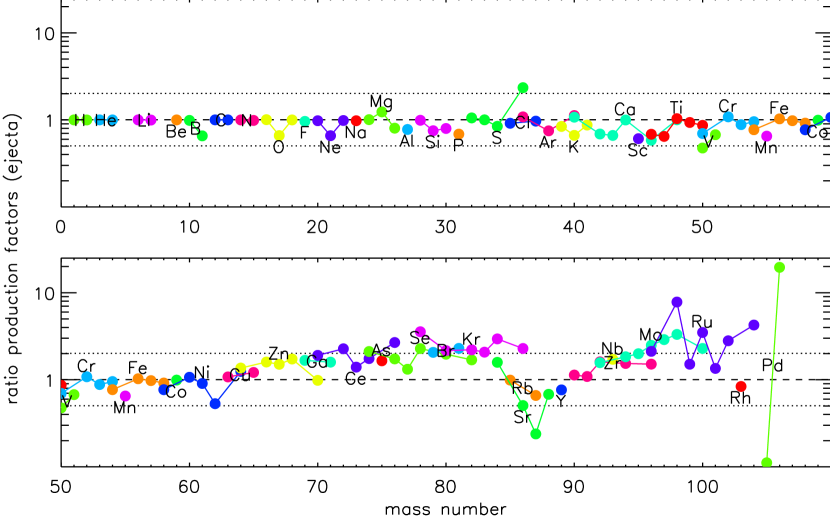
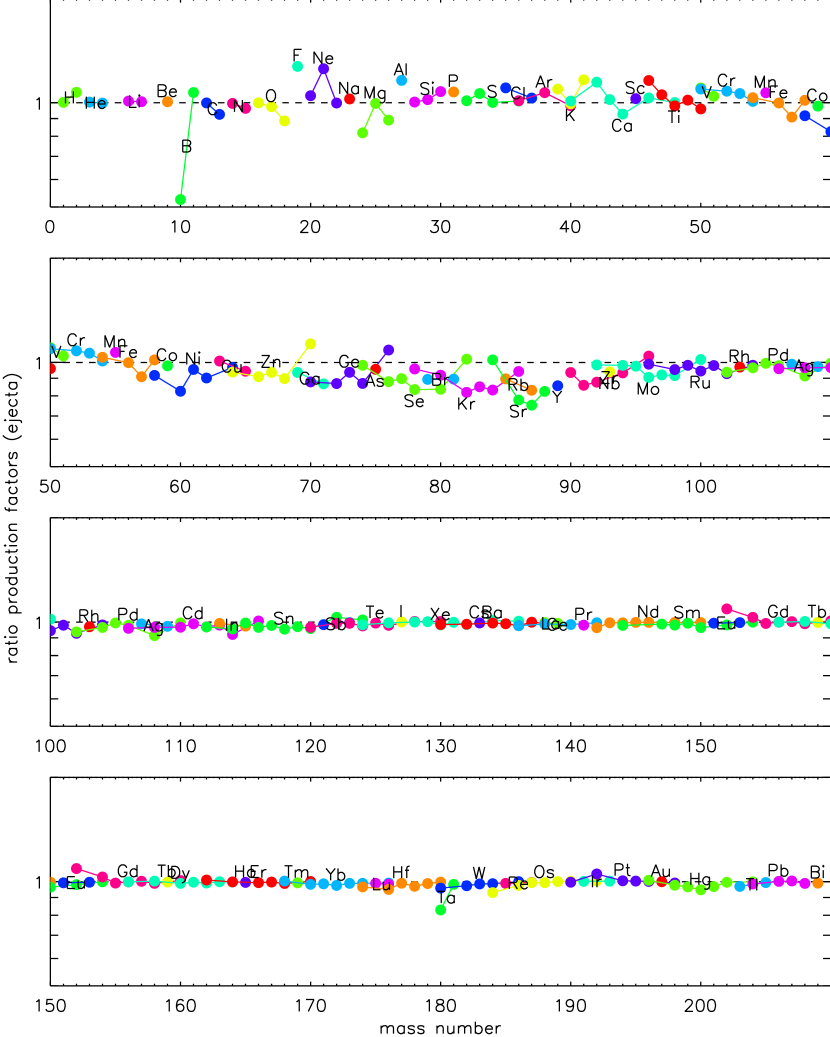
Figures 2 – 6 show the production factors after the explosion and the decay of all unstable species (except K and Ta) in our “standard” S-series. The abundances edited are those outside the mass cut given as “remnant mass” in Table LABEL:tab:struc_models. The resulting abundances, including all those lost to winds, have been divided by their solar (i.e., initial) values. Isotopes of each element are drawn in the same color and connected by lines. The production factor of O – the dominant “metal” yield of massive stars – is used as a fiducial point to provide a band of acceptable agreement of dex relative to its value (dashed and dotted lines).
These yields are also given in Table LABEL:tab:y and are available electronically from the authors. Table LABEL:tab:r gives the yields of all radioactivities still having appreciable abundance at 2.5 , the time of the mass cut determination (Table LABEL:tab:struc_models). For a few isotopes, the edits include progenitors that have not decayed at that time. For example, is almost all produced initially as and results from its decay. Consequently, the yield as given in Table LABEL:tab:r is, (only) slightly, higher than that of .
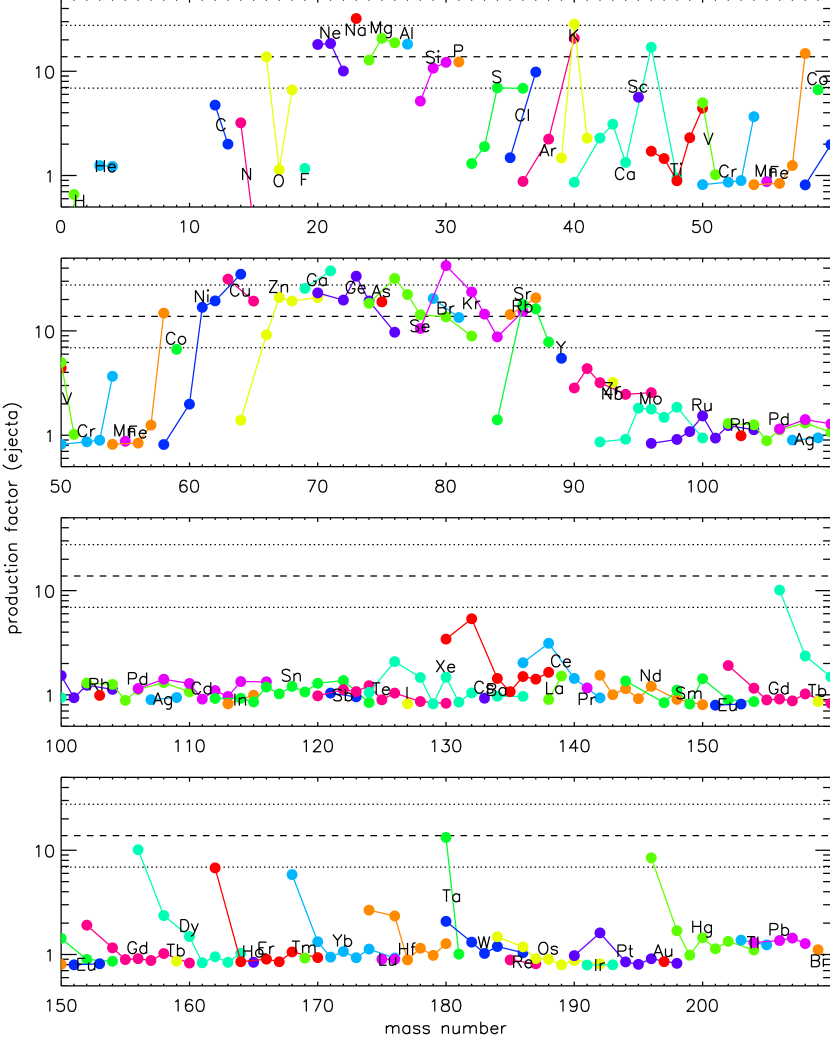
Fig. 7, for Model S25, allows the reader to gauge the importance of explosive pre-explosive nucleosynthesis for various isotopes in a 25 star. The pre-supernova production factors of model S21 are shown in Fig. 8.
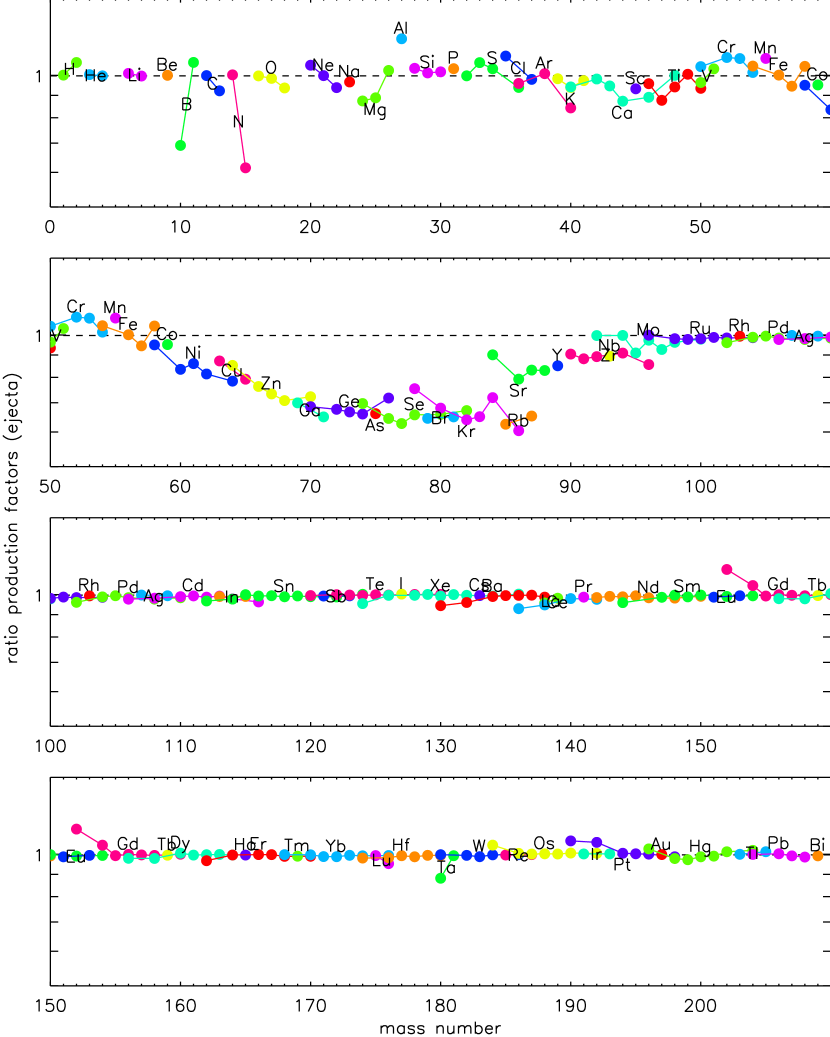
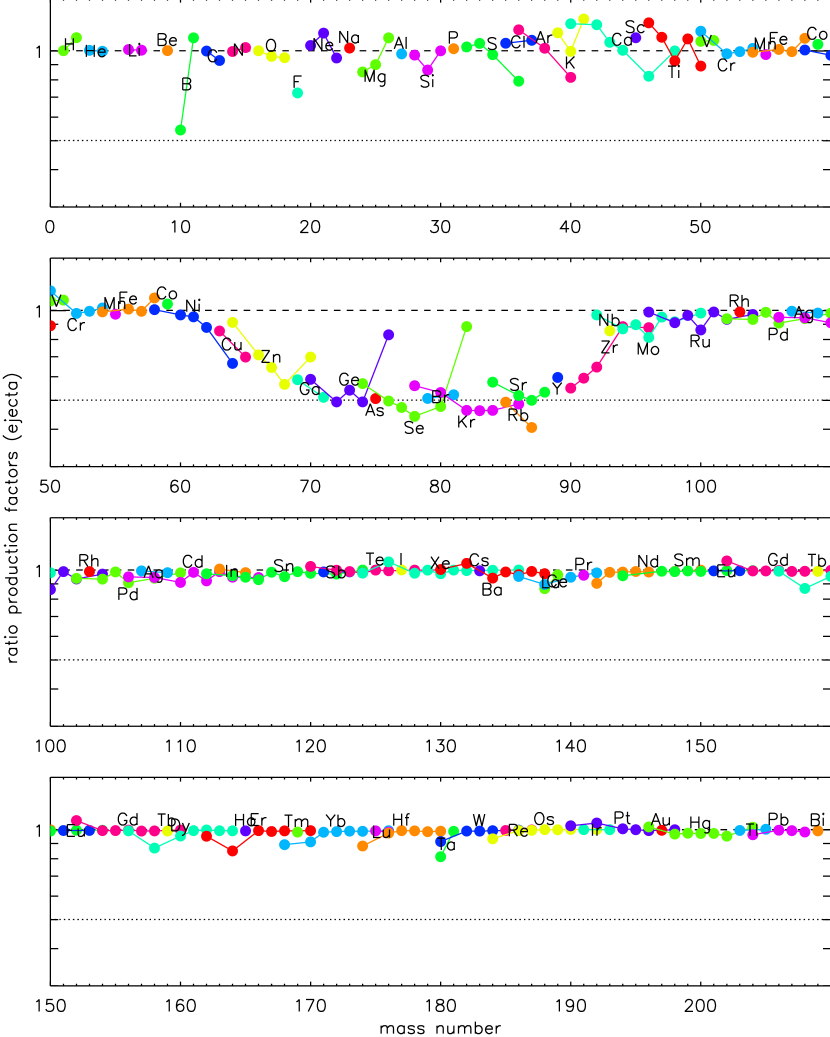
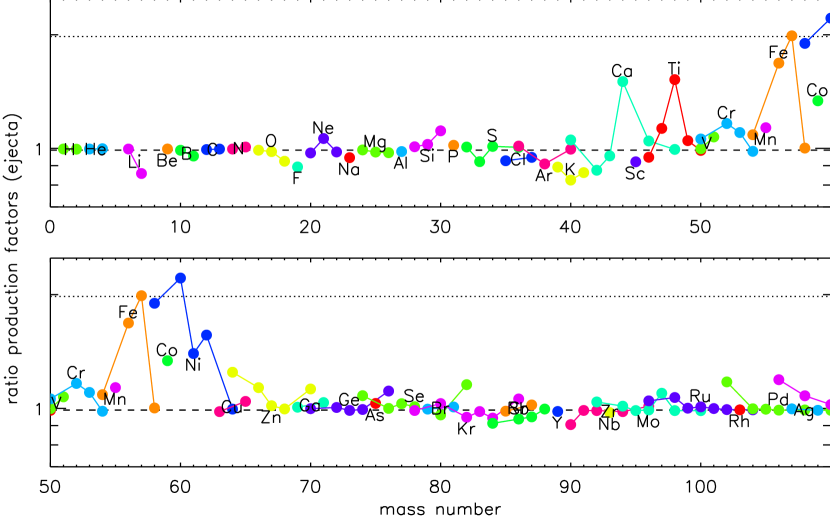
Figures 9, 10, and 11 show the resulting post-explosive production factors of the NACRE runs relative to our standard set (e.g., yields of Model N15 divided by yields of Model S15) and Fig. 12 gives the same comparison for the rate set H for the 25 star. The reaction network of Hoffman et al. (2001) only reached up to Ru.
Additionally, starting from the presupernova stage of Model S25 and using the standard rate set, we followed a more powerful explosion that gave twice the amount of (Model S25P). The results are shown along with the others in Tables LABEL:tab:y and LABEL:tab:r. Fig. 13 gives a direct comparison of nucleosynthesis in the model with high explosion energy (S25P) relative to the one with lower (standard Model S25) energy.
5.1 Production From Light Elements to the Fe Peak
The light isotopes and as well as the elements Li, Be, and B were destroyed during pre-main sequence and main sequence evolution. Though some is initially made, it is destroyed again in the inner parts of the star. Different for WW95, fragile isotopes can additionally be preserved in the stellar wind, especially in the more massive stars, resulting in a slightly increased yield of, e.g., in the S25 star compared to model S25A of WW95. However, substantial amounts of Li and B were created, along with F, by the -process during the explosion (Fig. 7). The significant underproduction of is a result of the revised reaction rates for (p,) and (p,) (Hoffman et al., 2001).
Nucleosynthesis from Ca to Fe shows considerable scatter which only partly relates to the nuclear rates. Yields in this region are particularly sensitive to the details of the explosion and fall back as can be seen in the comparison between S25 and S25P. The higher explosion energy mostly alters the iron group (Fig. 13). In particular, the yields of , , , , and are significantly enhanced. Lighter nuclei produced further out in the star and heavier nuclides made by the -process are not greatly affected by the explosion (hence Fig. 13 does not extend to high atomic mass).
5.2 The 19, 20, and 21 Models
It is necessary to discuss the 19, 20, and 21 models separately because of the peculiar evolution of the 20 model. Model S20 is at the transition mass (for our choice of C(O and convection theory) where stars change from exoergic convective carbon core burning at their centers (less than 20 ) to stars where central carbon burning never generates an excess of energy above neutrino losses (though carbon shell burning always does). We show the history of the convective structure and energy generation for models S15, S20, and S25 in the Kippenhahn plots given in Figs. 14–16. Model S20 exhibits a strong overproduction of several elements between Si and V, especially isotopes of Cl, K, and V (Fig. 4). Interestingly, Cr, Mn, and the light Fe-isotopes are underproduced. This is atypical and is due to a stellar structure effect which appears, for the five stellar masses considered, only in this model. In specific, Model S20 experienced the merging of the convective oxygen, neon, and carbon shells (cf. also Bazan & Arnett 1994) well before (about one day) the end of the star’s life, during the core contraction phase from central silicon burning till silicon shell ignition (Fig. 15). The merged shells carry neutron sources such as Ne and especially Mg to depths where they burn rapidly and provide a strong source of free neutrons. Capture of these neutrons is responsible for the largest overproductions.
To illustrate that this feature is confined to models close to 20 , we also computed 19 and 21 models (Figs. 3 and 5). In the 19 model, Na, Ar, Ca, and Sr are enhanced whereas the other elements follow the expected trend when compared to models S15 and S25. Interestingly, S19 does not show any traces of a -process up to mass 152. In the 21 model, Na is overproduced as in S19, but S, Cl, and the odd K isotopes are produced less. Otherwise a “standard” pattern is emerging. Also, similar -process features (as in S15 and S25) are emerging, with the same Mo-Ru deficiency.
Clearly the solar abundances have not originated in stars of any single mass and calculations of Galactic chemical evolution must use many more stars (and with a range of initial metallicities) than the five presented here.
5.3 The -Process
Nuclei above the iron group up to about are produced in massive stars mainly by the -process. When these yields are combined with those of metal-poor stars that contribute correspondingly less -process, it is helpful if they are somewhat large, say at the factor of two level, compared to those for primary species like oxygen. For current choices of rates, our -process yields are, overall, consistent with this requirement. There is significant overproduction of the -process products in the range in the 25 , but this is partly offset, for many isotopes, by a more consistent production (relative to O) in the 15 model. This is because of the well known tendency of higher mass stars to be more effective in burning Ne (Prantzos, Hashimoto, & Nomoto 1990).
In terms of specific isotopes, Zn is underproduced in all cases studied. This nucleus may be a product of the neutrino wind from the proto-neutron star (Hoffman et al., 1996) not simulated here. The overabundance of the neutron-rich nickel isotopes, Ni, and other -process products in the mass range has been observed before (Timmes et al., 1995; Hoffman et al., 2001) and is still not well understood. This overproduction is especially pronounced in the 25 model. Chiefly due to a reduced Ne(,) rate in our “standard” rate set, we obtain a smaller -process overproduction in S25 compared to H25.
While the overproduction may be related to residual uncertainties in the stellar model, this is a place where the nuclear physics might also be suspect. For Ni in particular, the neutron capture rate given in Bao et al. (2000) is about a factor of three lower than that given previously in Bao & Käppeler (1987). Using the earlier rate, more Ni would be destroyed by neutron capture bringing the production factor down into the acceptable range. Both recommended rates are based on different extrapolations of the same experimental thermal neutron capture cross section. Both extrapolations assume s-waves, but the more recent one includes the estimated effect of a sub-threshold resonance (Beer, 2001). Such extrapolations have large uncertainties, especially for a heavy nucleus where resonance contributions can be expected already at around 30 keV. Therefore, it is important to measure the cross sections of the Ni isotopes directly in the relevant energy range.
The sensitivity of the -process to changes in the charged particle reaction rates can be seen by comparing to the results obtained with rate set N (NACRE). The ratio of the production factors from sets S and N is shown in Figs. 9–11. The overproduction of the problematic Ni isotopes is less pronounced with set N, but the production of all nuclides between Ni and Pd is reduced. This is mainly due to the different and Ne(Mg rates, particularly the latter. Consequently, the -isotopes at are also produced less because of the decreased production of seed nuclei in the -process. To underline the fact that the (,) and (,n) reactions on Ne are the main source of the differences, in Fig. 17 we show the result of a test calculation using the NACRE set but replacing the two rates in question by our standard rates as given in § 3.1.2.
The large uncertainty in a few NACRE rates allows the existence of a much stronger -process. Recent work (Costa et al., 2000) claims that, with a rate enhanced by a factor of over the recommended NACRE value, the well-known problem of the underproduction of the -isotopes of Mo and Ru might be cured. However, leaving aside the important question of whether such a large variation can be tolerated given more recent laboratory data (Jaeger et al., 2001), a dramatic alteration in rates of this sort would have consequences, not only for the -process, but for the production of numerous nuclei between Fe and Ru (Figs. 9–11). An intolerably strong -process may result. A strongly enhanced rate might also pose problems for the -process in AGB stars. We defer a detailed numerical study of this and related questions to another paper, but certainly a more accurate determination of the cross sections for Ne interacting with -particles should have a very high priority in the nuclear astrophysics laboratory.
On the other hand, a comparison of Models H25 and S25 (Fig. 12) shows considerable variations in the -process, especially for individual isotopes, despite the fact that both studies used the same rates for Ne(n)Mg and Ne(Mg. This is because H25 is the only case where the neutron-capture cross sections along with all Hauser-Feshbach rates were different. All other studies changed only the mass of the star, explosion energy, or charged-particle rate set. The size of the variations in Fig. 12 - up to a factor of 5 in some cases where the network of H25 was still adequate - suggests that there is still a lot of work to be done in the nuclear laboratory. For example, the capture rates were about a factor of two lower at -process temperatures for the Sr isotopes in Model H25 and up to three times greater for the -process isotopes of Mo. Inclusion of O as a neutron poison in Model S25, and not in H25, as well as a larger cross section for the neutron poison Mg in Model S25 also contributed to making the -process in S25 a little weaker.
Above the -process does very little, though there are redistributions of some of the heavy nuclei. This has a minor impact on the -process, as mentioned above. Most of the -process above mass is believed to come from AGB stars.
5.4 The n-Process
The base of the helium shell has long been promoted as a possible site for fast neutron capture processes as the supernova shock front passes (Hillebrandt et al., 1978; Truran et al., 1978). In our present models a slight redistribution of heavy mass nuclei was found at the base of the helium shell, including significant production of the gamma-ray line candidate Fe. Integrated over the star however, the production of either the -process in general, or an appreciable subset of -process nuclei above mass 100 was negligible compared with other species. Quite a few -process isotopes above the iron group, but lighter than mass A = 88 were made chiefly in the carbon and neon shells.
5.5 The -Process
The production of the “-process” nuclei results from photo-disintegration of heavy nuclei during hydrostatic and explosive oxygen and neon burning. This is more properly called the -process (Arnould, 1976; Woosley & Howard, 1978; Rayet et al., 1990, 1995). The present calculations are the first to follow the -processes through the presupernova stages and the supernova explosion in a self-consistent fashion. Here the -process operates in stellar regions that previously experienced the -process, with the ”seeds” being provided by the initial ”solar” distribution of these Pop I stars plus any additional production () that occured in-situ prior to explosion (Figure 8).
For the 15, 21, and 25 models, in the mass ranges and , the proton-rich heavy isotopes are produced in solar abundance ratios within about a factor of two relative to (Figs. 2, 5, and 6). Below and between the production of the proton-rich isotopes is down by about a factor of three to four. Similar trends can be found in all our models, although with different magnitudes. The total production of the proton-rich isotopes increases for higher entropy in the oxygen shell, i.e., with increasing mass of the helium core, as one can see in the 25 star, but also depends on details of stellar structure and the composition of the star at the time of core collapse.
It is interesting to note that in some stars, production of the -process nuclei occurs to varying extents in the oxygen burning shell before the explosion. For example, in the 25 star, -nuclei with are made before the explosion (as also noted by Hoffman et al. (2001)), but essentially none for (Fig. 7). In the 21 star a large production of -nuclei at occurs before the explosion (Fig. 8). This pre-explosive production is even more pronounced in the 20 model where the carbon and oxygen shells merged. Indeed, some of the production factors of -nuclei in the 20 model are so large that they will remain important even if this is a comparatively rare event. The 15 star shows a significant -process in the region before the explosion, but not around . In the 19 star, essentially no -process occurs before the collapse. The details of the pre-explosive -production depend, of course, on the adopted convection model (Bazan & Arnett, 1994).
Once again, the diversity of nucleosynthetic outcomes for stars of comparable mass is highlighted. A fine grid of masses must be calculated to correctly weight all these contributions. Because it depends on the extent of prior -processes, the depth and possible merging of convective shells in the last hours of the stars life, and the strength of the explosion, the -process yields of stars can vary wildly. Ultimately this may make the -process an important diagnostic of stellar evolution.
In terms of nuclear physics, it should be noted that the (,)/(,n) branching at Gd, which determines the production ratio Sm/Sm (Woosley & Howard, 1990; Rauscher et al., 1996), is now known to much better accuracy than in previous investigations (see § 3.3). Although the experiment of Somorjai et al. (1998) did not quite reach the relevant energy window, it highly improved on the necessary extrapolation and yielded an S-factor which was several orders of magnitude lower than previous estimates. The remaining uncertainty is almost entirely due to the Gd(,n)Gd branch. Obviously, the total production of Sm and Sm is still sensitive to a number of photodisintegration rates only known theoretically.
5.5.1 The case of Ta
The production factors of the isotope Ta, the rarest stable nuclear species in the solar abundance pattern, needs special consideration. In the 25 model Ta shows a slight overproduction, despite our taking into account its destruction by de-excitation into the short-lived ground state through thermal excitation into an intermediate state (Belic et al., 2000). However, in the calculation we do not explicitly follow the population of ground and isomeric state and therefore what is found is rather the sum of the produced Ta+Ta. The nucleus Ta is peculiar in the way that its ground state has a half-life of only 8.152 h, much shorter than the half-life of the isomeric state with y. In order to determine the fraction of the long-lived isomer in the total yield one would have to know the population of ground and isomeric states. In Appendix B we show how to arrive at an estimate of the state population based on the experiment of Belic et al. (2000). It is concluded that about 30–50% of the produced Ta are actually in the isomeric state Ta. Therefore, our production factors and yields have to be renormalized by that factor. This brings the production factor of this isotope down into the acceptable range for all stellar models.
6 Summary and Conclusions
Using a nuclear reaction network of unprecedented size, nucleosynthesis has been investigated in several stellar models in the mass range 15 to 25 . The models include the best currently available nuclear and stellar physics. For the first time, it was also possible to self-consistently follow the -process up to Bi.
Overall good agreement can be achieved with the solar abundances of nuclei between O and Zr. This good agreement is, to first order, independent of the reaction rate set employed; our current standard, Angulo et al. (1999) or Hoffman et al. (2001), though several key nuclear uncertainties are identified. In addition to the well-known need for greater accuracy in the rate for -capture on , the rates for (,n) and Ne(Mg are critical. We also urge a re-examination of some of the neutron capture cross sections for the isotopes of nickel.
For the -isotopes, two regions of atomic mass are found where those isotopes are underproduced, and . It remains unclear whether this deficiency is due to nuclear cross sections, stellar physics, or if alternative (additional) -process scenarios have to be invoked. However, we find that part of the -nuclides may be produced in convective oxygen shell burning during the last hour of the star’s life. The remainder is made explosively.
Interesting and unusual nucleosynthetic results are found for one particular 20 model due to its special stellar structure. This effect, a merging of heavy element shells late in the stars evolution, seems to be confined to a narrow range of masses. In particular it is not seen in 19 and 21 models. However, we have explored a very limited set of masses and those only in one spatial dimension (for caveats see Bazan & Arnett 1994).
Appendix A A New Approach to Fitting Reaction Rates
Frequently, experimentalists find it easiest to provide reaction rate data in tabular form, but there are several issues that make using such tables difficult for the stellar modeler. First is the issue of accuracy. Most charged particle reaction rates change by many orders of magnitude over narrow temperature ranges, making direct interpolation difficult. To improve accuracy a fine temperature grid is required. Coupled with the vast number of reaction rates required in a large reaction network, the memory storage issues alone have historically forced the designers of astrophysical data bases to adopt fits to reaction rates, and accept a (marginal) loss of accuracy. This is especially true for theoretical (Hauser-Feshbach) reaction rates, which are often smooth enough to be accurately fit. Reaction rates that use a standard form, some combination of powers of temperature in a single exponential for example, are also particularly efficient to calculate on the machine. This is an important consideration when computing many thousands of rates in every zone of a star at every time step.
The most important rates (usually those on targets lighter than silicon, and especially those that play a dominant role in energy generation) have, until now, been fitted to analytical functions (Caughlan & Fowler, 1988; Angulo et al., 1999, who provide both tables and fits). Over the years these formulae have become increasingly diverse and complicated. These important reactions are small in number, and in principle can be used in tabular form.
We propose an approach that takes advantage of the best features of both approaches - analytic fits and tables - while functioning efficiently on the machine at a modest cost in memory allocation. All of the charged particle reaction rates from the recent compilation of Iliadis et al. (2001) were fit this way and used in our calculations.
The reaction rate as a function of temperature , provided in tabular form by the experimenter, is first fit to an analytic function chosen for its accuracy, speed in evaluation, and approximately correct physical behavior at low temperatures. For the charged particle reactions treated in Iliadis et al. (2001), we used Equation (8) of Woosley et al. (1978) (always fit in the exoergic direction):
| (A1) | |||||
where reflects the Coulomb barrier for a charged particle in the entrance channel of reaction , and are the charges of the target and incident particle, is the reduced mass of the compound system. This fit is intended to contain the bulk of the temperature dependence of the rate, but often does not, by itself, constitute an acceptable fit over the tabulated temperature range, especially if individual resonances are important. But also available from the fitting process are the residuals at each tabulated temperature. The logarithm of the ratios of the actual rate to the rate predicted by the fitting function are carried as a table in the computer and can be interpolated much more accurately than the rate itself. Such a procedure is directly analogous - for rates - to the traditional representation of cross sections as a value times an “S-factor” which contains the zeroth order Coulomb penetration function. Indeed the low temperature behavior of the analytic fit function is precisely that of a reaction rate calculated with a constant S-factor. Typical accuracy achieved at non-tabulated grid points is better than 10% at temperatures where the rate is important.
Appendix B Population of ground and isomeric state in Ta
The ground state of Ta has whereas the isomeric state is a state. Because of the spin and parity assignments, the isomeric state cannot directly decay into the ground state but when the nucleus is thermally excited it can be depopulated via an intermediate state which lies above the isomeric state. The temperature-dependent half-life derived in Belic et al. (2000) is based on the condition that the nucleus is in thermal equilibrium with the photon bath at a given temperature. In an explosive scenario Ta is produced at a temperature sufficiently high to provide thermal equilibrium. During freeze-out the populations of the states will remain in equilibrium as long as the temperature is high enough to sufficiently feed the ground state. Below a critical temperature , the de-excitation of the isomeric state will not be fast enough to compensate for the decay of the ground state and the isotope drops out of equilibrium. From that moment isomer and ground state have to be considered as two distinct species. Therefore, we have to take the population ratio at the lowest temperature (i.e., ) before equilibration ceases in order to determine how much Ta actually remains.
A time-dependent calculation of the transition probabilities and the speed of the process is very involved. However, an estimate of can be found by using the result of Belic et al. (2000). The effective half-life curve (figure 4 in that paper) shows three different regimes: i) at the states are fully equilibrated and the effective half-life is essentially the half-life of the ground state; ii) at the two states are fully decoupled and the contribution of the ground state to the effective half-life is negligible; iii) the intermediate region with is a transitional region in which the communication between the two states quickly ceases and equilibrium is not well established.
In thermal equilibrium the population of the isomer relative to the ground state is given by
| (B1) |
The effective decay rate is given by
| (B2) |
Thus, for there would be about 0.52 times as much Ta than Ta, i.e., we have to divide the final total abundance of Ta by three to get the surviving abundance of the isomer.
In order to get proper amounts of Ta and Ta one would have to know how much time is spent in the intermediate region. If that region is covered quickly, it should be safe to take . A choice of appears reasonable to compensate for neglecting the intermediate phase and any additional production in that phase. This would lead to a relative abundance of .
The temperature at which equilibrium is left does not strongly depend on the g.s. half-life. The largest uncertainty comes from the excitation energy of the intermediate state which is not well determined experimentally. However, based on the Belic et al. (2000) results we can assume an upper limit of Ta to be half of the Ta produced in our models and an educated guess would be between 0.3 and 0.5 of the produced Ta.
References
- Anders & Grevesse (1989) Anders, E., & Grevesse, N. 1989, Geochim. Cosmochim. Acta, 53, 197
- Angulo et al. (1999) Angulo, C., et al. 1999, Nucl. Phys. A, 656, 3
- Arnett et al. (1989) Arnett, W.D., Bahcall, J.N., Kirshner, R.P., & Woosley, S.E. 1989, ARA&A, 27, 629
- Arnould (1976) Arnould, M. 1976, A&A, 46, 117
- Bao et al. (2000) Bao, Z. Y.,Beer, H., Käppeler, F., Voss, F., Wisshak, K., & Rauscher, T. 2000, At. Data Nucl. Data Tables, 76, 70
- Bao & Käppeler (1987) Bao, Z. Y. & Käppeler, F. 1987, At. Data Nucl. Data Tables, 36, 411
- Bazan & Arnett (1994) Bazan, G., & Arnett, D. 1994, ApJ, 433, L41
- Beer (2001) Beer, H. 2001, priv. comm.
- Belic et al. (2000) Belic, D., et al. 2000, Phys. Rev. Lett., 83, 5242
- Blake et al. (1981) Blake, J. B., Woosley, S. E., Weaver, T. A., & Schramm, D. N. 1981, ApJ, 248, 315
- Boyes et al. (2002) Boyes, M. M., Heger, A., Woosley, S. E. 2002, ApJ, in preparation
- Buchmann (1996) Buchmann, L. 1996, ApJ, 468, 127
- Buchmann (2000) Buchmann, L. 2000, priv. comm.
- Burrows, Hayes, & Fryxell (1995) Burrows, A., Hayes, J., & Fryxell, B.A. 1995, ApJ, 450, 830
- Caughlan & Fowler (1988) Caughlan, G. A., & Fowler, W. A. 1988, At. Data Nucl. Data Tables, 40, 283
- Clayton (1968) Clayton, D. D. 1968, Principles of Stellar Evolution and Nucleosynthesis, (McGraw-Hill: New York).
- Cowan et al. (1985) Cowan, J. J., Cameron, A. G. W., & Truran, J. W. 1985, ApJ, 294, 656
- Costa et al. (2000) Costa, V., Rayet, M., Zappalà, R. A., & Arnould, M. 2000, A&A, 358, L67
- El Eid & Champagne (1995) El Eid, M., & Champagne, A. 1995, ApJ, 451, 298
- Fowler et al. (1975) Fowler, W.A., Caughlan, G.R., and Zimmermann, B.A. 1975, ARA&A, 13, 69
- Freiburghaus et al. (1999) Freiburghaus, C., Rembges, F., Rauscher, T., Kolbe, E., Thielemann, F.-K., Kratz, K.-L., Pfeiffer, B., & Cowan, J. J. 1999, ApJ, 516, 381
- Fryer & Heger (2000) Fryer, C.L. and Heger, A. 2000, ApJ, 541, 1033
- Fuller et al. (1980) Fuller, G. M., Fowler, W. A. & Newman, M. J. 1980, ApJS, 42, 447
- Fuller et al. (1982a) Fuller, G. M., Fowler, W. A. & Newman, M. J. 1982a, ApJ, 252, 715
- Fuller et al. (1982b) Fuller, G. M., Fowler, W. A. & Newman, M. J. 1982b, ApJS, 48, 279
- Fuller et al. (1985) Fuller, G. M., Fowler, W. A. & Newman, M. J. 1985, ApJ, 293, 1
- Fülöp et al. (1996) Fülöp, Zs., et al. 1996, Z. Phys. A, 355, 203
- Giessen et al. (1994) Giessen, U., Browne, C.P., Görres, J., Ross, J. G., Wiescher, M., Azuma, R.E., King, J.D., Vise, J.B., & Buckby, M. 1994, Nucl. Phys. A, 567, 146
- Görres et al. (1989) Görres, J., Wiescher, M., & Rolfs, K. 1989, ApJ, 343, 365
- Hansper et al. (1989) Hansper, V.Y., Tingwell, C.I.W., Tims, S.G., Scott, A.F., & Sargood, D.G. 1989, Univ. of Melborne School of Physics preprint UM-P-89/30
- Harris et al. (1983) Harris, M.J., Fowler, W.A., Caughlan, G.R., and Zimmermann, B.A. 1983, ARA&A, 21, 165
- Heger et al. (1997) Heger, A., Jeannin, L. , Langer, N., & Baraffe, I. 1997, A&A, 327, 224
- Heger et al. (2000) Heger, A., Langer, N., & Woosley, S. E. 2000, ApJ, 528, 368
- Heger et al. (2000) Heger, A., Hoffman, R. D., Rauscher, T., & Woosley, S. E. 2000, in Proc. 10 Workshop on Nuclear Astrophysics, Ringberg Castle, MPA/P12 (Garching: MPA), p. 105
- Heger et al. (2001a) Heger, A., Langanke, K.-H., Martinez-Pinedo, G., & Woosley, S. E. 2000b, Phys. Rev. Lett., 86, 1678
- Heger et al. (2001b) Heger, A., Woosley, S. E., Martinez-Pinedo, G., & Langanke, K.-H. 2001, ApJ, in press
- Herant et al. (1994) Herant, M., Benz, W., Hix, R.J., Fryer, C., and Colgate, S.A. 1994, ApJ, 435, 339
- Hillebrandt et al. (1978) Hillebrandt, W., & Thielemann, F. K., Klapor, H. V., & Oda, T. 1981, A&A, 99, 195
- Hoffman & Woosley (1992) Hoffman, R. D. & Woosley, S. E. 1992, Tables of Thermonuclear Reaction Rates , unpublished: see also http://csa5.lbl.gov/ fchu/hw92_1.html
- Hoffman et al. (1996) Hoffman, R. D., Woosley, S. E., Fuller, G., & Meyer, B. S. 1996, ApJ, 460, 478
- Hoffman et al. (2001) Hoffman, R. D., Woosley, S. E., & Weaver, T. A. 2001, ApJ, 549, 1085
- Holmes et al. (1976) Holmes, J., Woosley, S. E., Fowler, W. A., & Zimmerman, B. 1976, At. Data Nucl. Data Tables, 18, 305
- Iglesias & Rogers (1996) Iglesias, C. A., & Rogers, F. J. 1996, ApJ, 464, 943
- Iliadis et al. (2001) Iliadis, C., D’Auria, J., Sumner, S., Thompson, W., & Wiescher, M. 2001, ApJS, 134, 151
- Imbriani et al. (2001) Imbriani, G., Limongi, M., Gialanella, L., Terrasi, F., Straniero, O., Chieffi, A. 2001, ApJ, 558, 903
- Itoh et al. (1996) Itoh, N., Hayashi, H., Nishikawa, A., & Kohyama, Y. 1996, ApJS, 102, 411
- Jaeger et al. (2001) Jaeger, M., Kunz, R., Mayer, A., Hammer, J. W., Staudt, G., Kratz, K.-L., Pfeiffer, B. 2001, Phys. Rev. Lett., 87, 201803
- Janka & Müller (1996) Janka, H.-T. & Müller, E. 1996, å, 306, 167
- Janka (2001) Janka, H.-Th. 2001, A&A, 368, 527
- Käppeler et al. (1994) Käppeler, F., et al. 1994, ApJ, 437, 396
- Kiener et al. (1993) Kiener, J., et al. 1993, Nucl. Phys. A, 552, 66
- Kratz et al. (1993) Kratz, K.-L., et al. 1993, ApJ, 402, 216
- Kratz et al. (1996) Kratz, K.-L., et al. 1996, priv. comm.
- Kunz et al. (2001a) Kunz, R., Jaeger, M., Mayer, A., Hammer, J. W., Staudt, G., Harissopulos, S., & Paradellis, T. 2001a, Phys. Rev. Lett., 86, 3244
- Kunz et al. (2001b) Kunz, R., Fey, M., Jaeger, M., Mayer, A., Hammer, J. W., Staudt, G., Harissopulos, S., & Paradellis, T. 2001b, ApJ, in press
- Landré et al. (1990) Landré, V., Prantzos, N., Aguer, P., Bogaert, G., Lefebvre, A., & Thibaud, J. P. 1990, A&A, 240, 85
- Langanke & Martínez-Pinedo (2000) Langanke, K.-H., & Martínez-Pinedo, G. 2000, Nucl. Phys. A, 673, 481
- Limongi et al. (2000) Limongi, M., Straniero, O., & Chieffi, A. 2000, ApJS, 129, 625
- Mezzacappa et al. (1998) Mezzacappa, A., Calder, A. C., Bruenn, S. W., Blondin, J. M., Guidry, M. W., Strayer, M. R., & Umar, A. S. 1998, ApJ, 495, 911
- Mitchell et al. (1985) Mitchell, L.W., Kavanagh, R.W., Sevior, M.E., Tingwell, C.I.W., & Sargood, D.G. 1985, Univ. of Melborne School of Physics preprint UM-P-85/11
- Möller et al. (1995) Möller, P., Nix, J.R., Myers, W. D., & Swiatecki, W. J. 1995, At. Data Nucl. Data Tables, 59, 185
- Möller et al. (1997) Möller, P., Nix, J. R., & Kratz, K.-L. 1997, At. Data Nucl. Data Tables, 66, 131
- Morton et al. (1992) Morton, A.J., Tims, S.G., Scott, A.F., Hansper, V.Y., Tingwell, C.I.W., & Sargood, D.G. 1992, Nucl. Phys. A, 537, 167
- Myra & Burrows (1990) Myra, E. S., & Burrows, A. 1990, ApJ, 364, 222
- Nieuwenhuijzen & de Jager (1990) Nieuwenhuijzen, H., & de Jager, C. 1990, A&A, 231, 134
- Oda et al. (1994) Oda, T., Hino, M., Muto, K., Takahara, M., & Sato, K. 1994, Atomic Data & Nucl. Data Tables, 56, 231
- Prantzos, Hashimoto, & Nomoto (1990) Prantzos, N., Hashimoto, M., & Nomoto, K. 1990, A&A, 234, 211
- Rauscher et al. (1994) Rauscher, T., Applegate, J. H., Cowan, J. J., Thielemann, F.-K., & Wiescher, M. 1994, ApJ, 429, 499
- Rauscher et al. (2001) Rauscher, T., Hoffman, R. D., Heger, A., & Woosley, S. E. 2001, Nucl. Phys. A, 688, 193
- Rauscher & Thielemann (1998) Rauscher, T., & Thielemann, F.-K. 1998, in Stellar Evolution, Stellar Explosions, and Galactic Chemical Evolution, ed. A. Mezzacappa (IOP, Bristol), p. 483
- Rauscher & Thielemann (2000) Rauscher, T., & Thielemann, F.-K. 2000, At. Data Nucl. Data Tables, 75, 1; also available at http://quasar.physik.unibas.ch/~tommy/reaclib.html
- Rauscher & Thielemann (2001) Rauscher, T., & Thielemann, F.-K. 2001, At. Data Nucl. Data Tables, 79, 47
- Rauscher et al. (2000b) Rauscher, T., Thielemann, F.-K., Görres, J., & Wiescher, M. C. 2000b, Nucl. Phys. A, 675, 695
- Rauscher et al. (1997) Rauscher, T., Thielemann, F.-K., & Kratz, K.-L. 1997, Phys. Rev. C, 56, 1613
- Rauscher et al. (1996) Rauscher, T., Thielemann, F.-K., & Oberhummer, H. 1996, ApJ, 451, L37
- Rayet et al. (1990) Rayet, M., Arnould, M., & Prantzos, N. 1990, A&A, 227, 517
- Rayet et al. (1995) Rayet, M., Arnould, M., Hashimoto, M., Prantzos, N., & Nomoto, K. 1995, A&A, 298, 517
- Schaller et al. (1992) Schaller, G., Schaerer, D., Meynet, G., Maeder, A. 1992, A&AS, 96, 269
- Scott et al. (1992) Scott, A. F., Morton, A.J., Tims, S.G., Hansper, V.Y., & Sargood, D.G. 1992, Univ. of Melborne School of Physics preprint UM-P-92/16
- Scott et al. (1991) Scott, A.F., Morton, A.J., Tingwell, C.I.W., Tims, S.G., Hansper, V.Y., & Sargood, D.G. 1991, Nucl. Phys. A, 523, 373
- Sevior et al. (1986) Sevior, M.E., Mitchell, L.W., Tingwell, C.I.W., & Sargood, D.G. 1986, Nucl. Phys. A, 454, 128
- Somorjai et al. (1998) Somorjai, E., et al. 1998, A&A, 333, 1112
- Thielemann (1992) Thielemann, F.-K., 1992, priv. comm.
- Thielemann et al. (1987) Thielemann, F.-K., Arnould, M., & Truran, J. 1987, in Advances in Nuclear Astrophysics, ed. E. Vangioni-Flam (Editions Frontière, Gif sur Yvette 1987), p. 525
- Thielemann et al. (1996) Thielemann, F.-K., Nomoto, K., & Hashimoto, M. 1996, ApJ, 460, 408
- Thielemann et al. (1995) Thielemann, F.-K., et al. 1995, reaction rate library REACLIB, available at http://ie.lbl.gov/astro/friedel.html
- Timmes et al. (1995) Timmes, F. X., Woosley, S. E., & Weaver, T. A. 1995, ApJS, 98, 617
- Timmes, Hoffman, & Woosley (2000) Timmes, F. X., Hoffman, R. D., & Woosley, S. E., 2000, ApJS, 129, 377
- Truran et al. (1978) Truran, J. W., Cowan, J. J., & Cameron, A. G. W. 1978, ApJ, 222, 63
- Tuli et al. (1995) Tuli, J. K., et al. 1995, Nuclear Wallet Charts, 5 edition, Brookhaven National Laboratory, USA
- Weaver & Woosley (1993) Weaver, T. A., Woosley, S. E. 1993, Phys. Rep., 227, 65
- Weaver et al. (1978) Weaver, T. A., Zimmermann, G. B., & Woosley, S. E. 1978, ApJ, 225, 1021
- Wiescher (1995) Wiescher, M. private communication 1995
- Wiescher (1992) Wiescher, M. private communication 1992
- Wiescher & Kettner (1982) Wiescher, M., & Kettner, K.-U. 1982, ApJ, 263, 891
- Winters & Macklin (1988) Winter, R. R. & Macklin, R. L. 1988 ApJ, 329, 943
- Woosley & Howard (1978) Woosley, S. E., & Howard, W. M. 1978, ApJS, 36, 285
- Woosley (1988) Woosley, S. E. 1988, ApJ, 330, 218
- Woosley & Howard (1990) Woosley, S. E., & Howard, W. M. 1990, ApJ, 354, L21
- Woosley & Weaver (1995) Woosley, S. E., & Weaver, T. A. 1995, ApJS, 101, 181 (WW95)
- Woosley et al. (1978) Woosley, S. E., Fowler, W. A., Holmes, J. A., & Zimmerman, B. A. 1978, At. Data Nucl. Data Tables, 22, 371
- Woosley et al. (1990) Woosley, S. E., Hoffman, R. D., Hartmann, D., & Haxton, W. 1990, ApJ, 356, 272
- Woosley et al. (1994) Woosley, S. E., Wilson, J. R., Mathews, G. J., Hoffman, R. D., & Meyer, B. S. 1994, ApJ, 433, 229
- Woosley et al. (2002) Woosley, S. E., Heger, A., Weaver, T. A. 2002, Rev. Mod. Phys., in press
- Wrean et al. (1994) Wrean, P. R., Brune, C. R. & Kavanagh, R. W. 1994, Phys. Rev. C, 49, 2, 1205


f14.gif
This figure is available as a GIF graphic from the arXiv server
f15.gif
This figure is available as a GIF graphic from the arXiv server
f16.gif
This figure is available as a GIF graphic from the arXiv server
| () | () | () | () | () | () | |
|---|---|---|---|---|---|---|
| H | * WIES | 0. | 0. | 0. | 0. | 0. |
| H | * WIES | 0. | * CF88 | 0. | 0. | * CF88 |
| H | 0. | * CF88 | * CF88 | 0. | * CF88 | * CF88 |
| He | * WIES | 0. | 0. | * CF88 | 0. | * CF88 |
| Li | 0. | 0. | * CF88 | * CF88 | 0. | * CF88 |
| Li | * RA94 | * CF88 | * CF88 | 0. | * CF88 | * CF88 |
| Li | * WIES | 0. | 0. | 0. | * RA94 | FKTH |
| Be | 0. | 0. | * CF88 | * CF88 | 0. | * CF88 |
| Be | * WIES | * CF88 | * CF88 | 0. | * WB94 | 0. |
| B | 0. | 0. | * WIES | * CF88 | 0. | 0. |
| B | * WIES | 0. | * CF88 | 0. | * CF88 | 0. |
| B | * RA94 | * CF88 | * CF88 | * CF88 | * CF88 | 0. |
| C | * RA94 | 0. | * CF88 | * CF88 | 0. | 0. |
| C | * BAAL | 0. | * FCZ2 | * HFCZ | * HFCZ | * BU96 |
| C | * RA94 | * FCZ2 | * CF88 | 0. | * FCZ2 | RATH |
| C | * RA94 | * CF88 | * CF88 | 0. | * RA94 | * CF88 |
| N | * WIES | 0. | * KL93 | * HFCZ | 0. | 0. |
| N | * WIES | * FCZ2 | * CF88 | * LA90 | * CF88 | * FCZ2 |
| N | * WIES | * CF88 | * FCZ2 | * CF88 | * CF88 | * CF88 |
| O | 0. | 0. | 0. | * CF88 | RATH | * CF88 |
| O | 0. | 0. | 0. | * WK82 | 0. | * CF88 |
| O | * BAAL | 0. | * FCZ2 | * HFCZ | RATH | * CF88 |
| O | * RA94 | FKTH | * LA90 | 0. | * FCZ2 | * FCZ2 |
| O | * RA94 | FKTH | * CF88 | 0. | * CF88 | * GB94 |
| F | FKTH | 0. | * WK82 | * CF88 | 0. | 0. |
| F | FKTH | 0. | * WK82 | 0. | 0. | |
| F | * BAAL | * CF88 | * FCZ2 | * CF88 | * CF88 | 0. |
| Ne | RATH | RATH | * CF88 | RATH | RATH | RATH |
| Ne | * WM88 | RATH | * ID01 | * ID01 | RATH | RTGW |
| Ne | * BAAL | RATH | * ID01 | RATH | * FCZ2 | * HFCZ |
| Ne | * BAAL | * CF88 | * ID01 | RATH | * KA94 | * KA94 |
| Na | RATH | RATH | * ID01 | RATH | RATH | RATH |
| Na | RATH | RATH | * ID01 | * CF88 | RATH | RATH |
| Na | RATH | RATH | * ID01 | RATH | RATH | RATH |
| Na | * BAAL | * CF88 | * ID01 | RATH | RATH | RATH |
| Mg | RATH | RATH | * ID01 | RATH | RATH | RATH |
| Mg | RATH | RATH | * ID01 | RATH | RATH | RATH |
| Mg | * BAAL | RATH | * ID01 | * ID01 | RATH | RTGW |
| Mg | * BAAL | RATH | * ID01 | * CF88 | * FCZ2 | * HFCZ |
| Mg | * BAAL | RATH | * ID01 | RATH | * FCZ2 | * HFCZ |
| Al | RATH | RATH | * ID01 | RATH | RATH | RATH |
| Al | RATH | RATH | * ID01 | RATH | RATH | RATH |
| Al | RATH | RATH | * ID01 | RATH | RATH | RATH |
| Al | RATH | RATH | * ID01 | RATH | RATH | RATH |
| Al | * BAAL | RATH | * ID01 | RATH | * CF88 | RATH |
| Si | RATH | RATH | * ID01 | RATH | RATH | RATH |
| Si | RATH | RATH | * ID01 | RATH | RATH | RATH |
| Si | * BAAL | RATH | * ID01 | * ID01 | RATH | RTGW |
| Si | * BAAL | RATH | * ID01 | RATH | RATH | RATH |
| Si | * BAAL | RATH | * ID01 | RATH | RATH | RATH |
| P | RATH | RATH | * ID01 | RATH | RATH | RATH |
| P | RATH | RATH | ID01 | RATH | RATH | RATH |
| P | RATH | RATH | * ID01 | RATH | RATH | RATH |
| P | RATH | RATH | ID01 | RATH | RATH | RATH |
| P | * BAAL | RATH | * ID01 | RATH | RATH | RATH |
| S | RATH | RATH | * ID01 | RATH | RATH | RATH |
| S | RATH | RATH | * ID01 | RATH | RATH | RATH |
| S | * BAAL | RATH | * ID01 | RATH | RATH | RTGW |
| S | * BAAL | RATH | ID01 | RATH | RATH | RATH |
| S | * BAAL | RATH | ID01 | * TS92 | * TS92 | * TS92 |
| Cl | RATH | RATH | * ID01 | RATH | RATH | RATH |
| Cl | RATH | RATH | * ID01 | RATH | RATH | RATH |
| Cl | RATH | RATH | ID01 | RATH | RATH | RATH |
| Cl | RATH | RATH | ID01 | RATH | RATH | RATH |
| Cl | * BAAL | RATH | * ID01 | RATH | RATH | RATH |
| Ar | RATH | RATH | * ID01 | RATH | RATH | RATH |
| Ar | RATH | RATH | * ID01 | RATH | RATH | RATH |
| Ar | BAAL | RATH | * ID01 | ID01 | RATH | RTGW |
| Ar | BAAL | RATH | RATH | * SM86 | * SM86 | RATH |
| K | RATH | RATH | * ID01 | RATH | RATH | RATH |
| K | RATH | RATH | ID01 | RATH | RATH | RATH |
| K | RATH | RATH | ID01 | RATH | RATH | RATH |
| K | RATH | RATH | ID01 | RATH | RATH | RATH |
| K | * BAAL | RATH | ID01 | RATH | RATH | RATH |
| K | BAAL | RATH | RATH | RATH | RATH | RATH |
| K | * BAAL | RATH | RATH | * SM91 | RATH | RATH |
| Ca | RATH | RATH | * ID01 | RATH | RATH | RATH |
| Ca | * BAAL | RATH | * ID01 | RATH | RATH | RTGW |
| Ca | * BAAL | RATH | RATH | * MK85 | RATH | * MK85 |
| Sc | * BAAL | RATH | RATH | * HT89 | * HT89 | RATH |
| Ti | * BAAL | RATH | RATH | * MT92 | RATH | RATH |
| Ge | * BAAL | RATH | RATH | THIS | THIS | * FU96 |
| Sm | * BAAL | RATH | RATH | THIS | THIS | * SO98 |
Note. — Indicates the reaction rate was varied in the calculations (see the text). A ”*” indicates the reaction rate is based on experiment . A ”0.” indicates no rate is available for the given channel.