Optical Spectral Monitoring of XTE J1118+480 in Outburst: Evidence for a Precessing Accretion Disk?
Abstract
We present spectroscopic observations of the X-ray transient XTE J1118+480 acquired during different epochs following the 2000 March outburst. We find that the emission line profiles show variations in their double-peak structure on time scales longer than the 4.1 hr orbital period. We suggest that these changes are due to a tidally driven precessing disk. Doppler imaging of the more intense Balmer lines and the Heii 4686 line shows evidence of a persistent region of enhanced intensity superposed on the disk which is probably associated with the gas stream, the hotspot or both. We discuss the possible origins of the optical flux in the system and conclude that it may be due to a viscously heated disk.
To appear in the Astrophysical Journal
1 INTRODUCTION
X-ray Novae (XRNe) form a subclass of Low Mass X-ray binaries (LMXBs) which has provided us with some of the best stellar-mass black hole candidates (see the reviews by van Paradijs & McClintock 1995, van Paradijs 1998 and Charles 1998). These systems undergo occasional outbursts, with a recurrence time scale of decades, caused by an episode of intense mass transfer onto the compact primary via an accretion disk. A disk instability (Cannizzo, 1993, 1998) is generally invoked as the triggering mechanism for the outburst.
The XRN XTE J1118+480 was discovered on 2000 March 29 by the Rossi X-Ray Timing Explorer All-Sky Monitor (RXTE ASM) at the beginning of a prolonged outburst (Remillard et al., 2000). Reanalysis of the ASM data showed a previous outburst episode during January 2-29 (MJDs ; see Figure 1). The optical counterpart was identified with a 12.9 magnitude star coincident with an 18.8 magnitude object in the USNO catalogues (Uemura, Kato & Yamaoka, 2000a). Uemura (2000b) claimed the detection of superhumps in the outburst light curve with a periodicity of 0.1709 d. The spectrum of the optical counterpart was typical of X-ray binaries in outburst (Garcia et al., 2000), but the X-ray flux was low for an X-ray transient (Remillard et al., 2000). A high inclination system (Garcia et al., 2000) and/or a ’mini-outburst’ state (Hynes et al., 2000) have been suggested to explain the anomalous X-ray flux. Dubus et al. (2001) presented the first constraints on the system parameters from the analysis of spectroscopic observations during the outburst. McClintock et al. (2000, 2001a) and Wagner et al. (2000, 2001) derived an orbital period that was shorter than the Uemura’s determination (by respectively) from radial velocity measurements near quiescence. These authors determined the mass of the primary star to be . This places XTE J1118+480 among the dynamically confirmed black holes.
In this paper we present the results from a systematic spectroscopic campaign. Data were collected on 21 nights during 2000 March-July; on four of these nights we obtained almost complete orbital phase coverage.
2 OBSERVATIONS AND DATA REDUCTION
We monitored XTE J1118+480 for more than three months, beginning 2000 March 31 (UT) and continuing until July 10. The VSNET light curve, which covers most of this period, shows that the source brightness was V=13 during 2000 April 3 - June 6. Optical spectra were obtained using the FAST spectrograph (Fabricant et al., 1998) attached to the 1.5 m Tillinghast telescope of the Fred Lawrence Whipple Observatory. The spectra cover the 3600 - 7500 Å range with a resolution of 4.5 Å FWHM. A HeNeAr lamp spectrum was taken inmediately after each object exposure in order to determine the wavelength calibration. The flux standards Feige 34, Feige 56, Hiltner 600, and BD+33 2642 were observed throughout the run in order to correct for the instrumental response. While occasional clouds and variable seeing do not allow an absolute flux calibration, the shape of the continuum is reliable except at the extreme blue and red ends (shortward of 4000 Å and longward of 6800 Å). Spectra were extracted, wavelength- and flux-calibrated using the KPNO IRAF package. Details of the observations are summarized in Table 1.
3 ANALYSIS
3.1 The Averaged Spectrum
In Figure 2, we present the spectrum of XTE J1118+480 obtained by averaging the individual spectra observed on night March 31. The spectrum shows clearly the presence of broad double-peaked emission lines of Heii 4686 and the Balmer series (up to H). Weaker Heii and emission lines from Hei at 4471, 4921, 5875, and 6678 are recognizable. Except for H, the emission cores in the Balmer lines and Hei are contained within broad absorption features. The Bowen blend is not present during this night (but see below). The broad bump at 4200 Å is probably an instrumental artifact. The main interstellar feature is the faint blend due to the Na D doublet at 5890 and 5896 Å. We measure the equivalent width of this feature to be Å (close to the noise level) indicating very low interstellar absorption. However, we cannot exclude a contribution from the Hei 5875 emission line and consequently the measured equivalent width is an upper limit. Longward of 6800 Å, the spectra are contaminated by telluric features.
As reported by Garcia et al. (2000), two unusual absorption features at 6479 and 6516 Å were present on the blueward side of the H profile in all our observations (see Figures 3 and 4). They must be associated with the accretion disk because in outburst the disk spectrum strongly dominates over the spectrum of the faint (V=18.8) secondary star. We suggest that both features are due to the superposition of a single broad absorption trough and an emission component due to a blend of Fei/Cai lines. This metallic blend is observed in absorption at in late G-K stars (Horne, Wade & Szkody, 1986), which implies that it originates in regions of the disk with T 4200-6000 K. It is also possible that Feii contributes to the absorption features at this wavelength.
The spectra acquired during the same night or contigous nights (when the number of spectra was limited) were averaged. The resulting mean spectra were de-reddened using and . The colour excess was estimated by using the hydrogen column in the line of sight (N cm-2; Dickey & Lockman 1990) and the relation between NH and of Bohlin, Savage & Drake (1978). Next we fitted the de-reddened spectra with a power law of the form after masking the major emission lines. We measure a mean power law index of in agreement with the values reported by Dubus et al. (2001).
3.2 The Long-term Evolution of the Emission Lines
We studied the more intense emission lines as follows: for each spectrum we fitted a low order spline to the adjacent continuum of every profile after masking the lines, and the spectrum was divided by the fitted function. Next, for those nights during which we obtained more than two spectra, we averaged the spectra. The H and Heii 4686 line profiles were fitted with a 2-gaussian function and the H profile with a 3-gaussian function (with one used to account for the absorption component) using the Marquardt algorithm (Bevington, 1969). Tables 2 and 3 list the values of the main fitted line parameters for the nights with good orbital coverage. In Table 4 we give the measured full width zero intensity (FWZI) and equivalent widths (EWs) for H, H, and Heii 4686. The EWs for additional lines are presented in Table 5. The uncertainties in the EWs and FWZIs were estimated by looking at the scatter in the values when selecting different wavelength intervals to set the local continuum level.
The mean peak-to-peak velocity separation for the H and H lines is comparable ( 1200 km s-1) with little change between different epochs. The peak-to-peak velocity separation of the Heii 4686 line ranges from 1600 to 2000 km s-1. This result suggests that the emission at H and H arises at a similar distance from the compact object and the Heii 4686 line is emitted from regions closer to the compact object. The velocity separation of the double-peaks in the H line is consistent with the values reported for other black hole XRNe during quiescence and outburst (see e.g. Table 1 in Smith, Filippenko & Leonard 1999). The FWZI of the H absorption component implies a projected velocity of 2900 km s-1 for the inner part of the optically-thick accretion disk emitting at this wavelength.
The most remarkable feature in the evolution of the emission lines is the change in the double-peak intensity, from almost symmetric peaks to enhanced redshifted or blueshifted peaks (see Figure 3). Even though this behavior in the poorly sampled nights might be attributable to an S-wave, a different explanation is required for the symmetric/asymmetric averaged profiles on March 31, April 12, 29, and May 25, where uniform orbital phase coverage should ensure the cancellation of any S-wave effect in the averaged profiles.
Finally, the Bowen blend appears marginally on April 3, probably blended with Heii 4686 on April 12 and clearly enhanced on April 29. A glance at the RXTE/ASM light curve (1.3-12.2 keV) of XTE J1118+480 (see Figure 1) shows that the enhancement in intensity occurs near the maximum in X-ray flux. On May 25, during the slow decay of the X-ray outburst, both the Bowen Blend and Heii 4686 have decreased in intensity.
4 DOPPLER TOMOGRAPHY
Although the emission lines show variations in the double-peak structure due to an S-wave emission component, our attempts to find a periodic radial velocity modulation failed due mainly to our low spectral resolution and the complexity of the line profiles. Fortunately, we can obtain valuable information by using the Doppler Tomography technique (Marsh & Horne, 1988) on those data sets with good orbital phase coverage. This technique reconstructs the brightness distribution of the binary system in velocity space, allowing us to localize the emission structures which are not easily recognizable in the individual spectra.
We use the maximum-entropy method (MEM) of building the tomograms, which gradually builds the emission structure from a default uniform image by reducing the between the data and the model fit. The optimal solution is selected among infinite possibilities by maximizing the entropy of the image. To obtain the tomograms, the orbital phases were determined using an orbital period P d and a time of minimum light To(HJD) 555This orbital period was obtained by using V-band photometry acquired during 2001 January 20, 21 and February 16, 17, and 19 with the 1.2 m telescope at the F. L. Whipple Observatory. The time of minimum light was derived from the spectroscopic ephemeris given in McClintock et al. (2001a), which corresponds to closest approach of the secondary to the observer.
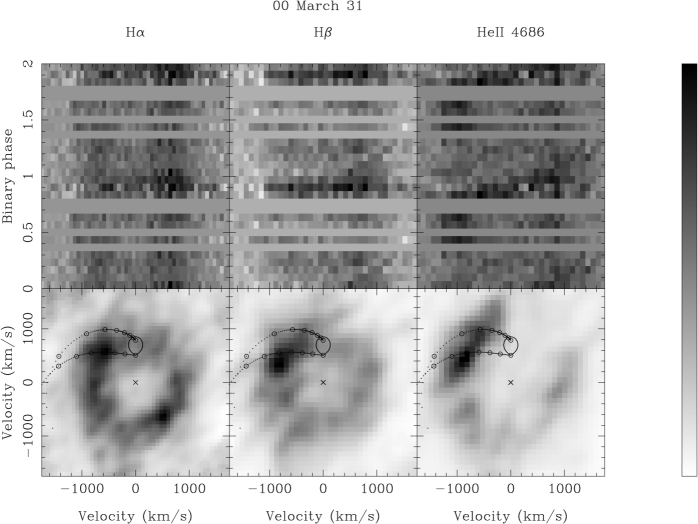
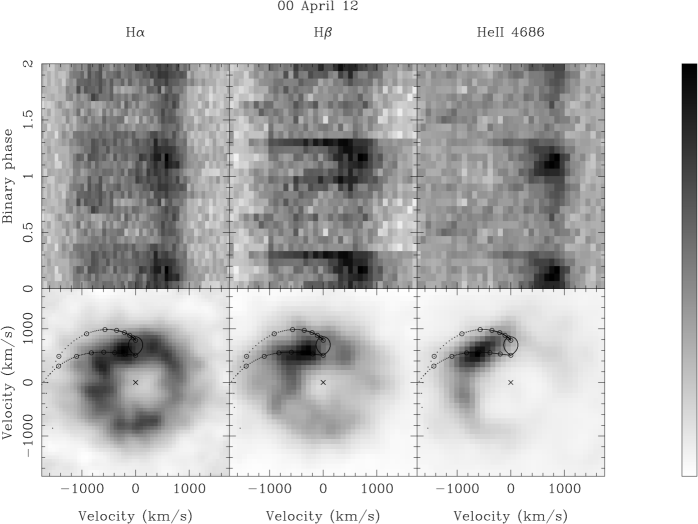
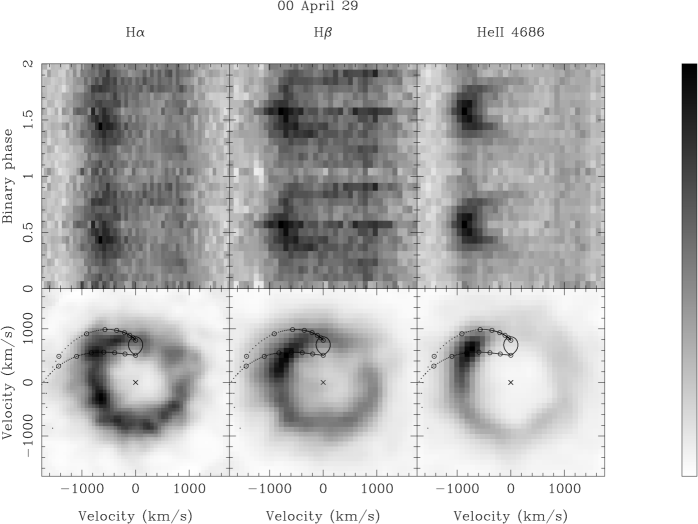
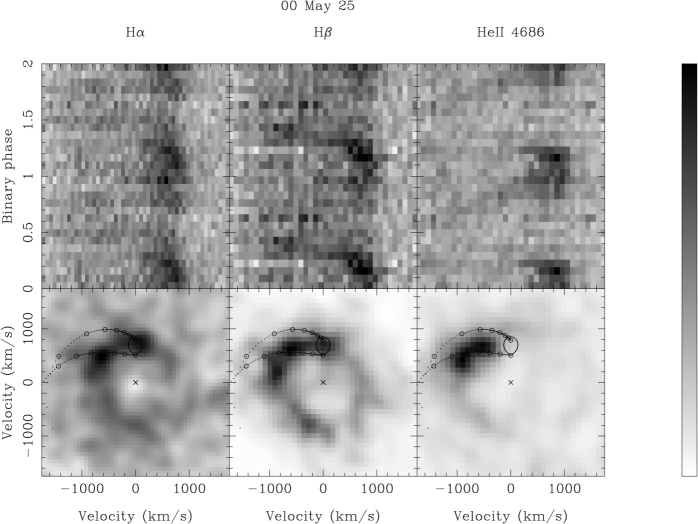
We have computed Doppler maps of the Heii 4686, H, and H lines for the nights March 31, April 12, 29, and May 25. Because MEM Doppler tomography cannot deal with negative values, the broad absorption in the H line was removed from each spectrum through a high-order spline fit to the profile, after masking the emission core. Figures 5-8 display the derived Doppler maps: the upper panels show the spectra in the form of trailed spectrograms constructed by folding the line profile spectra into 15 phase bins. The bottom panels show the MEM tomograms. Similar results were obtained using the filtered back-projection (FBP) technique666This technique has the advantage that no treatment is necessary for negative values in the spectra. (see Appendix in Marsh & Horne 1988), confirming that the H MEM images are not affected by the removal of the broad absorption troughs.
The trailed spectra show clear changes in the line behaviour: while on March 31 the Heii line and, to a lesser extent, the Balmer lines show a double-peaked profile with an S-wave component (which is also detectable on April 1), only enhancement in the red/blue peak of the profile is observed during the other nights. On the other hand, two emission structures are visible in the tomograms: the first is a ring, clearly visible in the Balmer images, which is a signature of emission arising from a rotating accretion disk. The second is an intense bow-shaped emission region, present both in the Balmer and Heii maps. Its position in the -VX, +VY quadrant places the plausible origin for this emission in the accretion gas stream, in the hotspot (the stream/disk impact region) or both. The presence of some of these physical structures on different nights argues for continuous mass transfer from the companion star during our observations.
We have plotted the theoretical path of the gas stream and the Keplerian velocities of the disk along the stream for K2=698 km s-1 (where K2 is the radial velocity semi-amplitude of the companion star; McClintock et al. 2001a) and a mass ratio (a reasonable value for a late-type secondary star and a M⊙ compact object). The Doppler maps appear to show that the region of enhanced intensity only partially overlaps the region delineated by these trajectories. A similar departure from the theoretical paths has been observed in the CVs OY Carinae (Harlaftis & Marsh, 1996) and WZ Sge (Spruit & Rutten, 1998). Note however that the accuracy of our ephemeris is such that random offsets amounting to 0.06 in orbital phase (i.e. an angular offset of about 20∘) are possible. If the maps are rotated clockwise by 20∘, the bright spot would lie between both trajectories. Again this would be a strong indicator for the presence of a hotspot (see Marsh et al., 1990) or/and the accretion gas stream.
5 DISCUSSION
5.1 Disc Precession
Asymmetric emission line profiles have been observed in several SU UMa systems, i.e. in those dwarf novae (DNe) which suffer superoutbursts (for a review see Warner, 1995). After maximum light, the SU UMa optical light curves exhibit a modulation at a period slightly longer than the binary orbital period, called the superhump period. A tidal resonance model (see e. g. Whitehurst & King 1991) is commonly used to explain the superhump period: at this stage of the superoutburst an extended accretion disk forms which, as a consequence of the tidal influence of the secondary, becomes elliptical and precesses. It is presently believed that enhanced viscous energy dissipation due to the tidal stresses from the secondary is the dominant superhump light source. Such a disk has been used to explain, for example, the asymmetric H profile in OY Carinae (Hessman, 1992) and the systematic variations in the velocities of the central absorption feature observed in the emission lines of ZCha (Vogt, 1981; Honey et al., 1988). Theoretical line profiles obtained using a model of a precessing eccentric accretion disk suggest that this is the case for IY UMa (Wu, Li & Gao, 2001). Similarly the long term variations we observe in the line profiles of XTE J1118+480 can be explained by the presence of an eccentric disk precessing around the compact primary with a period longer than the 4.1 hr orbital period. The detection of superhumps during the outburst (Uemura, 2000b) supports this suggestion. Indeed, our May 25 H map in particular suggests an elliptical disk (see Figure 8). However, the extent of the bow-shaped emission region makes any such ellipticity very difficult to quantify.
An estimation of the precession period can be calculated using (see Warner 1995), where Pprec and Psh are the precession and superhump periods respectively. The values of Psh reported by Uemura (2000b) and Porb (§4) imply a precession period of d. A precession period near quiescence of about 52 d was estimated by Casares et al. (2001). Since the motion of the compact object is expected to be small (K1=qK2=49 km s-1), we searched for a long term periodic modulation in the centroids of the Heii 4686 line profiles shown in Figure 3. We focused on this line because its measurement was unaffected by any nearby absorption feature. The centroid of the profiles was obtained by fitting a gaussian after masking the core of the line. A period search did not show any significant modulation within the expected period range. In addition, we searched the red/blue peak flux ratio of the HeII line for variability consistent with the predicted precession period range, but also without success. This perhaps is not surprising as we have only four nights of uniform orbital coverage.
5.2 X-ray Heating vs Viscous Dissipation
Does X-ray heating generate a significant amount of the optical flux from the disk? The slope of the optical spectrum might provide an answer, as for outbursting (optically thick) disks, standard disk theory predicts if there is no X-ray heating (Beall et al., 1984). However, the wide range of power law indices () measured by Shahbaz et al. (1996) in their sample of LMXBs indicates that the slope of the optical spectrum alone does not seem to be a reliable indicator of X-ray heating. On the other hand, the observation of superhumps in XTE J1118+480 and other black hole XRNe during outburst (O’Donoghue & Charles, 1996) does not in itself exclude X-ray heating as the dominant source of optical luminosity (Haswell et al., 2001).
Another way to estimate the contribution from X-ray irradiation is to use the relation between the absolute magnitude and the orbital period/X-ray luminosity for LMXBs found by van Paradijs & McClintock (1994). Wagner et al. (2001) derive a distance of d=1.90.4 kpc for XTE J1118+480. This implies an absolute magnitude of MV=1.6 in disagreement with the expected value for an irradiation-dominated disk of M 3.00.5 (van Paradijs & McClintock, 1994, Fig. 2). Here we have corrected the resultant absolute magnitude by - 0.7 mag to take into account that the visual luminosity due to X-ray reprocessing in the disk scales with the compact object mass as M. A 7 M⊙ black hole was assumed. Furthermore, it is clear from Fig. 2 of Uemura (2000c) that on at least two occasions, the source of the optical flux was other than X-ray irradiation. The first, before the end of the January outburst, was an optical flare (of amplitude 1.5 mag) without any accompanying X-ray flare. In the second event, at the beginning of the March outburst, the steep rise in the optical flux was accompanied by a much slower increase in the X-ray flux. Hence we think it unlikely that X-ray reprocessing dominates the outburst optical flux.
Viscous dissipation in the disk is an alternative explanation of the optical flux. Using the MV-Porb relation for DNe in outburst (Warner, 1987), we have estimated MV=4.7 for a DN with an orbital period of 4.1 hr. But since the area of the disk scales with the primary mass as M for a fixed orbital period (Cannizzo, 1998) and the energy released at a given distance from the primary scales with the primary mass as M1 (Frank, King & Raine, 1985), we expect the optical flux generated by a disk in a black hole XRN to be M higher than that emitted by a disk surrounding the 1 M⊙ primary in a DN. This correction implies M if XTE J1118+480 contains a 7 M⊙ black hole. Note that we have assumed a moderate inclination for the binary system. For an inclination , the outburst absolute magnitude of the viscously heated disk corrected using the prescription of Warner (1987) is M, close to the observed absolute magnitude. For , the inclination favoured when fitting the near quiescence optical light curve with an ellipsoidal model (McClintock et al., 2001a; Wagner et al., 2001), the above correction gives M. Although this magnitude is fainter than the observed absolute magnitude, DNe superoutbursts are 0.5-1 magnitudes brighter than normal outbursts and even 2 magnitudes brighter (or more) in the case of the TOAD superoutbursts (Howell, Szkody & Cannizzo, 1995; Kuulkers, Howell & van Paradijs, 1996). If the outburst in XTE J1118+480 is similar to a DN superoutburst then M. The presence of a bright, viscously heated disk is supported by the detection of a significant Balmer jump in the ultraviolet spectrum (Haswell, Hynes & King, 2000; McClintock et al., 2001b), which suggests an appreciable thermal disk contribution to the emission. Hence the viscously heated disk is likely to be a significant contributor to the optical flux during the outburst of XTE J1118+480 as in the SU UMa systems.
6 CONCLUSIONS
Multi-epoch optical spectroscopic observations of XTE J1118+480 yield valuable information about the properties and evolution of the accretion disk during outburst. The data reveal strong double-peaked H, H, and Heii 4686 emission lines whose double-peak intensity varies on time scales longer than the 4.1 hr orbital cycle. These changes in the line profiles can be interpreted as resulting from a precessing eccentric disk around the compact primary. However, a search for periodic variability in the Heii 4686 emission line failed to find a modulation within the estimated precession period range. Therefore conclusive evidence for a precessing disk in the system is still required. Doppler tomograms display a bright bow-shaped emission in the -VX, +VY quadrant which we interpret as emission from the accretion gas stream, the hotspot or both. A more accurate ephemeris is needed to properly constrain the location of the emission within the binary system. A comparison with DNe in superoutburst shows that viscous dissipation in the disk may make a significant contribution to the optical luminosity during outburst.
References
- Beall et al. (1984) Beall, J. H., Knight, F. K., Smith, H. A., & Wood, K. S. 1984, ApJ, 284, 745
- Bevington (1969) Bevington, P. R. 1969, Data Reduction and Error Analysis for the Physical Sciences (New York: McGraw-Hill)
- Bohlin, Savage & Drake (1978) Bohlin, R. C., Savage, B. D., & Drake, J. F. 1978, ApJ, 224, 132
- Cannizzo (1993) Cannizzo, J. 1993, in Accretion Disks in Compact Stellar Systems, ed. J. Wheeler (Singapore: World Scientific), 6
- Cannizzo (1998) Cannizzo, J. K. 1998, ApJ, 494, 366
- Casares et al. (2001) Casares, J., et al. 2001, IAU Circ. 7617
- Charles (1998) Charles P. A., 1998, in Theory of Black Hole Accre tion Disks, ed. M. A. Abramowicz, G. Bjornsson, & J. E. Pringle (Cambridge: Cam bridge Univ. Press), 1
- Dickey & Lockman (1990) Dickey, J. M., & Lockman, F. J. 1990, ARA&A, 28, 215
- Dubus et al. (2001) Dubus, G., Kim Rita, S.J., Menou, K., Szkody, P., & Bowen, D. V. 2001. ApJ, 553, 307
- Fabricant et al. (1998) Fabricant, D., Cheimets, P., Caldwell, N., & Geary, J. 1998, PASP, 110, 79
- Frank, King & Raine (1985) Frank, J., King, A. R., & Raine, D. J., 1985, Accretion Power in Astrophysics (Cambridge: Cambridge Univ. Press)
- Garcia et al. (2000) Garcia, M., Brown, W., Pahre, M., McClintock, J., Callanan, P., & Garnavich, P. 2000, IAU Circ. 7392
- Harlaftis & Marsh (1996) Harlaftis, E. T., & Marsh T. R. 1996, A&A, 308, 97
- Haswell, Hynes & King (2000) Haswell, C. A., Hynes, R. I., & King, A. R. 2000, IAU Circ. 7407
- Haswell et al. (2001) Haswell, C. A., King, A. R., Murray, J. R., & Charles, P. A. 2001, MNRAS, 321, 475
- Hessman (1992) Hessman, F. V., Mantel, K. H., Barwig, H., & Schoembs, R. 1992, A&A, 263, 147
- Honey et al. (1988) Honey, W. B., Charles, P. A., Whitehurst, R., Barrett, P. E., & Smale, A. P. 1988, MNRAS, 231, 1
- Horne & Cook (1985) Horne, K., & Cook, M. C. 1985, MNRAS, 214, 307
- Horne, Wade & Szkody (1986) Horne, K., Wade, R. A., & Szkody, P. 1986, MNRAS, 219, 791
- Howell, Szkody & Cannizzo (1995) Howell, S. B., Szkody, P., & Cannizzo, J. 1995, ApJ, 439, 337
- Hynes et al. (2000) Hynes, R. I., Mauche, C. W., Haswell, C. A., Shrader, C. R., Cui, W., & Chaty, S. 2000, ApJ, 539, L37
- Kuulkers, Howell & van Paradijs (1996) Kuulkers, E., Howell, S. B., & van Paradijs, J. 1996, ApJ, 462, L87
- Marsh & Horne (1988) Marsh, T.R., & Horne, K. 1988, MNRAS, 235, 269
- Marsh et al. (1990) Marsh, T.R., Horne, K., Schlegel, E. M., Honeycutt, R. K., & Kaitchuck, R. H. 1990, ApJ, 364, 637
- McClintock et al. (2000) McClintock, J, Garcia, M., Zhao, P., Caldwell, N., & Falco, E. 2000. IAU Circ. 7542
- McClintock et al. (2001a) McClintock, J. E., Garcia, M. R., Caldwell, N., Falco, E. E., Garnavich, P. M., & Zhao, P. 2001a, ApJ, 551, 147L
- McClintock et al. (2001b) McClintock, J. E. et al. 2001b, ApJ, 555, 477
- O’Donoghue & Charles (1996) O’Donoghue, D., & Charles, P. A. 1996, MNRAS, 282, 191
- Remillard et al. (2000) Remillard, R., Morgan, E., Smith, D., & Smith, E. 2000, IAU Circ. 7389
- Shahbaz et al. (1996) Shahbaz, T., Smale, A. P., Naylor, T., Charles, P. A., van Paradijs, J., Hassall, B. J. M., & Callanan, P. 1996, MNRAS, 282, 1437
- Smith, Filippenko & Leonard (1999) Smith, I. A., Filippenko, A. V., & Leonard, D. C. 1999, ApJ, 519, 779
- Spruit & Rutten (1998) Spruit, H. C., & Rutten, G. M. 1998, MNRAS, 299, 768
- Uemura, Kato & Yamaoka (2000a) Uemura, M., Kato, T., & Yamaoka, H. 2000a, IAU Circ. 7390
- Uemura (2000b) Uemura, M., et al. 2000b, IAU Circ. 7418
- Uemura (2000c) Uemura, M., et al. 2000c, PASJ, 52, 15L
- van Paradijs & McClintock (1994) van Paradijs, J., & McClintock, J. E. 1994, A&A, 290, 133
- van Paradijs & McClintock (1995) van Paradijs, J., & McClintock, J. E. 1995, in X-ray Binaries, ed. W. H. G. Lewin, J. van Paradijs & E. P. J. van den Heuvel. (Cambridge: Cambridge Univ. Press), 107
- van Paradijs (1998) van Paradijs, J. 1998, in The many Faces of Neutron Stars, ed. R. Buccheri, J. van Paradijs & M. A. Alpar (Dordrecht: Kluwer), 279
- Vogt (1981) Vogt, N. 1981, ApJ, 252, 653
- Wagner et al. (2000) Wagner, R. M., Foltz, C. B., Starrfield, S. G., & Hewett, P. 2000, IAU Circ. 7542
- Wagner et al. (2001) Wagner, R. M., Foltz, C. B., Shahbaz, T., Casares, J., Charles, P. A., Starrfield, S. G., & Hewett, P. 2001, ApJ, 556, 42
- Warner (1987) Warner, B. 1987, MNRAS, 227, 23
- Warner (1995) Warner, B. 1995, Cataclysmic Variables (Cambridge: Cambridge Univ. Press)
- Whitehurst & King (1991) Whitehurst, R., & King, A. J. 1991, MNRAS, 249, 25
- Wu, Li & Gao (2001) Wu, X., Li, Z., & Gao, W. 2001. ApJ, 549, L81


| Date | No. spectra | Exp. time | HJD start | HJD end | seeing |
|---|---|---|---|---|---|
| (UT) | (s) | (+2,451,000.) | (+2,451,000.) | (arcsec) | |
| 00 March 31aaOrbital phase complete or nearly complete. | 15 | 1300,9600,3900,21200 | 634.7056 | 634.9375 | 2-3 |
| 00 April 1 | 7 | 600 | 635.6384 | 635.9361 | 1-2 |
| 00 ,, 2 | 3 | ,, | 636.6492 | 636.9576 | ,, |
| 00 ,, 3 | ,, | ,, | 637.6169 | 637.9586 | ,, |
| 00 ,, 4 | ,, | ,, | 638.6186 | 638.9340 | ,, |
| 00 ,, 6 | 7 | ,, | 640.6394 | 640.9806 | 1 |
| 00 ,, 12aaOrbital phase complete or nearly complete. | 43 | 360 | 646.6485 | 646.8406 | 1-2 |
| 00 ,, 26 | 2 | 600 | 660.6628 | 660.8245 | ,, |
| 00 ,, 27 | 1 | ,, | 661.6482 | 661.6482 | ,, |
| 00 ,, 29aaOrbital phase complete or nearly complete. | 35 | 480 | 663.6204 | 663.8294 | ” |
| 00 May 8 | 1 | 300 | 672.6557 | 672.6557 | 1-2 |
| 00 ,, 10 | ,, | ,, | 674.7523 | 674.7523 | ,, |
| 00 ,, 11 | ,, | 600 | 675.6582 | 675.6582 | ,, |
| 00 ,, 12 | ,, | ,, | 676.6679 | 676.6679 | ,, |
| 00 ,, 24 | ,, | ,, | 688.6886 | 688.6886 | ,, |
| 00 ,, 25aaOrbital phase complete or nearly complete. | 44 | 40300,4600 | 689.6596 | 689.8398 | ,, |
| 00 ,, 29 | 3 | 160,2180 | 693.6482 | 693.6534 | 2 |
| 00 ,, 30 | ,, | 300 | 694.6414 | 694.6503 | ,, |
| 00 ,, 31 | 5 | ” | 695.6403 | 695.6569 | 1-2 |
| 00 July 6 | 1 | 900 | 731.6686 | 731.6686 | 1 |
| 00 ,, 10 | 8 | 300 | 735.6467 | 735.6733 | 1-2 |
| H | Heii | |||||
| Date | Vb | Vr | Vb | Vr | ||
| UT | (km s-1) | (km s-1) | (km s-1) | (km s-1) | ||
| March 31 | -64324 | 59820 | -88130 | 72130 | ||
| April 12 | -60129 | 52117 | — | 70713 | ||
| April 29 | -57614 | 62025 | -75612 | 122650 | ||
| May 25 | — | 57816 | — | 76026 | ||
| 3-gaussian fit | 1-gaussian fit | ||||||||
|---|---|---|---|---|---|---|---|---|---|
| Date | Vb | Vr | Vabs | FWHMabs | Vabs | FWHMabs | EWabs | ||
| UT | (km s-1) | (km s-1) | (km s-1) | (Å) | (km s-1) | (Å) | (Å) | ||
| March 31 | -49063 | 69046 | 12237 | 513 | 16831 | 633 | 2.50.2 | ||
| April 12 | -66151 | 49441 | 14430 | 492 | 18621 | 502 | 2.60.2 | ||
| April 29 | -65627 | 451155 | 373132 | 3611 | 30060 | 464 | 1.80.2 | ||
| May 25 | — | 71821 | -12048 | 5310 | -7129 | 643 | 2.70.1 | ||
| H | H | Heii | ||||||||
|---|---|---|---|---|---|---|---|---|---|---|
| UT Date | FWZI | EW | FWZIabs | FWZIem | EWem | FWZI | EW | |||
| March 31 | 6911 | -1.90.2 | 954 | 49 | -0.70 | 535 | -1.20.2 | |||
| April 12 | 632 | -1.60.1 | 985 | 49 | -0.61 | 6919 | -0.80.3 | |||
| April 29 | 716 | -2.10.1 | 829 | 54 | -0.95 | 552 | -1.40.1 | |||
| May 25 | 6010 | -0.90.2 | 972 | 47 | -0.49 | 672 | -0.90.2 | |||
| Date | Hei | Hei | Hei | Bowen | |
|---|---|---|---|---|---|
| UT | 6678 | 5875 | 4921 | blend | |
| March 31 | -0.60.1 | -0.30.1 | -0.20.1 | — | |
| April 12 | -0.50.1 | -0.50.1 | — | — | |
| April 29 | -0.60.1 | -0.30.1 | -0.30.1 | -0.20.1 | |
| May 25 | -0.30.1 | -0.30.1 | — | — |