The aperiodic variability of Cyg X-1 and GRS 1915 +105 at very low frequencies
Received :
)
We have carried out a timing analysis of Cyg X–1 and GRS 1915+105 using more than 5 years worth of data from the All Sky Monitor (ASM) on board the Rossi X-ray Timing Explorer (RXTE). We have obtained for the first time power density spectra, colour-colour and colour-intensity plots, cross-correlation functions and phase-lag diagrams to investigate the variability of the sources at frequencies Hz. We find that the power spectra are not flat but consistent with a power-law of index . This is the same slope as that found in the power spectra of Cyg X–1 during the soft state. In fact, the power spectrum of Cyg X–1 in the frequency range Hz appears as a continuation of the Hz power spectrum during the soft state. Significant variability, expressed as the fractional in the frequency range Hz, is detected at a level of 27% and 21% for GRS 1915+105 and Cyg X–1, respectively. Our results confirm previous suggestions that the innermost regions of the accretion disc, where the X-ray photons are produced, are affected by variations occurring at larger radii from the black hole, presumably due to changes in the mass accretion rate. We also observe strong spectral changes: in Cyg X–1 the spectrum softens as the flux increases when it is in the low/hard state, and hardens with increasing flux in the high/soft state. GRS 1915+105 follows the same trend as Cyg X–1 in the soft state, but the hardness ratios show a larger amplitude of variation. The cross-correlation shows that the variations occur simultaneously in all energy bands. However, the cross-correlation functions are asymmetric toward negative lags. The phase spectrum also reveals negative lags at periods larger than a few days, suggesting that the long term variations in the soft energy band are delayed with respect to the harder bands.
Key Words.:
stars: individual: Cyg X-1, GRS 1915+105 binaries: close – X-rays: binaries – accretion: accretion discs1 Introduction
Accreting black holes are currently among the most intensively studied objects in high-energy astrophysics. They are the sources of spectacular phenomena such as X/gamma-ray outbursts and relativistic jets and constitute important laboratories where the physics of accretion can be studied. The Rossi X-ray Timing Explorer (RXTE) has made unique contributions to our understanding of these extreme objects thanks to its high timing capability, allowing the study of the X-ray variability on the dynamical time scales of neutron stars and black holes. While the frequency range between 10-4–103 Hz is now well studied, i.e. time scales from milliseconds to hours, the characteristics of the variability at longer time scales ( Hz) are much less constrained. The study of the variability at such low frequencies is of great importance in the modeling of accretion discs since, as current models assume, it provides information on the outermost parts of the disc where changes are expected to occur on the viscous time scale.
Because of its brightness and the persistent nature of the high-energy radiation, Cyg X–1 is one of the best studied Galactic X-ray sources. It consists of a compact object orbiting the O9.7Iab blue supergiant HDE 226868, with an orbital period of 5.6 days. The mass of the compact companion has been estimated to be (Herrero et al. 1995), hence lying above the upper mass limit for neutron stars. For a summary of the properties of the two individual components and the orbital parameters of the system see e.g. Nowak et al. (1999). Its X-ray properties, such as the transient appearance of an ultra-soft component, the hard power-law spectrum at high energies, flickering, spectral transitions or low-frequency QPO have been considered as canonical signatures of black-hole candidacy. Especially important are the source state transitions since they cover a large range of X-ray flux and energy spectral evolution. Although up to five different spectral states have been identified in black-hole systems, the two main ones are the low/hard and the high/soft states. The low and high terms refer to the flux level in the 1–10 keV range, whereas the terms hard and soft refer to the absence or presence of a multicolour blackbody component in the same range, respectively. The shape of the power density spectrum (PDS) in the range Hz of Cyg X–1 is well established. In the low/hard state the PDS is flat from 0.002–0.2 Hz, it then steepens to a power-law with index up to a few Hz and steepens again to a slope of up to a few tens of Hz (e.g. Nowak et al. 1999). Above these frequencies Cyg X–1 shows another steepening at frequency Hz with the power-law changing to and a fractional amplitude between 100 and 400 Hz at the level of % (Revnivtsev et al. 2000). In the soft state a single power-law with index –1 fits the spectrum from 10-4 to 15–20 Hz, around which it changes to a slope of (Churazov et al. 2001; Revnivtsev et al. 2000).
GRS 1915+105 is a bright and highly variable X-ray source which is believed to harbour a black hole on the basis of its spectral and temporal similarities with other dynamically proven black-hole systems. Although initially it was considered a transient X-ray source it has never completely switched off since RXTE established continuous coverage in February 1996. It was the first Galactic object to exhibit superluminal radio jets (Mirabel & Rodríguez 1994). Recent near-infrared spectroscopic observations by Greiner et al. (2001) have identified a K-MIII star as the optical counterpart to GRS 1915+105. Thus, GRS 1915+105 unlike Cyg X–1, belongs to the class of low-mass X-ray black-hole binaries. However, no binary mass function or orbital period are known. The form of the power spectrum of GRS 1915+105 is highly variable and correlates with spectral and luminosity changes (Trudolyubov et al. 1999). GRS 1915+105 generally displays two spectral states: during the low luminosity state, also called plateau state (Dhawan et al. 2000) or state (Belloni et al. 2000) the power spectrum, in the 0.01–50 Hz frequency range, is characterised by a strong band-limited noise component (broken power-law) and one QPO peak (possibly with some harmonics). The continuum is flat below the QPO peak with power-law index 0.1–0.3 and steepens above the QPO to slope 2.5-3.0 (e.g. Reig et al. 2000). Most of the time GRS 1915+105 finds itself in a flare state, characterised by large X-ray flux variations. In this state the lower part of the power spectrum ( Hz) shows a notable rise approaching a simple power-law (e.g. Trudolyunov et al. 1999). A collection of power density spectra of GRS 1915+105 in different states can be found in Morgan et al. (1997).
Previous studies of the long-term variability of Cyg X–1 have concentrated on the search for periodic signals (Priedhorsky et al. 1983; Brocksopp et al. 1999; Kitamoto et al. 2000). In this work we carry out a timing analysis of the aperiodic variability by obtaining power-density spectra, colour-colour and colour-intensity diagrams, cross-correlation and phase-lag diagrams.
2 Data analysis and results
The light curves in the different energy ranges, which cover 5.7 years of data, from February 1996 to October 2001 (JD 2,450,139–2,452,200), were retrieved from the All Sky Monitor (ASM) Definitive Products Database. The ASM consists of three wide-angle () shadow cameras (SSC1–3) equipped with position-sensitive Xenon proportional counters with a total collecting area of 90 cm2. The ASM scans 80% of the sky every 90 minutes in a series of dwells of about 90 s each. Any given X-ray source is observed in about 5–10 dwells every day. The ASM is sensitive to X-rays in the energy band 1.3-12.2 keV, but also provides a nearly continuous monitoring of the X-ray sky in three sub-bands: 1.3-3.0 keV (band A), 3.0-5.0 keV (band B) and 5.0-12.2 keV (band C). We made use of data from SSC2 only since it has no gain evolution and hence no shifts in channel boundaries. For more information on the ASM see Levine et al. (1996).
2.1 Light curves and hardness ratios
Possible gaps due to detector failure or lack of data were filled by linear interpolation, adding appropriate random noise. The gaps are randomly distributed over the whole light curves. For the 1-day rebinned light curves the missing points represent about 9% for Cyg X–1 and 18% for GRS 1915+105. The average number of missing points per gap is 2. In order to have a larger frequency coverage in the power spectra, 0.5-day binned light curves were used. The results are consistent within the errors with those obtained using 1-day binned light curves.
We produced three hardness ratios by dividing the intensity of the different bands in the following way: HR1=[C]/[B], HR2=[C]/[A] and SR=[B]/[A].
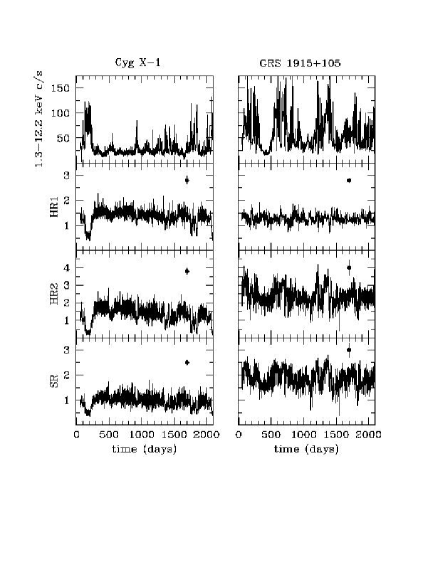
Figure 1 shows the overall 1.3–12.2 keV light curve and the evolution of the hardness ratios throughout the entire period considered in this work. Both Cyg X–1 and GRS 1915+105 are highly variable sources. When the whole ASM energy range is considered, they both show a fractional amplitude of 54%. However, X-ray variability in Cyg X–1 is strongly dependent on energy. While GRS 1915+105 is almost equally variable in all three energy ranges, with a slight increase of the fractional toward harder energies ([A]: 48%, [B]: 55%, [C]: 57%), hard X-rays in Cyg X–1 are three times less variable than soft X-rays ([A]: 98%, [B]: 59%, [C]: 30%). The errors in the fractional are 1%.
The average values of the hardness ratios are , and for Cyg X–1 and , and for GRS 1915+105. That is, on average, GRS 1915+105 shows a much harder spectrum.
2.2 Colour-colour and colour-intensity diagrams
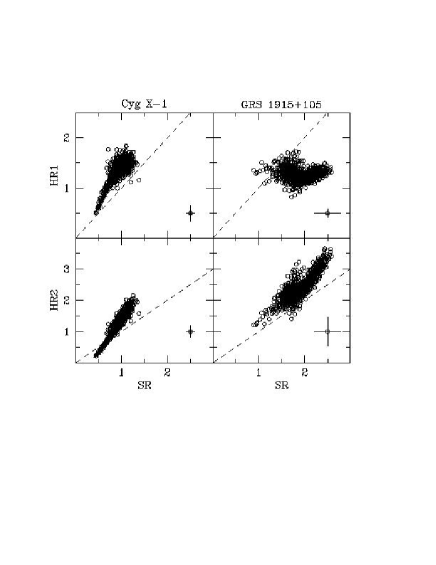
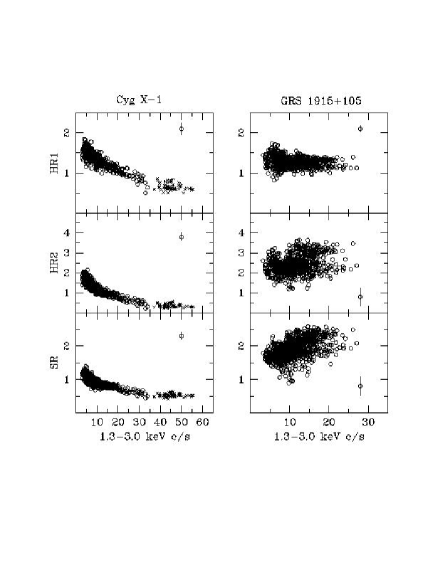
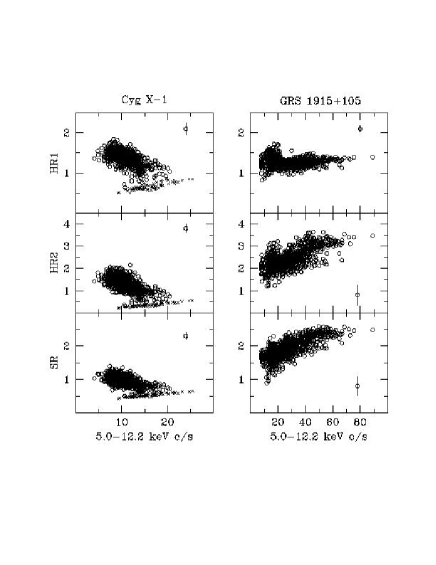
Colour-colour diagrams (CCD, Fig. 2) and colour-intensity diagrams (CID, Fig. 3 and Fig. 4) were obtained by plotting the hard colours HR1 and HR2 versus the soft colour SR and versus the soft (band [A]) and hard (band [C]) intensities, respectively. For the sake of clarity the individual errors of each point have been omitted. Instead, the mean error is plotted. Likewise, the data were rebinned so that one point represents a time span of two days.
The canonical low/hard and high/soft spectral states seen in black-hole systems show up in the CCD of Cyg X–1. During periods of high count rate the spectra become softer and the source moves to the left bottom part of the CCD (crosses), i.e. the regions enclosed by [HR2 1, SR 0.8] and [HR1 1, SR 0.8]. However, Cyg X–1 spends most of its life in the low/hard state as indicated by the high density of points at values of the harness ratios larger than 1. In contrast, in GRS 1915+105 these regions are not populated at all.
The low/hard and high/soft states are clearly separated in the hardness ratio versus hard intensity diagram of Cyg X–1 (Fig. 4). In the hard state, as the intensity increases the spectrum becomes softer, whereas in the soft state the opposite behaviour is observed, as the intensity increases the spectrum becomes harder. In GRS 1915+105 the changes are similar to those of Cyg X–1 in the soft state. The differences are the higher values and the larger amplitude of the hardness ratios. GRS 1915+105 finds itself most of the time in a sort of very high state (Belloni et al. 2000).


2.3 Power density spectra
In order to investigate the source variability we divided the light curves into 1024 day segments and computed the power-density spectra (PDS) by taking the Fast Fourier Transform of each segment. The resulting PDS were averaged together and rebinned in frequency to have at least 40 points per bin. The final PDS in each energy band are shown in Fig. 5 and Fig. 6. The PDS were normalized such that their integral gives the squared fractional variability (Belloni & Hasinger 1990).
The power spectra are characterised by an approximate power-law red-noise component with no sign of flattening at low frequencies. Although a simple power-law function did not provide a good fit to the PDS – the reduced was 1.9 and 2.8 for GRS 1915+105 and Cyg X–1, respectively – it allows direct comparison of our results with those found at higher frequencies (see below). The best-fit power-law index and variability (given as the fractional in the frequency range –) for the 1.3–12.2 keV PDS was , =27% and , =21% for GRS 1915+105 and Cyg X–1, respectively. While the slope does not show any dependence on energy in either system, the is much more dependent on energy in Cyg X–1 than in GRS 1915+105 (see discussion).
2.4 Cross-correlation functions and phase spectra
In order to study the correlation between the variations in the different energy bands we computed the cross-correlation function (CCF) and the phase spectrum between the light curves of the two sources in the three energy bands.
First, we divided all light curves into 10 parts, 200 days long each. For each part, we computed the CCF using the following equation,
where and denote each part of the observed light curves, and denote their respective means, and is the number of points in them. The in the above equation are the source standard deviations, i.e. the square root of the variance of each part minus the variance that is introduced by the experimental Poisson noise (which we approximate with the average square error of the points in the respective part). The summation goes from to , , and from to , . The resulting CCFs were averaged together and rebinned in order to have 50 points per bin.
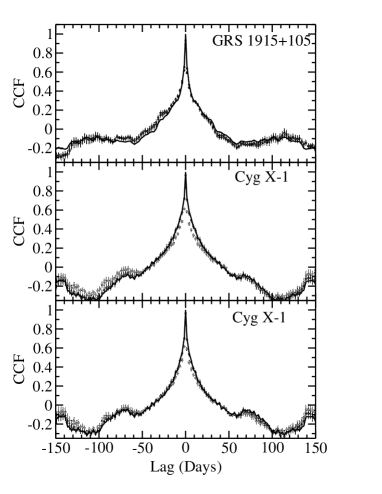
In all cases, we chose the lower-energy (i.e. band [A]) light curve as reference. Therefore, the presence of a CCF peak at positive lags would mean that the variations in the higher energy emission follow after those in the softer band. Our results are shown in Fig. 7. The solid lines in this Figure show the auto-correlation functions of the band [A] light curves. The [A,B] and [A,C] CCFs are shown with the grey/filled and open circles respectively. The CCFs are peaked at zero lag, with the CCF peak being larger than in all cases. This suggests that the variations in all bands are highly correlated, with no detectable delays between the different energy bands.
While the CCF peaks are clearly very close to zero lag, the CCFs are not symmetric. The asymmetry is toward negative lags and it is stronger in the case of the Cyg X-1 [A,C] CCF. In fact, at lags days, the band [A] light curve is better correlated with the band [C] light curve than it is with itself (Fig. 7). This result suggests that the low frequency component in the harder band leads the respective component in the softer one. In order to investigate further the asymmetry in the CCFs of Cyg X-1, we re-computed them ignoring the first 200 days of the lightcurves, when the source was in its soft/high state. The results are shown in Fig. 7 (bottom panel). The [A,C] CCF is still assymetric toward negative lags, but this effect is not as pronounced as before. In GRS 1915+105, the [A,B] and [A,C] CCFs have similar amplitudes, and are slightly asymmetric toward negative lags. At lags days the CCF is larger than the CCF at lags days.
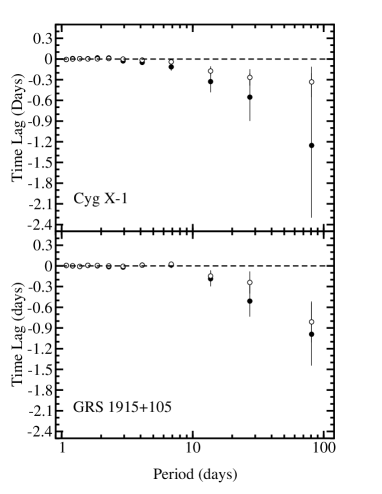
We also computed the phase spectrum between light curves at different energy bands. We first computed the cross spectrum, , where and are the complex Fourier coefficients for the two light curves at frequency , and is the complex conjugate of . We calculated an average cross vector, , by averaging the real and imaginary parts into bins containing 200 points (except the three longest period points for which we used a bin size of 100 and 50), and then we found the final value of phase versus frequency. Finally, we used Eq. (16) from Nowak et al. (1999) to measure its uncertainty.
Our results are shown in Fig. 8. This Figure shows the time lags (i.e. the phase spectrum divided by ) as a function of the Fourier period (i.e. ) for the bands [A,B] (open circles) and [A,C] (filled circles). In both sources, the time lags at periods up to days are consistent with zero. Above this period, the lags become negative, and their amplitude increases with period. This trend suggests that components at frequency in band [A] (soft band) are delayed with respect to the same components in bands [B] and [C] (hard bands), in agreement with the asymmetry that the CCFs show toward negative lags.
3 Discussion
Black-hole candidates are known to exhibit X-ray variability on a wide range of time scales from milliseconds to years. Previous work on the long-term X-ray variability of Cyg X–1 was carried out by Priedhorsky et al. (1983), based on data obtained by Vela 5B and Ariel 5, Brocksopp et al. (1999), using data from BATSE, RXTE and Kitamoto et al. (2000), based on data obtained by GINGA. They reported the presence of peaked features in the periodograms of Cyg X–1 corresponding to periods of 294 d (Priedhorsky et al. 1983) and 5.6 d (orbital period), 150 and 210–230 d (Brocksopp et al. 1999; Kitamoto et al. 2000). An epoch-folding analysis of the ASM RXTE data reveals a number of broad-peaked features. However, these features lie on top of a strong red-noise component, disputing their statistical significance.
Black-hole X-ray sources display at least two spectral states, high/soft and low/hard, depending on the strength of their soft ( keV) X-ray emission. The spectrum at high luminosities (soft state) consists of a soft component (normally modeled as a multicolour blackbody) and a power-law tail. This spectrum changes into an approximately single power-law form when the luminosity decreases (hard state). The most popular current models invoke an origin for the soft X-ray component in an accretion disc and the hard X-ray component via Comptonization of softer photons in a corona of high-energy electrons.
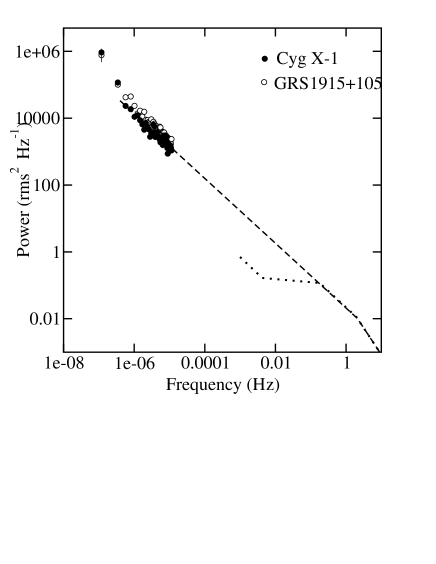
Cyg X–1 and GRS 1915+105 display similarities as well as differences in their behaviour on long time scales. They both show a similar power density spectrum in the frequency range Hz, namely, a strong red-noise component which can be represented by a power-law function with index –1. There is no sign of a break in the power law or of the presence of flat top noise. It is illustrative to compare our low-frequency power spectra with those produced at frequencies larger than Hz, as shown in Fig. 9. The dashed line represents the best-fit model to the PDS of Cyg X–1 at higher frequencies when the source is in the high/soft luminosity state (Cui et al. 1997). The dotted line represents the average PDS of Cyg X–1 in the low/hard state (Nowak et al. 1999).
The ASM power spectrum of Cyg X–1 in the energy range 1.3-12.2 keV is consistent with the extrapolation to lower frequencies of its power spectrum in the range Hz during the soft state (Fig. 9). During the soft state, the disc is believed to extend all the way to the last stable orbit. The observed variations in this state are believed to be related to changes in the structure, i.e. accretion rate, of the disc. Thus, the good agreement between the power spectra at very low and high frequencies in the soft state and the fact that significant variability is detected at these very low frequencies (fractional of 26% in Hz) imply that we are witnessing global changes in the structure of the accretion disc. The similarity, both in amplitude and shape, between the ASM power spectra of GRS 1915+105 and Cyg X–1 (unlike the high-frequency power spectra) suggests that the long term variations in GRS 1915+105 are also caused by global changes in the disc structure.
These changes must occur at large radii and propagate on the viscous diffusion time scale. An order of magnitude estimate of the typical length scales associated with the low-frequency variability rules out the corona as the origin of this variability. Indeed, the viscous time scale is given by (Frank et al. 1992)
| (1) |
where is the viscosity parameter, is the mass-accretion rate in units of 1016 g s-1, is the mass of the black hole in units of the solar mass and is the typical length scale for surface density changes in the disc in units of 1010 cm. Generally accepted values of the size of the Comptonizing corona, , range from 50–100 Schwarzschild radii (). Assuming typical values , , and we find day, clearly too short to explain the variability observed in the ASM power spectrum. The variability at the very low frequencies investigated here requires disc sizes of the order of 2500 Schwarzschild radii.
These results confirm the idea, suggested by Lyubarskii (1997) and developed by Churazov et al. (2001), that X-ray variability is caused by instabilities occurring in the accretion disc at very long distances from the black hole and then propagating into the innermost regions, where most of the gravitational energy is released and the X-rays are produced.
The differences between Cyg X–1 and GRS 1915+105 regard mainly the spectral behaviour of the systems and can be summarised as follows:
-
i)
The average values of the hardness ratios are higher in GRS 1915+105 than in Cyg X–1, indicating that its spectrum is harder.
-
ii)
During the hard state the spectrum of Cyg X–1 softens as the hard count rate increases. During the soft state the opposite trend occurs, i.e the spectrum is harder when the count rate is high. In GRS 1915+105 only a positive correlation is seen, namely, the spectrum becomes harder as the count rate increases.
-
iii)
Whereas Cyg X–1 exhibits a strong dependence of variability on energy, the variability of GRS 1915+105 is much less sensitive to energy. In GRS 1915+105, the fractional in the Hz range stays at a level of 27%, perhaps showing a slight increase from band [A] (24%) to band [C] (28%). In Cyg X–1 the goes from 27% in band [A] to 17% in band [C].
These differences can be explained by the limited energy range of the ASM (1.3–12.2 keV) and by the fact that, different components affect the X-ray emission in this band in the two sources differently. The long-term hardness ratio variations imply that the spectrum of Cyg X–1 lacks, most of the time, a soft component, whereas such a component seems to be an almost permanent feature in GRS 1915+105. This idea is borne out by the results of the fits of broad-band spectra to the disc blackbody plus power-law component model. In GRS 1915+105 the soft component, i.e. the multi-colour blackbody, although variable in strength is always present, with colour temperature of the disc at the inner radius 0.7 keV (Muno et al. 1999; Trudolyubov et al. 1999). In contrast, the characteristic colour temperature of the soft disc blackbody component in Cyg X–1 remains 0.3 keV (Dotani et al 1997, Frontera et al. 2001).
The trends in the CID of GRS 1915+105 are similar to those of the soft state of Cyg X–1. The main difference is, however, the fact that the hardness-ratio variations are of larger amplitude in GRS 1915+105. These variations could be caused by changes of the temperature of the multicolour blackbody component. As the temperature increases, the band [C] count rate increases and the spectrum becomes harder (i.e. the HR2 and SR values increase - Fig. 4). The hardening of the spectrum as a function of the band [A] count rate (Fig. 3) also suggests that a temperature increase is associated with an increase in the amplitude of the blackbody component. The small amplitude spectral variations in Cyg X–1, when in the soft state, could be explained assuming that the temperature of the blackbody component stays roughly constant, as it has probably reached its highest value. At this stage, any significant temperature variations are toward the direction of smaller temperature values, causing the object to go back to the hard state. The flux variations could be caused by blackbody amplitude variations which under approximately constant temperature would produce small spectral variations (as observed).
The much larger average values of the hardness ratios in GRS 1915+105 (especially HR2) also support the idea of a blackbody component being present most of the time and having a higher temperature (on average) than in Cyg X– 1. In GRS 1915+105 the long-term variations result from changes in the rather hot soft component (hot enough to affect all three energy bands). In Cyg X–1, bands [B] and [C] are probably significantly affected by changes in the hard power-law component as well. Therefore, in Cyg X–1, the X-ray variability is the result of variations in the soft as well as in the hard component, explaining the strong dependence of on energy. In GRS 1915+105 none of the three energy bands considered here is strongly affected by the power-law component. The X-ray variability reflects changes in the soft component, explaining the similarity of values in all three energy bands.
Finally, the cross-correlation analysis results show that the variations in the various energy bands occur simultaneously in both objects. The maximum correlation appears at lag zero, and is similar (in amplitude) in all CCFs except for the band [A,C] CCF of Cyg X-1. This result gives further support to the idea that in Cyg X-1 we are witnessing the contribution of two different components (i.e. the soft and the power law) in these bands. The decrease of the CCF peak is the result of the flux-dependent spectral changes of the source. Despite the fact that the maximum CCF peak appears at lag zero, the CCFs are asymmetric toward negative lags. This result is in agreement with the observed phase lags, which become negative at periods larger than a few days. This behaviour is different from what is observed at short time scales, where the variations at energy bands keV lag behind those at the soft band (i.e. keV) and the phase lags increase positively with period (Nowak et al. 1999). Both the CCF and the negative lags indicate that the long time scale variations in the hard band are leading those at the softer bands in both objects. One possibility is that the small scale variations affect simultaneously the inner region of the disk which is responsible for the emission at energies larger than say 1 keV (causing the CCF to peak at zero lag) while the large amplitude, long-term variations affect firstly the innermost parts of the disk (which are hotter and emit the higher energy photons) and then propagate toward larger radii. Perhaps these variations correspond to significant, structural variations in the disk (i.e. its “appearance” or “disappearance” of the inner disk) which propagate from the inner to the outer part.
4 Conclusion
The analysis of more than 5 years of continuous monitoring with the ASM RXTE instrument has revealed significant long-term X-ray variability in the black-hole systems Cyg X–1 and GRS 1915+105. The different long-term spectral behaviour between Cyg X–1 and GRS 1915+105 can be attributed to the different contribution of the spectral components to the energy range 1.3-12.2 keV. During the low/hard state of Cyg X–1, the hard power-law component extends well below 10 keV and dominates the spectrum. In contrast, the soft component accounts for most of the spectrum of GRS 1915+105 up to energies close to 10 keV. The absence of a break in the power spectrum, and the agreement between the ASM and the high-frequency power spectrum of Cyg X–1 in the soft state (a power-law with index ) imply that the long-term variability is likely to be associated with global structural changes in the surface density of the accretion disc caused by changes in the mass-accretion rate. The fact that the ASM power spectra of GRS 1915+105 and Cyg X–1 are very similar suggests the same origin for the long-term variations in GRS 1915+105 as well. Therefore, the disc changes occurring at large radii must be independent of the properties of the black hole and the structure of the innermost parts of the accretion disc.
If these perturbations propagate with the viscous time scale, then they cannot originate in the corona, i.e. in regions close to the black hole. This is an important result which demonstrates that disc variations at large radii also manifest themselves in the properties of the X-ray emission in black-hole binaries. Therefore, accretion disc models should be able to predict the correct shape and amplitude of the X-ray power spectra at very low frequencies. The detection of the break frequency at which the power spectrum finally flattens will provide important clues about the size of the accretion disc.
Acknowledgements.
Data provided by the ASM RXTE teams at MIT and at the RXTE SOF and GOF at NASA’s GSFC. The authors acknowledge partial support via the European Union Training and Mobility of Researchers Network Grant ERBFMRX/CT98/0195.References
- (1) Belloni, T., Hasinger, G., 1990, A&A, 230, 103
- (2) Belloni, T., Klein-Wolt, M., M ndez, M., van der Klis, M., van Paradijs, J., 2000, A&A, 355, 271
- (3) Brocksopp, C., Fender, R., Larionov, V., Lyuty, V., Tarasov, A., Pooley, G., Paciesas, W., Roche, P., 1999, MNRAS, 309, 1063
- (4) Churazov E., Gilfanov M., Revnivtsev M., 2001, MNRAS, 321, 759
- (5) Cui, W., Heindl, W.A., Rothschild, R.E., Zhang, S.N., Jahoda, K., Focke, W., 1997, ApJ, 474, L57
- (6) Dhawan, V., Mirabel, I.F., Rodríguez, L.F., 2000, ApJ, 543, 373
- (7) Dotani, T., Inoue, H., Mitsuda, K., et al., 1997, ApJ, 485, L87
- (8) Frank, J., King, A, Raine, D, 1992, in Accretion Power in Astrophysics, Cambridge University Press, p.99
- (9) Frontera., F., Palazzi, E., Zdziarski, A., et al. 2001, ApJ, 546, 1027
- (10) Greiner, J., Cuby, J.G., McCaughrean, M. J., Castro-Tirado, A. J., Mennickent, R.E., 2001, A&A, 373, L37
- (11) Herrero, A., Kudritzki, R. P., Gabler, R., Vilchez, J. M., Gabler, A., 1995, A&A, 297, 556
- (12) Kitamoto, S., Egoshi, W., Miyamoto, S., Tsunemi, H., Ling, J.C., Wheaton, W.A., Paul, B., 2000, ApJ, 531, 546
- (13) Levine, A. M., Bradt, H., Cui, W., Jernigan, J. G., Morgan, E. H., Remillard, R., Shirey, R. E., Smith, D. A, 1996, ApJ, 469, L33
- (14) Lyubarskii, Y.E., 1997, MNRAS, 292, 679
- (15) Mirabel, I. F., Rodriguez, L. F., 1994, Nature, 371, 46
- (16) Morgan, E.H., Remillard, R.A., Greiner J., 1997, ApJ, 482, 993
- (17) Muno, M. P., Morgan, E. H., Remillard, R.A., 1999, ApJ, 527, 321
- (18) Nowak, M. A., Vaughan, B. A., Wilms, J, Dove, J. B., Begelman, M. C., 1999, ApJ, 510, 874
- (19) Priedhorsky, W. C., Terrell, J., Holt, S. S., 1983, ApJ, 270, 233
- (20) Reig, P., Belloni, T., van der Klis, M., M ndez, M., Kylafis, N. D., Ford, E. C., 2000, ApJ, 541, 883
- (21) Revnivtsev, M., Gilfanov, M., Churazov E., A&A, 363, 1013
- (22) Trudolyunov, S., Churazov, E. & Gilfanov, M. 1999, Astron. Lett., 25, 718