Testing the line-driven disk wind model: time-resolved UV spectroscopy of IX Vel and V3885 Sgr
Abstract
To confront the predictions of the most recent line-driven disk wind models with observational evidence, we have obtained HST STIS (1180–1700 Å) echelle spectra of the nova-like variables IX Vel and V3885 Sgr at three epochs. The targets were observed in timetag mode for 2000 sec on each occasion, allowing us to study the spectral time evolution on timescales down to 10 sec. The mean UV spectra are characterised by the wind signature of broad blueshifted absorption in Ly, N v1240, Si iv1398, C v1549 and He ii1640. There is very little redshifted emission other than in C iv. Narrow blueshifted absorption dips, superposed on the broad absorption at around km s-1, accompany periods of well-developed wind activity. The continuum level and mean line profiles vary markedly from observation to observation – with the wind signatures almost disappearing in one epoch of observation of IX Vel. The strong positive correlation between UV brightness and wind activity predicted by line-driven disk wind models is disobeyed by both binaries.
The wind signatures in IX Vel’s UV spectrum are revealed to be remarkably steady on timescales ranging from 10 to 1000 sec. More variability is seen in V3885 Sgr, the binary with the lower opacity outflow. But there is only one epoch in which the line profile changes significantly in 100 sec or less. Narrow absorption dips, when present, show only smooth, small changes in velocity. We surmise these may trace the white dwarf’s orbital motion. The near-absence of line profile variability on the shorter 10- to 100-sec timescales, and the lack of correlation between wind activity and luminosity, could both arise if a non-radiative factor such as the magnetic field geometry controls the mass loss rate in these binaries.
keywords:
binaries:close – stars: mass-loss – novae, cataclysmic variables – ultraviolet:stars – line:profiles1 Introduction
Accretion disks are present in many astrophysical systems, with firm evidence for their existence in environments as diverse as those of young stars [Hartmann 1998], close binary systems and AGN (Frank, King & Raine 1985). Objects known to include hot optically-thick disks typically provide clear spectroscopic evidence of mass loss in the form of broad blueshifted UV absorption features.
Currently there are two main driving mechanisms envisaged for disk winds. The more widely studied of these, regarded as the only option for low-mass YSOs, relies on MHD processes (e.g. Ouyed & Pudritz 1997, Hirose et al. 1997, Konigl & Pudritz 2000). In high luminosity systems an alternative or additional method for driving an outflow is radiation pressure mediated by line opacity (hence the term ‘line-driven wind’). Until recently the multi-dimensional modelling required to deal with the geometry of a line-driven disk wind was beyond reach. However, this problem has now been approached numerically, with greater success, in the models of Pereyra, Kallman & Blondin (1997) and Proga, Stone & Drew (1998, hereafter PSD). As a result of this work, the radiation-driven wind model already provides some clear-cut predictions that can be put to the test against observations. Pre-eminent among these is the expectation that the wind mass loss rate will show a strong dependence on system luminosity (see Drew & Proga 2000).
PSD also predict unstable, clumpy outflow in the regime where the accretion disk, rather than the central object, contributes most of the radiant luminosity. Indeed, PSD’s simulations suggested that the dominant mass loss stream flowing away from the inner disk will include denser clumps of gas that fail to reach escape velocity and collapse back onto the disk at larger radii. A better treatment of the line-driving (Proga, Stone & Drew 1999) preserves this impression of a highly structured, clumpy outflow. When observed spectroscopically with a time resolution of less than the typical flow timescale this phenomenon could make itself apparent as narrow absorption components, superposed on the broad blueshifted absorption profile, sweeping both away from and in towards line centre.
With the aim of looking for the spectral signatures of disk-wind variability on suitably short timescales we have obtained Hubble Space Telescope (HST) observations of two high-state cataclysmic variables, using the Space Telescope Imaging Spectrograph (STIS). Specifically, our targets are the nova-like variables: IX Vel and V3885 Sgr. These binaries provide examples of disk winds where the line-driving mechanism may dominate over MHD processes in powering mass loss. Both IX Vel and V3885 Sgr are made up of a low mass star overflowing its Roche lobe and transferring matter to a non- or weakly-magnetic white dwarf (WD) via an accretion disk (i.e. they are UX UMa type cataclysmic variables). Both are known to persist in a high brightness state, powered by high mass accretion rates ( M⊙ yr). This puts these objects just within the domain where disk luminosities are (where is the Eddington luminosity) and spectral line opacity may be sufficient to power significant mass loss [Drew & Proga 2000]. Essentially all of the light from these systems at optical and ultraviolet wavelengths is due to accretion. A further factor influencing target choice is that IX Vel and V3885 Sgr are the brightest of the known UX UMa binaries. With the possibility of high-quality observation of the wind-shaped UV line profiles, these binaries can provide a particularly good test bed for line-driven disk wind models.
On timescales of weeks and months, IX Vel and V3885 Sgr vary by several tenths of a magnitude. In order to allow this secular variation to provide a sampling of a modest range of luminosity states , both targets were observed three times each at intervals of at least a month. Both targets are non-eclipsing systems. The broad blueshifted absorption features seen in the UV, that are indeed a common feature of the lower inclination UX UMa systems, are not usually very deep, making them ideal for studying the fine structure of wind-formed lines. To obtain the high time and wavelength resolution required for this programme, STIS was employed in its time-tag observing mode, using an echelle to disperse the light. This allows the observer to select the desired wavelength or time resolution at the point of data extraction and calibration. To ensure a minimum S/N ratio there is necessarily a trade-off such that higher time resolution will result in a reduced useable spectral resolution and vice-versa.
This is not the first use of the HST spectrographs for high time resolution studies of cataclysmic variable disk winds: Prinja et al. (2000a), (2000b) report results of Goddard High Resolution Spectrometer (GHRS) grating observations of respectively BZ Cam and V603 Aql. These data gave a time resolution of 80 and 30 seconds, timescales that are also comparable with the likely outflow timescales in these binaries (of order a few tens up to 100 seconds). Significant absorption line profile variability on timescales down to sec was reported. The key differences between these published studies and the present study lie in data quality – our brighter targets allow the use of the higher resolution echelle – and in the prior knowledge of the targets’ UV spectral characteristics.
The organisation of this paper is as follows. First, we present a brief description of the STIS/time-tag observations (section 2). The results are then presented in two ways: in section 3 we describe the time-averaged spectrum obtained at each epoch of observation, and then in 4 we re-present the data as spectral time-series at 30-sec time-resolution. In section 5, the results obtained are put into context and we review the variability uncovered in IX Vel and V3885 Sgr and compare with the prior examples of BZ Cam and V603 Aql. Prompted by our finding that wind activity seems to show no correlation with luminosity (thereby challenging the pure radiation-driven disk wind model), we revisit earlier-generation International Ultraviolet Explorer (IUE) spectroscopy of IX Vel in order to seek further evidence of this (section 5.3). We close with some thoughts on the next move in the quest for a fuller understanding of the driving of these accretion disk winds.
2 Observations and Data Extraction
Observations were performed by the STIS instrument on the Hubble Space Telescope, with the far ultraviolet (FUV) MAMA detector (1140–1735 Å). The E140M echelle grating with a central wavelength of 1425 Å was used. This configuration provides a resolution of . V3885 Sgr was observed with the 0.2″0.2″ aperture. IX Vel, the brighter target, had to be observed with the 0.1″0.03″ slit to reduce the likelihood of buffer overflow. Each observation was performed in a single telescope orbit for the maximum available time, with the detector set to time-tag mode. The dates and exposure times of our observations are given in table 1.
| Object | Date | Label | U.T. start time | Exposure |
|---|---|---|---|---|
| (2000) | (s) | |||
| IX Vel | 3rd April | I1 | 19:37:06 | 1750 |
| 30th May | I2 | 12:57:46 | 1750 | |
| 19th Aug | I3 | 08:31:29 | 1750 | |
| V3885 Sgr | 30th April | V1 | 08:01:20 | 2480 |
| 20th Aug | V2 | 03:09:13 | 2480 | |
| 13th Nov | V3 | 01:43:02 | 2480 |
All data calibration was performed with IRAF software, using the STSDAS package produced by the Space Telescope Science Institute (STScI). Time-tag is a photon counting mode, which provides an events stream with 125-time-resolution. This can be integrated over any selected time resolution (time bin) to produce a set of raw images of the echelle output, from which a 1-D spectrum is extracted and calibrated. The calibration, including doppler correction (on to the heliocentric frame) for the telescope’s motion, was performed with STScI’s CALSTIS package, using the suggested best reference files.
3 Secular changes in the mean UV spectrum
3.1 IX Vel
| Period (d) | |||
|---|---|---|---|
| -velocity ( km s-1) | |||
| -velocity ( km s-1) | 48 | ||
| Observation date | 3rd April | 30th May | 19th August |
| Dataset | I1 | I2 | I3 |
| Phase | |||
| Velocity ( km s-1) | |||
IX Vel is the brightest known nova-like variable, with apparent magnitude given at different times as [Klare & Neckel 1977] and [Schild et al. 1983]. It has a period of 465 and an orbital inclination estimated to be [Beuermann & Thomas 1990]. It exhibits flickering in the optical of mag on a timescale of minutes [Garrison et al. 1984].
Studies of the wind-formed UV resonance line profiles of IX Vel, based on high-resolution IUE spectra, have previously been carried out by Mauche [Mauche 1991] and by Prinja & Rosen [Prinja & Rosen 1995]. Mauche (1991) found subtle variations in the wind-formed UV line profiles, which he was able to link to orbital phase and he noted the presence of superposed narrow absorption components. Prinja & Rosen [Prinja & Rosen 1995] comment on the narrow absorption components as well and compare IX Vel with other high-state non-magnetic CVs.

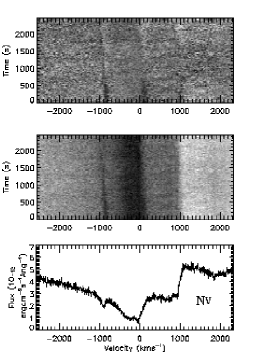
Figure 1 shows the mean spectrum obtained at each visit to the target (hereafter referred to as I1, I2 and I3). In the first two datasets IX Vel’s spectrum is characterised by broad blueshifted absorption profiles in Ly, N v1240, Si iv1398, C iv1549 and He ii1640. Redshifted emission is also present at low contrast in Ly and He ii, and much more prominently in C iv. However, in the third spectrum, only C iv retains a weak P Cygni profile, while the profiles of the other lines are more symmetrical around their rest wavelengths.
To ease comparison between observations obtained at different times, we have applied radial velocity corrections that should place the data in the WD rest frame. The most up-to-date spectroscopic ephemeris is given by Beuermann & Thomas (1990). These authors also calculated a mean disk -velocity of . We have used these data to estimate the expected mean WD radial velocities at the times of the HST observations. These are given in table 2.
Our calculations suggest that I2 and I3 were recorded when the target was at almost the same position in its orbit and when the WD line of sight (LOS) velocity was approaching a maximum towards the observer. I1 data were taken when the WD’s line of sight velocity was directed away from the observer. We cross-correlated I1 and I2 to determine the velocity shift between the redward absorption edges of the N v1240, Si iv1398 and C iv1549 lines in each dataset. This edge is redshifted in I2 when compared to I1, as expected from the predicted orbital motion. However, we measured a velocity difference between the two datasets of – apparently too large to be solely due to the orbital motion. This should be km s-1, if the Beuermann & Thomas (1990) ephemeris predicts the correct phases. Furthermore, we note that, according to the optically determined -velocity semi-amplitude, the measured velocity difference should not exceed km s-1.
| 3rd April | 30th May | 19th August | ||||
| I1 | I2 | I3 | ||||
| Flux | ||||||
| Index | ||||||
| Lines: | EW (Å) | EW (Å) | EW (Å) | |||
| C iii | ||||||
| Ly | ||||||
| N v | ||||||
| Si iv | ||||||
| C iv | ||||||
| He ii | - | |||||
Figure 2 presents close-ups of the higher-contrast line profiles seen in figure 1, with the C iv1549 line shown in more detail in figure 3. Maximum blueshift velocities measured from these are given in table 3.
In I1 and I2 the strong lines possess similar characteristics. Ly displays an asymmetric profile with blueshifted absorption. This is the first time that a significant Ly wind signature has been noted for this object. We also detect redshifted Ly emission to about 1000 km s-1. Other prominent lines, C iii1176, N v1240 and Si iv1398 have a structured asymmetric profile, with broad blueshifted absorption, but no emission. He ii1640 is also in absorption to km s-1, with an emission component extending to km s-1. The C iv1549 line is the broadest line, displaying absorption to and emission extending redwards to at least (see table 3). This is consistent with previous studies, e.g. Prinja & Rosen (1995), which have found that the C iv line tends to be formed over a larger volume than, for example, Si iv and N v.
The maximum velocity of blueshifted absorption is related to the maximum wind velocity, so it is interesting to note that this value varies little between I1 and I2 for all lines, despite the apparent drop of nearly a factor 2 in the UV continuum flux between I1 and I2. Also, the absorption minimum of all lines remains fairly constant at around km s-1, although the line profiles in I1 are more skewed.
We have measured absorption equivalent widths (EW) of the stronger lines (see table 3). Continuum placement was by eye and we estimate the typical error in each EW determination is 6 per cent. There is a systematic drop in EW from I1 to I2 in that the I2 EWs are per cent of their I1 values for the C iii, N v, Si iv and He ii transitions. The uniformity of this change indicates no clear shift either up or down in the wind’s ionization state. This, in turn, is an indication that the observed line transitions arise in ions that are abundant, rather than trace, ion stages for their respective elements. If any of them were from trace species we would expect them to stand out as markedly more sensitive than the others (e.g. either the high-excitation He ii1640 or the lower ionization Si iv1398 or Ly, all likely to be relatively low opacity line profiles, would show a bigger equivalent width change). The C iv EW shows essentially no change. This is not surprising for what is often deduced to be a highly opaque transition.
In I3 a broader, more symmetric absorption profile, without redshifted emission, is apparent in a range of transitions (for C iii1176 the profile spans km s-1, Ly spans km s-1, and N v1240 spans at least km s-1 and perhaps as much as km s-1, given that Ly obscures its blue wing). Beuermann and Thomas (1990) derive a WD mass of 0.8 (, ) M⊙. Using this datum in the WD mass-radius relation given by Nauenberg (1972), we derive a maximum line-of-sight Keplerian disk velocity of about 3400 km s-1 for . This permits the Ly and N v profiles seen in I3 to be rotationally broadened disk photospheric features. In Si iv, only the bluer component of the doublet, which has the higher transition probability, is present and it appears to sit on a broad, shallow absorption trough. The C iv1549 P Cygni profile is uncharacteristically weak, showing little emission, while He ii1640 has disappeared. This appears to be a rare instance of an almost pure high-state disk line spectrum, all but free of ‘contaminating’ wind features. At the same time, it is doubtful that the wind still exists at unchanged strength but with a higher degree of ionization than witnessed in I1 and I2. This is because we would then expect either to continue to observe significant blueshifted N v absorption or to detect significant He ii1640 emission (due to recombination of He2+ which would have to be very abundant).
![[Uncaptioned image]](/html/astro-ph/0112424/assets/x2.png)
A power law continuum fit was made to each mean spectrum, defining the wavelength ranges 1260–1270 Å, 1460–1470 Å and 1660–1670 Å as line-free continuum windows. Table 3 lists the power law indices and the average flux in the range 1260–1270 Å for each dataset.
Both I1 and I2 fit to essentially the same power-law index (). The continuum level of I3 lies in between that of the other two datasets, but fits to a steeper power law (), and hence is a ‘bluer’ spectrum. The near-absence of wind signatures indicates a greatly-reduced mass loss rate (by an order of magnitude or more). These two attributes can be linked, since Balmer continuum emission will be more pronounced in a denser wind. The reddening of the observed continuum in I1 and I2 then follows from the fact that Balmer continuum emission on its own rises steeply with increasing wavelength up to the Balmer limit at 3646 Å. In this picture, I3 is as blue a spectrum as it is because of the near absence of this redder component. The presence of Balmer continuum emission has also been noted in the UV spectrum of UX UMa by Knigge et al. (1998) and Baptista et al. (1998).
Finally, we draw attention to the surprising collapse of wind activity in I3 at a time when the UV continuum was apparently at a level intermediate between that seen in I1 and I2. This spoils a clear correlation between UV brightness and strength of wind signature and raises a problem for the concept of a radiation-driven disk wind. We return to this in section 5.3.

3.2 V3885 Sgr
V3885 Sgr’s apparent magnitude is typically [Hollander et al. 1993]. IUE low-resolution spectra of V3885 Sgr have been analysed by Woods et al. [Woods et al. 1992], who found evidence for variation in the N v1240 resonance line in phase with the C iv1549 line. As for IX Vel, Prinja & Rosen [Prinja & Rosen 1995] remarked on evidence for narrow absorption components in the C iv1549 and N v1240 line profiles.
Cowley, Crampton & Hesser (1977) derived a 504 orbital period from radial velocity variations of Balmer absorption lines. Haug and Drechsel (1985) used the same technique to derive a zero-phase ephemeris, JD and period, . In their study this was the most probable period yielded by a power spectrum analysis, but other periods were found to be only one per cent less likely. Metz (1989) quotes a period of 5191, but the experimental technique used to obtain this is not described. In the literature this last period is most often quoted, but it is not certain why this is the case. Given the uncertainty in the orbital parameters of V3885 Sgr, the spectra of V3885 Sgr are presented without any orbital radial velocity correction.

Figure 4 shows the summed spectrum obtained from each visit to the target (hereafter referred to as V1, V2 and V3). Like IX Vel, V3885 Sgr’s spectrum is characterised by broad blueshifted absorption and some redshifted emission. Table 4 lists the power law indices and the average flux in the range 1260–1270 Å, calculated from a continuum fit to each spectrum, using the same method as for IX Vel (section 3.1). V2 is noteworthy in that the stronger absorption lines display significantly reduced asymmetry, with profiles that drop steeply to their minima.
| 30th April | 20thAugust | 13th November | ||||
| V1 | V2 | V3 | ||||
| Flux | ||||||
| Index | ||||||
| Lines: | EW (Å) | EW (Å) | EW (Å) | |||
| Si iii | ||||||
| C iii | ||||||
| Ly | ||||||
| N v | ||||||
| Si iv | ||||||
| C iv | ||||||
| He ii | ||||||
The secular changes in the mean spectrum of V3885 Sgr are much like those seen in IX Vel: we have one dataset exhibiting well-developed broad blueshifted absorption and narrow superposed dips (V3, obtained last); a second dataset with somewhat reduced blueshifted absorption and no superposed dips (V1, obtained first), and a third set in which the wind signatures weaken noticeably (V2). We will discuss the observations in this order (V3, V1, V2) so as to parallel the discussion of IX Vel presented above. Figure 5 shows a close-up of the major line profiles seen in, respectively, V3, V1 and V2.
For the first time, in V3885 Sgr’s spectrum we see a wind signature in Ly, although the asymmetry is much weaker than for IX Vel and there is no redshifted emission component. We also detect blueshifted absorption in C iii1176, N v1240, Si iv1398 and, unusually, in the Si iii1206 line that is superimposed on the blue wing of Ly. The mean C iv1549 resonance line profiles are shown in more detail in figure 6. In V3 and V1, C iv blueshifted absorption extends to at least and redshifted emission reaches to around 2000 km s-1. He ii1640 absorption extends bluewards to around to km s-1, but there is only a barely detectable emission component.
In V3 the redmost point of absorption in each line profile closely lines up with the transition’s rest wavelength, whereas in V1 this feature is blueshifted. In section 3.1 we mentioned that this velocity shift could be related to the orbital -velocity phase. It is possible that observation V3 occurred near orbital phase zero or 0.5, while V1 occured when the WD was moving towards us in its orbit.
The continuum flux level is about ten per cent higher in V3 than V1 but, to within errors, the spectral index is the same (see table 4). In V3, the general shape of the line profiles is more asymmetric than in V1. In either epoch, the location of the absorption minimum is at about the same velocity for all the lines: at around km s-1 for V3 and around km s-1 for V1. This difference could well be due to the, as yet, unknown radial velocity shift between the two datasets.
V2 possesses the highest recorded continuum flux level, yet its line profiles retain the weakest wind signature. C iii1176, Ly, N v1240 and Si iv1398 show little, if any, blueshifted absorption. The C iv1549 emission peak is per cent (relative to the continuum) of the peak emission in the other two datasets. However it is also fair to characterise V3885 Sgr as apparently powering less mass loss at this time. The participation of the He ii1640 in this weakening (albeit a less dramatic effect than in IX Vel, I3) suggests that an upward shift in wind ionization, alone, cannot explain the changed character of the spectrum. We shall show in section 4.2 that the magnitude of the effect seen in V2 is enhanced by some shorter term variability. Some lines that are not seen in V1 and are only very weak in V3 can be clearly seen in V2. Note, for example, the lines superimposed on the blue wing of Ly between 1187 and 1203 A and the absorption line at 1543 A.
![[Uncaptioned image]](/html/astro-ph/0112424/assets/x5.png)

3.3 The superposed narrow absorption features
The high dispersion of the datasets presents an excellent opportunity for studying fine structure in wind-shaped line profiles. Both IX Vel and V3885 Sgr exhibit very narrow features of km s-1 breadth, superposed on the broad blueshifted absorption lines, some of the time. These features are seen clearly in only I1 (IX Vel) and V3 (V3885 Sgr) – the two datasets that also display the highest equivalent width of blueshifted absorption. They also appear fleetingly in V1 (see below and section 4). The absence of these narrow features in I2, I3 or V2, hints at a positive correlation between their appearance and the overall wind column as measured by total UV blueshifted absorption equivalent width.
| IX Vel (I1) | V3885 Sgr (V3) | |||
|---|---|---|---|---|
| Transition | Velocity (km s-1) | Velocity (km s-1) | ||
| Ly | ||||
| N v1238.8 | ||||
| N v1242.8 | ||||
| Si iv1393.8 | ||||
| Si iv1402.8 | ||||
| C iv1548.2 | ||||
| C iv1550.7 | ||||
Measured velocities for the narrow absorption components seen in IX Vel (I1) and V3885 Sgr (V3) are given in table 5. For consistency the velocities given for IX Vel are not corrected for putative WD motion and given as observed, as they are for V3885 Sgr. We therefore remind that the correction to the WD rest frame for I1 implied by data from Beuermann & Thomas (1990) is to blueshift the quoted velocities by a further 1735 km s-1. We suspect that the correction for V3 onto the WD rest frame is small given the near alignment in the N v1240 and C iv1549 profiles of the red absorption edges with the doublet rest wavelengths in the heliocentric frame (see also section 3.2).
In IX Vel, I1, it is striking that the same velocity of roughly km s-1 is picked out by narrow absorption features in four transitions, including Ly at one ionization extreme and N v1240 at the other. Coincidentally, in the spectrum of V3885 Sgr, V3, the blueshifted narrow absorption dips again cluster around a velocity of about 900 km s-1. It is true of both I1 and V3, that the dips are most prominent in the resonant C iv and N v transitions and essentially absent from the subordinate C iii1175 line.
The only other narrow velocity component clearly seen in both I1 and V3 is, in both cases, located close to line centre. In I1, such a feature is apparent in both doublet components of Si iv1398 at a blueshift of just 20 km s-1. Because this feature is rather too wide to be interstellar (with a FWHM of 60 km s-1) and because it shows some fading during the course of the observation, it must be identified as intrinsic to IX Vel. In V3 the affected transitions are the N v1240 and C iv1549 doublets, showing dips at an offset of about km s-1, again with a FWHM of 60 km s-1. By the same reasoning these are most likely intrinsic to V3885 Sgr.
V1, the first of the V3885 Sgr observations, also betrays traces of narrow absorption features at about km s-1. Specifically these are located in Ly at km s-1 and Si iv1398, at km s-1. C iv1549 has a trace of two narrow dips at km s-1, relative to each doublet component, and also a dip at km s-1, relative only to the bluer component. These features are only present for the first 600–700 sec of the observation.
4 Variability on timescales shorter than 2000 sec.
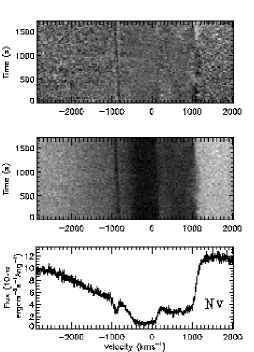
An analysis of time-variability of the resonance lines during each observation is presented in this section. The N v1240, Si iv1398 and C iv1549 resonance lines are displayed as trailed mean-subtracted spectra, and, where their inclusion clarifies the discussion, as trailed normalised spectra, as well.
To reduce the prominence of noise in the trailed spectra, the 1D spectra were smoothed by convolution with a gaussian function of either Å (4 pixels, I1 and V3) or Å (10 pixels, V1 and V2). The spectra were then normalized by fitting a 4th order chebyshev function to the time-averaged data; the fit was checked to assure that it did not produce strong curvature in the vicinity of the spectral lines. Examples of the local behaviour of these fits are shown in figures 3 and 6. All time-resolved spectra were divided by this continuum fit and then rescaled to ensure a continuum level of 1. The difference spectra were prepared for plotting by subtracting the normalized time-averaged spectrum from each time-bin’s normalized spectrum.
4.1 IX Vel
Only the I1 data, which display the strongest wind profiles and highest flux level, show any sign of time-variability in the trailed mean-subtracted spectrum and the normalised spectrum, so we present trailed spectra only for this HST visit. IX Vel’s UV brightness brings it close to the brightness limit of the detectors: this meant that at intervals during the observation the data buffer reached its limit and stopped recording data. This results in the loss of approximately 10 sec of data every 100 sec, after an initial 570 sec with no gaps. However, normalisation of the data ensures that there is no continuum variation resulting from this. We concern ourselves with time bins of 30 sec.
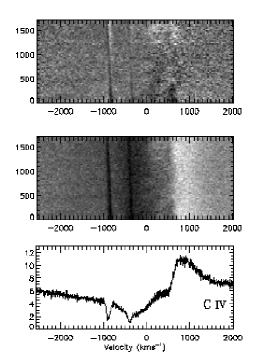
In figure 7 the narrow absorption features noted in section 3.1 are apparent in the difference spectrum as narrow dark features moving bluewards. In the N v1240 profile only the narrow feature that corresponds to the 1238.8-Å component of the doublet can be seen. Its position shifts from to km s-1. The redder component falls at approximately the rest wavelength of the bluer feature, so its presence is obscured by variability noted there (see below). Two narrow features at the doublet separation move along the C iv1549 profile from to km s-1 and from to km s-1, consistent with the change in the N v narrow feature. This is slightly more than the change in velocity expected from the drift with orbital phase (see table 2), which we have estimated at km s-1. In the case of the bluer C iv narrow feature, the absorption strength decreases by about 50 per cent from beginning to end. The other features are more obscured by noise, but they can also be seen to decrease in strength during the observation.
In both N v and C iv, variability is seen near line centre. In the normalised trailed spectra this is seen as blueshifting of the redmost point of absorption. This shift is measured, through inspection of the 1D spectrum from each 30-sec exposure, to be 90 km s-1. This is of the same magnitude as the movement of the narrow features. The correlation between the velocity shift of these two independent features (narrow absorption lines at and the redmost point of absorption) suggests that the predicted orbital phase is about right and that these two features are stationary in the WD rest frame. By contrast, in I2 and I3 there is no shift in the position of the redmost absorption point during the observation. From the predicted orbital phases (table 2) we would expect to see less of a velocity shift than in I1.
In approximately the first 250 s of I1, a narrow absorption feature is visible superimposed on the Si iv1398 doublet at km s-1. In figure 7 these features are just discernable as a narrow darker feature moving bluewards. There are other narrow absorption features near rest that are only clearly visible for the first 600 sec or so, after which, they appear intermittently. These serve to confuse the blueshifting redmost absorption limit that also seems to be present in Si iv.
No velocity shift has been detected in the disk-formed absorption lines from 1300 to 1400 Å (Si iii1300/O i1304, C ii and O v are the dominant species). However, these lines are broad and shallow with many components and so, unlike the wind-formed lines, tend to thwart efforts to identify shifts by means of cross-correlation – whether these lines shift with the WD radial velocity remains moot.
4.2 V3885 Sgr
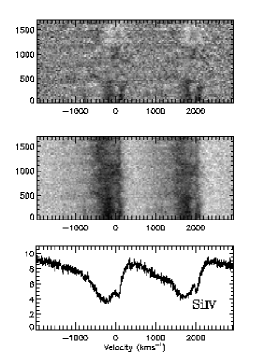
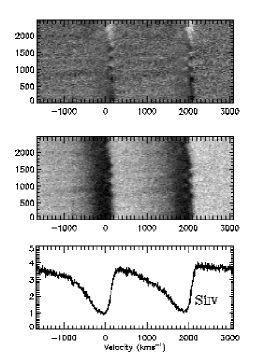
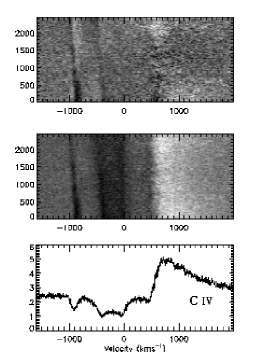
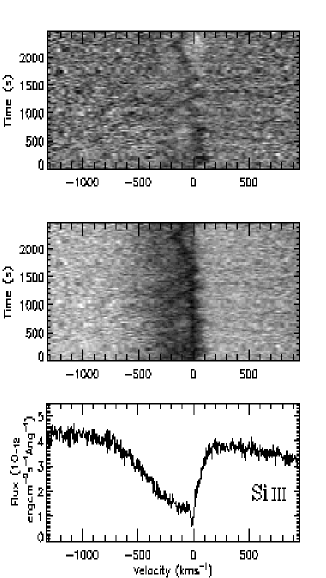
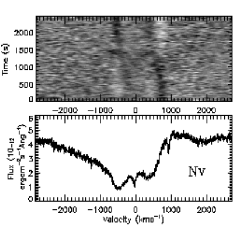
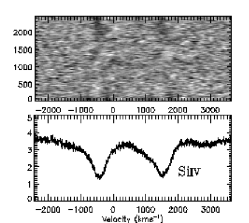
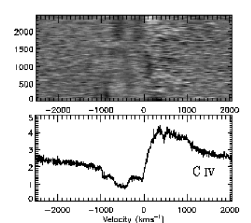
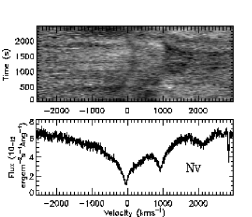
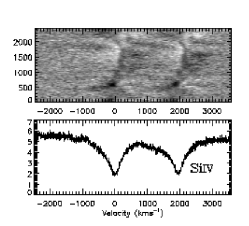
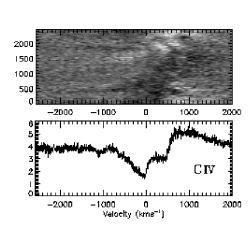
Presented in figures 8, and 9 are the V3 time series for the N v1240, Si iv1398, C iv1549 lines and Si iii1206 transitions. This was the epoch of greatest wind activity in which narrow blueshifted absorption features, like those in IX Vel’s I1 spectrum (figure 7), were seen superposed on the broad absoption profile. We begin here.
In figure 8 a narrow absorption feature corresponding to the 1238.8-Å component of the N v doublet moves bluewards from approximately km s-1 to approximately km s-1, becoming less prominent towards the end of the observation. This behaviour is repeated in the C iv line, which displays two blueshifting narrow absorption features, moving from to km s-1 and to km s-1. These narrow features become weaker during the course of the observation, decreasing in strength by approximately 40 per cent. The narrow line features noted just shortward of the N v and C iv doublet rest wavelengths in section 3.2 do not appear in the mean-subtracted spectra, indicating that they do not vary. Also in common with IX Vel, I1, the normalised greyscales of the V3 time series show blueshifting of the redward limit of the absorption. We measure this shift to be between 65 and 80 km s-1and note it is present in all lines shown. Its magnitude is rather less than the 140 km s-1 shift apparent from the superposed narrow absorption lines.
If we assume that the movement of the narrow absorption features is linked to binary orbital motion, as was suggested for IX Vel (see section 4.1), we can use the increasing blueshift observed to put V3885 Sgr in either the first or fourth quarter of its orbit. Haug & Drechsel (1985) derive a -velocity of 274 km s-1 from Balmer emission lines. This would give a minimum velocity shift during the period of the observation of between 90 km s-1 and 203 km s-1, a range that includes the velocity shift measured.
In the Si iv and C iv line profiles, we note a km s-1 fluctuation in the position of the red absorption edge: it wobbles, moving bluewards then redwards on a timescale of about 350 sec. The same fluctuation is even more clearly present in the Si iii1206 line, shown in figure 9. The fluctuation occurs in phase and with approximately the same velocity amplitude in all three transitions. It is strongest around the middle of the V3 observation and decays away noticeably towards the end. Time-varying structure, other than the line centre wobble, cannot be seen in the C iv profile. A related variation may be superposed on the blueshifted Si iv absorption, and there is a definite indication of some streaking in the weaker, less opaque Si iii line greyscales. Assuming that the line-centre wobble and the blueshifted streaking are aspects of the same phenomenon, we may deduce that there is some fine structure present in the outflow. The absence of any variability redward of line centre makes it unlikely that the rotating disk (or WD) photosphere is implicated. If 350 sec is comparable with the local dynamical time, this timescale of variation implies a characteristic disk radius of about 10 WD radii (for a 1 M⊙WD).
Figure 10 shows the greyscale line profiles for the first V3885 Sgr observation, V1. Two absorption features, approximately 200 km s-1 wide, move bluewards parallel to each other, shifting by approximately km s-1 during the observation. This is most evident in the N v1240 line profile. These changes are not linked to the narrow features at approximately the rest wavelengths of the doublet, as they are stationary throughout the observation. Instead, they are a sign of a shifting (but always blueshifted) absorption minimum against a background of an otherwise invariant broader profile. The net effect is that the line profiles show a slightly stronger blue skew towards the end of the observing window. This pattern of behaviour is distinct from the blueshifting of the redmost limit of absorption, as described for V3, wherein the line profile shape as a whole remains constant.
Towards the beginning of the observation the C iv line displays narrow absorption minima at km s-1 , which persists for about 200 sec, and at km s-1, which disappears after about 700 sec. The features are harder to discern than the narrow features seen in V3 as they are broader and shallower with respect to the overall line profile. Also present are two blueshifting broader features that resemble those seen in the N v line.
V2 displays the least distinct wind signatures of the three observations. Nevertheless C iv1549 retains a clear P-Cygni character in the mean spectrum that bears a family resemblance to those for V1 and V3 (e.g. figure 6). In this case, the trailed spectrum reveals a more complex story: in figure 11 we see parabolic curved absorption features that reach a maximum velocity at around half way through the observation. This behaviour is most evident in the N v and Si iv trailed spectra – probably because there is rather less masking broad blueshifted absorption. The movement of the absorption shows too much curvature to be explained by orbital motion. Instead, it can be viewed as a result of a change from a windy, asymmetric absorption profile to a more centred, symmetric profile and back again.
To give a clearer impression of this, we have broken the V2 observation down into 500 sec time slices and plotted selected line profiles from them as figure 12. These show that V2 begins with blue-skewed absorption profiles in the N v and He ii lines. There is certainly a wind blowing, but apparently it is not so well-developed as in V1 and V3. Both the NV and HeII lines then lose what little blueshifted absorption they had to start with, becoming even more symmetrical 1000 and 2000 seconds after the start of the observation. At the same time the C iv1549 profile shows some sharpening of the blueshifted absorption and some loss of redshifted emission. As these changes occurs, the multiplet components of the presumably disk-formed Si iii1300 line stand out sharply from the underlying absorption trough. A question to consider below is whether this variation during the V2 observation is evidence of a fading wind or of a change in the visibility of the inner disk from whence the wind flows.

5 Discussion
In this paper we have presented high-time and wavelength resolution UV observations of the nova-like variables IX Vel and V3885 Sgr. We begin the discussion of the outcome of these observations by reviewing some of the binary parameters and other specifics of the two target systems (section 5.1). Next, we evaluate what has been learned from the time-series observations and compare with the already published studies of BZ Cam and V603 Aql (section 5.2). We then reconsider the suitability of the line-driven disk wind model in the light of the new and, indeed, some older observations (section 5.3). Section 5.4 contains some comment on the way forward from here.
5.1 IX Vel and V3885 Sgr
First we compare and contrast IX Vel and V3885 Sgr, as known from the literature, and as we have found them here. Sufficiently precise parallaxes exist for both binaries that we can comment on their likely relative luminosities. IX Vel is listed in the HIPPARCOS catalogue as having a parallax of 10.38 0.98 mas, placing it at a distance of 96 pc. V3885 Sgr has a rather less certain parallax of 9.111.95 mas, suggesting a distance of 110 pc. Combining these data with the impression from photometry that V3885 Sgr is typically a magnitude (i.e. close to a factor of 2) fainter at optical wavelengths, one may deduce that V3885 Sgr is anywhere between about as optically luminous as IX Vel and half as luminous. The difference in apparent brightness is much the same at UV wavelengths, as measured in these data (cf. I1 and V3) and indeed in the older IUE and more recent FUSE data available from archive.
The orbital inclination of IX Vel would appear to be relatively settled at (Beuermann & Thomas 1990). The situation regarding V3885 Sgr is less clear: all that can be said is that the binary is not eclipsing and that there is a difference of opinion in the literature, with Cowley et al. (1977) favouring and Haug & Drechsel (1995) preferring either or . In the absence of better observational constraints, it would appear that to first order IX Vel and V3885 Sgr are at similar inclinations. A problem for the analysis of our V3885 Sgr observations has been the absence of a compelling measurement of the semi-amplitude of the white-dwarf -velocity, and great uncertainty in the orbital ephemeris. It is to be hoped that this can be corrected soon by means of ground-based optical spectroscopy.
Against this background, it is not too surprising that the HST/STIS UV spectral characteristics of the two systems are not very different. In the mean of the index, the slope of the UV continuum in the two objects is about the same, fitting the power law , but we do see more variation in continuum slope in IX Vel. Tentatively we find that a redder UV continuum in IX Vel (power law index ) is linked to more extreme spectral evidence of mass loss – when the wind is all but absent a bluer slope of index is observed. This leads us to surmise the presence of some diffuse Balmer continuum emission due to the wind that acts to redden the spectrum slightly when the wind blows. If the same is happening in V3885 Sgr, it may be less evident because the variation in wind activity is less marked and perhaps (more speculatively) because the binary’s orbit is less highly-inclined to the line of sight.
Both IX Vel and V3885 Sgr show evidence of mass loss in Ly as well as in the often-remarked C iv1549, Si iv1398 and N v1240 resonant transitions. V3885 Sgr distinguishes itself from IX Vel in also presenting with blueshifted absorption in Si iii1206 – this is particularly evident in V3, the third epoch data wherein the wind spectral signatures were most pronounced.
In general, IX Vel appears to possess the more opaque outflow. This can be seen by comparing the strength of absorption in the two datasets that display the most well-developed wind profiles: I1 and V3. In particular, the two most opaque transitions, N v1240 and C iv1549 have greater equivalent widths in I1 than in V3 (see tables 3 and 4). Despite this evidence of a difference in typical wind optical depths, it cannot yet be determined whether this is the effect of a greater global mass loss rate or simply an orbital inclination effect. However, what can be said is that the lower wind opacity in V3885 Sgr is likely to make it the better testbed for probing links between the wind and the physics of the disk it emerges from.
5.2 Time variability, and a comparison with the stronger UV spectroscopic variables BZ Cam and V603 Aql
In section 4 we have presented trailed mean-subtracted spectra of the N v1240, Si iv1398 and C iv1549 lines. The time resolution of these series is 30 sec. In one sense these time series are a disappointment because the broad blueshifted absorption is revealed as being relatively steady in both binaries. There is none of the more obvious short term variability described in the UV spectra of V603 Aql (Prinja et al. 2000a) and BZ Cam (Prinja et al. 2000b). A re-examination of IX Vel difference spectra at 10-sec time-resolution has revealed no variability unseen in the 30-sec time-binning. It would appear then, on the limited basis of a sample of 4 objects, that (i) systems selected for examination at higher time resolution, because they are already known to be significantly variable on the longer timescale of tens of minutes, continue to reward with variability on the tens of seconds timescale (BZ Cam, V603 Aql), (ii) systems not known to be markedly variable on the longer timescale remain as such on the shorter (IX Vel, V3885 Sgr). A possible point of distinction between these two pairs of objects is that the variable objects are also mooted as very low orbital inclination binaries (). This difference permits the hypothesis that the variability is due to the line-of-sight sampling some fluctuation in the angling of the innermost disk-wind streamlines. This assumes that there is something like a central conical cavity in the outflow as sketched by Shlosman & Vitello (1993) and by Knigge, Woods & Drew (1995) and substantiated by the numerical models published by e.g. PSD. By contrast, at higher inclination the line-of-sight will be well and truly embedded in the body of the approaching outflow at all times. Clearly it would be of benefit to be more sure of these binaries’ orbital inclinations.
There is another very striking point of contrast to note between these two pairs of objects. In the UV spectra of IX Vel and V3885 Sgr, there is very little redshifted line emission partnering the broad blueshifted absorption – only C iv1549 typically shows any at a significant level. This is quite common among high state non-magnetic CVs. Yet in BZ Cam and V603 Aql there is very strong redshifted line emission. This difference could be said to run right against expectation if BZ Cam and V603 Aql really are much more nearly face-on binaries, given that strong line emission is generally associated with eclipsing systems (). In this context it is helpful to remember that exercises in the simulation of wind-formed UV line profiles (e.g. Drew (1987), Shlosman & Vitello (1993), Knigge et al. (1995)) together with the discovery of orbital-phase linked line profile variations have led to the recognition that a component of the detected UV line emission need not have a wind origin (see discussion of this in Drew, 1997). Given this, the implication of the stronger redshifted line emission in BZ Cam and V603 Aql is either that these binaries are ‘the same’ as IX Vel and V3885 Sgr and somehow the line emission is occulted at higher orbital inclinations or there is an intrinsic physical difference between these two pairs of objects that expresses itself via the observed strength of the UV line emission.
In both IX Vel and V3885 Sgr there is evidence that narrow absorption features, sometimes seen superposed on broad blueshifted absorption, exhibit an organised motion that may prove to follow that of the accreting WD. At a mean blueshift of km s-1, these features are present only in the data showing the most pronounced P Cygni behaviour. In the I1 and V3 timeseries of the mean-subtracted line profiles, the red absorption edge close to line centre approximately follows the motion of the narrow features – as makes sense if both are due to the wind and hence follow the binary motion of the white dwarf. If this interpretation is correct, and there is no azimuthal dependence of the line-of-sight velocity of these features, the detected velocity changes provide a constraint on the orbital phase observed and the white-dwarf -velocity.
It is likely that the manner in which these narrow absorption features vary gives a clue as to their origin. On noticing them in IUE high-resolution data on IX Vel, Mauche (1991) reported three categories of explanation for similar features seen in O-star spectra as summarised by Henrichs (1988). The first concept is that an absorption dip may be caused by a plateau in the outflow velocity law which allows a larger absorbing column to build up over a small change in line-of-sight velocity. The second is that an absorber density enhancement due to e.g. an ionization effect may have the same consequence. Lastly, one may appeal to non-monotonicity due to e.g. shocks sweeping through the flow as the cause of narrow dips. Only the velocity law plateau concept warrants further examination in the context of these disk winds. This is because there are obvious problems with the other two. First, the density enhancement idea sits uneasily with the observed presence of these dips in transitions sampling a wide range of ionization states together with their absence from a subordinate line (C iii1175) that should be favoured at an enhanced density. Secondly, the difficulty with the shock-swept, or otherwise unstable, disk wind class of explanation is the persistence and near stationarity of the dips at a velocity well below the terminal value. Table 6 list those IUE datasets in which there are clearly narrow features superposed on the C iv1549 line, along with the locations of these narrow features (see also Mauche 1991, Prinja & Rosen 1995). The similarity between the dip blueshifts in IX Vel and V3885 Sgr, together with their earlier appearance in IUE observations, offers the prospect of an origin rooted in some basic property common to both binaries.
| IUE dataset | C iv1548.2 | C iv1550.7 |
|---|---|---|
| SWP22353 | , | |
| SWP25449 | ||
| SWP29618 |
It should be mentioned that similar narrow absorption dips are seen in association with O vi1035 blueshifted absorption in outburst spectra of U Gem [Froning et al. 2001]. These data are complementary to those presented here in that the orbital phase coverage is close to complete, while the spectral resolution and S/N ratio is reduced. The greater duration of the FUSE observations reveals that the O vi dips vary about their mean blueshift of km s-1 by no more than a few tens of kilometres per second. The more marked variation is in equivalent width – the dips are seen to fade and reappear in a somewhat erratic fashion.
In one epoch of observation of V3885 Sgr, V2, the mean-subtracted timeseries reveals a quite subtle and gradual change of a different character: the seeming weakening of the wind signature in e.g. the C iv line profile during the second 1000 sec of the observation. This might be interpreted as a temporary calming of the outflow. The change, at the same time, in the appearance of the 1300 Å absorption feature (figure 12) points to a different explanation. This typically broad shallow depression is thought of as originating in the disk atmosphere. The fact that it develops superposed narrow absorption dips at close to the rest wavelengths of the Si iii multiplet, the dominant contributor, strongly hints at a change in the visibility of the inner disk – and along with it, the disk wind. This is not exceptional behaviour, in that similarly-narrow unshifted absorption dips are the norm for U Gem in outburst [Froning et al. 2001], and have been observed at a range of orbital phases in the UV spectra of UX UMa and RW Tri (Mason, Drew & Knigge 1997). That the narrow absorption is fleeting in V3885 Sgr may be a hint of a somewhat lower, but not too low, orbital inclination.
Finally, we do not find frequent signatures of wind inhomogeneity on or near the dynamical timescale in our data for either IX Vel or V3885 Sgr - just one spell of variability, the sec ‘wobble’ seen in the V3 dataset is all there is to report. This indicates that structure extending over a significant fraction of the projected area of the UV continuum source is rare. If the inhomogeneity described by PSD exists, it must be finer in scale. One way of achieving this in a model may be to allow the flow to be fully 3-dimensional. Specifically, the derived geometry and dynamics of a 3-D wind is likely to differ from those of the axisymmetric 2-D wind modelled by PSD. For example, the knots discovered by PSD correspond to rings in 3-D with axisymmetry imposed, but in a full 3-D simulation they may be replaced by spirals or even a foam of very small blobs. If there really is no significant inhomogeneity, then the radiation-driven wind models of PSD would demand that around a half or more of the luminosity is radiated quasi-spherically, or that flow co-rotation is enforced by e.g. a strong, large-scale, ordered magnetic field threading the disk. However, before such adjustments are considered, there is a more basic aspect of the radiation-driven wind model to review.
5.3 Implications for the mass loss mechanism
If radiation pressure powers the mass loss from IX Vel and from V3885 Sgr, there are good reasons to expect a strong scaling of the rate of mass loss to bolometric luminosity. Indeed, using the plot of effective Eddington number (, the ratio of bolometric luminosity to the Eddington limit) against mass loss rate that was given in Drew & Proga (2000), it is possible to estimate how strong this dependence should be. On adopting the mass accretion rate and WD parameters derived for IX Vel by Beuermann & Thomas (1990), we would expect to be about . For V3885 Sgr, this quantity is unlikely to be greater and is probably smaller. This places both systems in the regime where an exponential dependence is expected. Even if it were the case that were high enough to yield a gentler dependence, this would still be at least as steep as . So, unless there is a significant countermanding effect due to shifts in wind ionization, we should expect to see a strong positive correlation between the strength of wind features in the ultraviolet and the ultraviolet continuum level – given that the latter is expected to scale very nearly linearly with mass accretion rate for fixed WD parameters.
The time-averaged spectra presented in section 3 do not sit well with this expectation. In V3885 Sgr the weakest wind signatures are seen when the ultraviolet continuum is brightest (V2), and strongest when the UV continuum is 20 to 30 per cent fainter (V3). In our IX Vel data (I3), the wind all but disappears when the UV continuum is at a level intermediate between the levels observed at the other two epochs. This absence of trend is seen in a setting where the evidence from the UV spectral lines is that ionization shifts are not significant and abundant ion stages are represented (see section 3.1). This gives us confidence that there is a direct (if uncalibrated) mapping from the mean strength of blueshifted absorption onto mass loss rate, from the lines that we observe with HST.
Caution must be exercised regarding the significance of IX Vel’s apparent UV flux changes because these data were obtained through an aperture small enough that the STIS flux throughput could have been different at each epoch. However, it is very unlikely that we are misled in the case of V3885 Sgr since the data were obtained through the larger 0.2 arcsec2 aperture that has been characterised as yielding UV fluxes to with 10 per cent of their photometric values.

Since the failure to find a correlation between wind features and continuum level is inconsistent with our expectation, it is important to see whether independent evidece of the effect can be found in the IUE database. We have done this for the case of IX Vel as there is a particularly extensive set of IUE spectra to draw upon (12 at high resolution and 28 at low resolution). First of all, we note that the IUE recorded flux level in the 1260–1270 Å range varies from to erg s-1 cm-2 Å-1. The HST data at epochs I1 and I3 (table 3) are consistent with this, while I2 was a time of seemingly unusually low continuum flux. Given that the band flux is known to vary secularly by up to 0.9 mags, the factor of 2 drop between I1 and I2 is not so large it must be instrumental in origin. Secondly, we have rebinned the weak-wind I3 spectrum to match the low resolution mode of IUE in order to determine if such a state was also recorded by IUE. We find that three of the 28 ‘LORES’ spectra (SWPs 19765, 19766 and 26081) resemble the rebinned I3 data: to illustrate this, in figure 13 an overplot of the rebinning on SWP 19765 is presented. If the I1 data are similarly degraded in spectral resolution, these too can be matched to examples of IUE spectra (see also figure 13). These simple comparisons allow the conclusion that the HST observations describe the same basic phenomenology as IUE (but more fully, of course).


One of the admirable features of the final archive of IUE data is its photometric consistency. This allows us to carry out the experiment on IX Vel archive data of evaluating the strength of correlation between wind activity, as signalled by the equivalent width of C iv1549 blueshifted absorption, with (i) UV flux level, again measured over the narrow band, 1260–1270 Å, (ii) UV continuum spectral index (fitting the continuum to a power law using much the same method as adopted for the HST summed spectra). These pairs of quantities as measured from IUE archive data are plotted in figure 14. In addition we have formally evaluated the Pearson correlation coefficients between these variable pairings, and also between the UV flux level and spectral index The results obtained are shown in table 7 . In support of what we have seen in the HST data, there seems to be at best scatter, or perhaps even a weak anti-correlation, between the Civ absorption equivalent width and UV brightness (figure 14a). By contrast, there does seem to be a correlation between the C iv line and UV spectral index in the same sense as picked out earlier – i.e. the slope of the spectrum reddens as the wind activity increases.
| Variables | ||
|---|---|---|
| Spectral Index vs. Flux | ||
| C iv EW vs. Flux | ||
| C iv EW vs. Spectral Index |
Circumstantially, if not absolutely conclusively, it would appear that there is not the expected strong positive correlation between apparent mass loss and luminosity. A key prediction of the radiatively-driven disk wind model is flouted. The flow timescale in cataclysmic binaries like IX Vel and V3885 Sgr is likely to be a few tens of seconds (assuming a Castor & Lamers type velocity law from 40 to 5000 km s-1integrated over a distance ). This is sufficiently short that the wind dynamical configuration is able to adjust continuously to the changing radiant flux as long as this does not vary markedly on an even shorter timescale. In neither object is there evidence of this either in our data or, historically, from observations of flickering (e.g. Williams & Hiltner 1984, Cowley et al 1977). Hence, it is not an option to invoke a concept of e.g. hysteresis to explain the absence of the expected steep relation between luminosity and mass loss rate. We conclude that neither IX Vel nor V3885 Sgr knows they have to obey such a relation!
5.4 Final Remarks
Now that quantitative models of radiation-driven disk winds have appeared, and there are high quality data to match them. it can be seen more clearly that a factor other than line-driving is much more likely to be decisive in powering these outflows. Our findings add to the doubts over the years that line-driving cannot sustain the mass loss rates observation seems to imply (see Mauche & Raymond 2000, Drew & Proga 2000). The de facto exclusion of a class of models is progress. It is now time to examine the alternatives with renewed intent.
MHD driving has long been viewed as a possible contributor or sole cause of mass loss (Cannizzo & Pudritz 1988, see also comments in Drew 1991). This option has become more attractive again in recent years as the magneto-rotational instability has emerged as a favoured angular momentum transport mechanism for CV disks (Balbus & Hawley 1998, Tout 2000). Perhaps the most promising alternative to a pure line-driven disk wind model is a hybrid model where a wind is driven from the disk by some combination of MHD and line forces.
Calculations combining the two driving mechanisms rigorously do not exist yet. However we can refer to some schematic predictions of radiation-driven disk wind models where the main role of an ordered magnetic field is to impose angular velocity, rather than angular momentum, conservation (Proga 2000). For , imposing corotation on a line-driven disk wind model increases the wind mass loss rate: the smaller the angle between the poloidal streamlines and the disk midplane the larger mass loss rate (cf. Blandford & Payne 1982). For a few times , is as in a pure line-driven disk wind model. In terms of the vs relationship, it means that for a relatively low disk luminosity (i.e. ), the mass loss rate can increase or decrease depending on the streamline geometry required by prevailing magnetic fields. This control of , independent of the radiant luminosity, can potentially explain our observations because these sample the luminosity range where this additional dependence is expected. As noted already, enforcement of flow streamlines by a large scale magnetic field would also be consistent with the near absence of detected wind inhomogeneity.
On the other hand, the fact that a radiation-driven wind can be produced only when , has a basic appeal in explaining the behaviour of other CVs such as dwarf novae (DN). The UV observations of DN through outburst obtained by IUE have provided evidence of mass loss signatures tracking luminosity. For example, it has been noted during declines of DN from maximum light that a decay of the UV continuum by a factor of can be accompanied by a near disappearance of the blueshifted absorption so prominent at maximum (Woods & Drew 1990; Woods et al. 1992). If this correlation proves to be indirect rather than causal, we have work to do to uncover the controlling physics behind it. The way forward is to identify for further development one of the many variants of MHD disk wind model already explored in the literature that can provide a convincing explanation, either with or without the assistance of line-driving, of the continuing puzzle of these disk winds. Once again the accretion disk winds in CVs have emerged as particularly open and rewarding laboratories for studying disk mass loss. An intriguing issue for the future is the existence or not of flow collimation of CV disk winds if even CV disk winds are MHD powered (see Knigge & Livio 1998). As these problems are tackled we can also hope to obtain greater insight into the nature of disk winds in other astrophysical settings.
Acknowledgements
This paper is based on observations made with the NASA/ESA Hubble Space Telescope, obtained at the Space Telescope Science Institute, which is operated by the Association of Universities for Research in Astronomy, Inc., under NASA contract NAS 5-26555. These observations are associated with proposal 8279. The work presented in this paper was performed while Daniel Proga held a National Research Council Research Associateship at NASA/GSFC.
References
- [Balbus & Hawley 1998] Balbus S. A., Hawley J. F., 1998, RvMP, 70, 1
- [Baptista et al. 1998] Baptista R., Horne K., Wade R. A., Hubeny I., Long K. S., Rutten R. G. M., 1998, MNRAS, 298, 1079
- [Beuermann & Thomas 1990] Beuermann K., Thomas H. C., 1990, A&A, 230, 326
- [Blandford & Payne 1982] Blandford R. D., Payne D. G., 1982, MNRAS, 199,883
- [Cannizzo & Pudritz 1988] Cannizzo J. K., Pudritz R. E., 1988, ApJ, 327, 840
- [Cowley et al. 1977] Cowley A. P., Crampton D., Hesser J. E., 1977, ApJ, 214, 471
- [Drew 1987] Drew J. E., 1987, MNRAS, 224,595
- [Drew 1997] Drew J. E., 1997, ASP Conf. Ser. 121, 465
- [Drew 1991] Drew J. E., 1991, in Structure and emission properties of accretion disks, Proc.IAU Coll.No.129, eds. Bertout C., Collin-Souffrin, C. Lasota J-P., J. Tranh Thanh Van, Editions Frontieres, Paris, 331
- [Drew & Proga 2000] Drew J. E., Proga D., New Astronomy Reviews, 44, 21
- [Frank et al. 1985] Frank J., King A. R., Raine D. J., 1985, Accretion power in astrophysics, Cambridge University Press
- [Froning et al. 2001] Froning C. S., Long K. S., Drew J. E., Knigge C., Proga D., 2001, ApJ, in press.
- [Garrison et al. 1984] Garrison R. F., Schild R. E., Hiltner W. A., Kreminski W., 1984, ApJ, 1984, 276, L13
- [Hartmann 1998] Hartmann L., 1998, Accretion processes in star formation, Cambridge University Press
- [Henrichs 1988] Henrichs H., 1988, in O Stars and Wolf-Rayet Stars, ed. P. S. Conti & A. B. Underhill (NASA SP-497),199
- [Haug & Drechsel 1985] Haug K., Drechsel H., 1985, A&A, 151, 157
- [Hirose et al. 1997] Hirose S., Uchida Y., Shibata K. Matsumoto R., 1997, PASJ, 49, 193
- [Hollander et al. 1993] Hollander A., Kraakman H., van Paradijs J., 1993, A&AS, 101, 87
- [Klare & Neckel 1977] Klare G., Neckel T., 1977, A&AS, 27, 215
- [Knigge & Livio1998] Knigge C., Livio M, 1998, MNRAS, 297, 1079
- [Knigge et al. 1995] Knigge C., Woods J. A., Drew J. E., 1995, MNRAS, 273, 225
- [Knigge et al. 1998] Knigge C., Long K. S., Wade R. A., Baptista R., Horne K., Hubeny I., Rutten R. G. M., 1998, ApJ, 499, 414
- [Konigl & Pudritz 2000] Konigl A., Pudritz R. E., 2000, in Protostars and Planets IV, eds Mannings V., Boss A.P., Russell S. S., Univ. Arizona Press, Tucson, 759
- [Long et al. 1994] Long K. S., Wade R. A., Blair W. P., Davidsen A. F., Hubeny I., 1994, ApJ, 473, 437
- [Mason et al. 1997] Mason K. O., Drew J. E., Knigge C., 1997, MNRAS, 290, 23
- [Mauche 1991] Mauche C. W., 1991, ApJ, 373, 624
- [Mauche & Raymond 2000] Mauche C.W., Raymond J.C., 2000, 541, 924
- [Metz 1989] Metz K., 1989, Inf. Bulletin Var Stars No. 3885
- [Nauenberg 1972] Nauenberg M., 1972, ApJ, 175, 417
- [Ouyed & Pudritz 1997] Ouyed R., Pudritz R. E., 1997, ApJ, 482, 712
- [Pereyra et al. 1997] Pereyra N. A., Kallman T. R., Blondin J. M., 1997, ApJ, 477, 368
- [Prinja & Rosen 1995] Prinja R. K., Rosen R.,1995, MNRAS, 273, 461
- [Prinja et al. 2000a] Prinja R. K., Knigge C., Ringwald F. A., Wade R. A., 2000, MNRAS, 318, 368
- [Prinja et al. 2000b] Prinja R. K., Ringwald F. A., Wade R. A., Knigge C., 2000, MNRAS, 312, 316
- [Proga 2000] Proga D., 2000, ApJ, 538, 684
- [Proga et al. 1998] Proga D., Stone J., Drew J. E., 1998, MNRAS, 295, 595
- [Proga et al. 1999] Proga D., Stone J., Drew J. E., 1999, MNRAS, 310, 476
- [Schild et al. 1983] Schild R. E., Garrison R. F., Hiltner W. A., 1983, ApJS, 51, 321
- [Shlosman & Vitello 1993] Shlosman I., Vitello P., 1993, ApJ, 409, 372
- [Tout 2000] Tout C. A., 2000, New Astronomy Reviews, 44, 37
- [Williams & Hiltner 1984] Williams G. A., Hiltner W. A., 1984, MNRAS, 211, 629
- [Woods et al. 1992] Woods J. A., Verbunt F., Collier Cameron A., Drew J. E., Piters A., 1992, MNRAS, 255, 237