Extended Red Emission in the “Evil Eye” Galaxy (NGC4826)
Abstract
NGC4826 (M64) is a nearby Sab galaxy with an outstanding, absorbing dust lane (called the “Evil Eye”) asymmetrically placed across its prominent bulge. In addition, its central region is associated with several regions of ongoing star formation activity. We obtained accurate low-resolution (/pixel) long-slit spectroscopy (KPNO 4-Meter) of NGC4826 in the 5300 – spectral range, with a slit of 4.4 arcmin length, encompassing the galaxy’s bulge size, positioned across its nucleus. The wavelength-dependent effects of absorption and scattering by the dust in the Evil Eye are evident when comparing the observed stellar spectral energy distributions (SEDs) of pairs of positions symmetrically located with respect to the nucleus, one on the dust lane side and one on the symmetrically opposite side of the bulge, under the assumption that the intrinsic (i.e. unobscured) radiation field is to first order axi-symmetric. We analyzed the SED ratios for a given number of pairs of positions through the multiple-scattering radiative transfer model of Witt & Gordon. As a main result, we discovered strong residual Extended Red Emission (ERE) from a region of the Evil Eye within a projected distance of about 13 arcsec from the nucleus, adjacent to a broad, bright HII region, intercepted by the spectrograph slit. ERE is an established phenomenon well-covered in the literature and interpreted as originating from photoluminescence by nanometer-sized clusters, illuminated by UV/optical photons of the local radiation field. In the innermost part of the Evil Eye, the ERE band extends from about 5700 to , with an estimated peak intensity of near and with an ERE-to-scattered light band-integrated intensity ratio, , of about 0.7. At farther distances, approaching the broad, bright HII region, the ERE band and peak intensity shift toward longer wavelengths, while the ERE band-integrated intensity, , diminishes and, eventually, vanishes at the inner edge of this HII region. The radial variation of and does not match that of the optical depth of the model derived for the dust lane. By contrast, the radial variation of , and of the ERE spectral domain seems to depend strongly on the strength and hardness of the illuminating radiation field. In fact, and diminish and the ERE band shifts toward longer wavelengths when both the total integrated Lyman continuum photon rate, , and the characteristic effective temperature, , of the illuminating OB-stars increase. and are estimated from the extinction-corrected line intensity and line intensity ratios and , respectively, and are consistent with model and observed values typical of OB-associations. Unfortunately, we do not have data shortward of , so that the census of the UV/optical flux is incomplete. The complex radial variation of the ERE peak intensity and peak wavelength, of and with optical depth and strength of the UV/optical radiation field is reproduced in a consistent way through the theoretical interpretation of the photophysics of the ERE carrier by Smith & Witt, which attributes a key-role to the experimentally established recognition that photoionization quenches the luminescence of nanoparticles. When examined within the context of ERE observations in the diffuse ISM of our Galaxy and in a variety of other dusty environments such as reflection nebulae, planetary nebulae and the Orion Nebula, we conclude that the ERE photon conversion efficiency in NGC4826 is as high as found elsewhere, but that the size of the actively luminescing nanoparticles in NGC4826 is about twice as large as those thought to exist in the diffuse ISM of our Galaxy.
1 Introduction
The “Evil Eye” Galaxy (NGC4826; M64) is a relatively isolated, nearby Sab galaxy, located at RA(B1950.0) and Dec(B1950.0) , according to de Vaucouleurs et al. (1991 - RC3). Its distance from us is uncertain by a factor of 2: e.g. Rubin (1994) uses a rounded 5 Mpc distance, as a compromise between the quoted low and high distances (Braun, Walterbos & Kennicutt 1992; Tully 1988; Kraan-Korteweg & Tammann 1980). Hereafter we adopt the distance quoted by Rubin. NGC4826 has an optical size of (RC3) and position angle of the line of nodes (PA for short) of , on the basis of the outer contours on the POSS (Nilson 1973; see also Rubin 1994). According to the latter author, the red isophotal diameters imply an inclination of . We refer the reader to Rubin (1994) for further details about morphology and geometry of the Evil Eye Galaxy.
NGC4826 owes its surname to the presence of an outstanding, absorbing dust lane (the Evil Eye), asymmetrically placed across its prominent bulge. The central region of NGC4826 shows a further peculiarity, since it is associated with several HII regions (J. Young 2000, private communication; see also Keel 1983a; Rubin 1994). At the Evil Eye, NICMOS imaging in the () line, obtained by Böker et al. (1999), reveals the presence of an inner arc-shaped region of ongoing star formation activity and of a broad lane of widely distributed, bright HII regions as well, in agreement with the morphology of the () line emission (J. Young 2000, private communication; see also Keel 1983a; Rubin 1994). Spectroscopic studies (e.g. Keel 1983b; Alonso-Herrero et al. 2000) classify this galaxy as a starburst-powered LINER.
Sakamoto et al. (1999) imaged the central region of NGC4826 in the line at the Nobeyama Millimeter Array, with a synthesized beam and an channel width. They find that the average hydrogen column density of the molecular clouds at the Evil Eye is about , 2 times larger than on the opposite side of the nucleus, by adopting the conventional CO-to- conversion factor , determined in the Galactic disk (Scoville et al. 1987; Solomon et al. 1987; Strong et al. 1988). This average hydrogen column density produces a V-band () extinction of – 21 mag, if the dust is uniformly distributed and a Galactic dust-to-gas ratio is assumed, but the net asymmetry in extinction, , due to the excess gas in the Evil Eye, is only of about 3 – 10 mag (Sakamoto et al. 1999). As noted by the latter authors, significant deviations of the CO-to- conversion factor from the standard value (e.g. Wilson & Scoville 1990) do exist within our Galaxy and in different starburst galaxies, nuclei of galaxies and low-metallicity galaxies (e.g. Maloney & Black 1988; Nakai & Kuno 1995; Israel 1997). A value of , derived by Digel, Hunter & Mukherjee (1995) in Orion, sounds more reasonable to us in the case of the dust lane of NGC4826, given the presence of several HII regions there. In this case, the CO measurement of Sakamoto et al. (1999) gives – 3.5 mag.
Sakamoto et al. also find that the velocity field is quite ordinary with a hint of noncircular motions at the radius of four CO clumps, three of the clumps being associated with the dust lane. By contrast, two nested counterrotating HI gas disks, at 1 kpc and in the outer region of the stellar disk, have been discovered in this galaxy (Braun, Walterbos & Kennicutt 1992; Rix et al. 1995). As quoted by Sakamoto et al., the quiescent velocity field suggests that the Evil Eye does not have much effect on the gas kinematics in the central kiloparsec (i.e. the central 50 arcsec, assuming the distance of 4.1 Mpc adopted by these authors). CO line profiles are single-peaked in the Evil Eye, suggesting to Sakamoto et al. that most of the molecular gas in the dark lane has already settled in the disk even if the gas accreted from outside. This conclusion is at variance with that of Block et al. (1994). The latter authors imaged NGC4826 in the V-band and -band (). The presence of the Evil Eye produces a striking asymmetry in the V-band surface brightness profile, the axial symmetry being restored at . From the analysis of these surface brightness profiles, oriented through the galaxy’s center but sequentially spaced 10 degrees each in position angle, Block et al. determined a least-squares fit value of for the Evil Eye, by assuming axial symmetry for both the unobscured V-band surface brightness profile and the unreddened color profile. The multiple-scattering radiative transfer models of Witt, Thronson & Capuano (1992) allowed Block et al. to identify this value with the geometry of a foreground dusty screen with an average V-band optical depth . The latter value is equivalent to mag, consistent with our previous estimate. Finally, in the analysis of Block et al., the screen model was also supported by the value of the far-IR-to-optical luminosity ratio of NGC4826 and by the agreement between computed and measured (molecularatomic) hydrogen column density.
On the basis of the previous arguments, it is reasonable to assume that a moderate amount of gas and dust distributed in a foreground screen is responsible both for the observed amount of attenuation and for the absence of a remarkable kinematic signature in the velocity field at the dust lane of NGC4826. In our opinion, this scenario is supported by the relative weakness of the average CO surface density in the Evil Eye (Sakamoto et al. 1999), compared to the high optical opacity there (Block et al. 1994). In fact, a screen geometry associated with a homogeneous dust distribution (like in models of Witt, Thronson & Capuano 1992) gives a lower limit to the computed mass of the dust responsible for a given (observed) reddening (e.g. Witt, Thronson & Capuano 1992). The clumpy structure of the dust is manifested by the presence of dark filaments in the NICMOS image of NGC4826 in the line (Böker et al. 1999). This confirms previous suggestions on the nature of the gaps present in the distribution of the emission from several HII regions at the dust lane (J. Young 2000, private communication; Keel 1983a; Rubin 1994). This wealth of information makes NGC4826 a suitable test for radiative transfer models.
The strong effect of a homogeneous vs. clumpy dust distribution in different star/dust geometries has been highlighted and carefully investigated recently by the new multiple-scattering radiative transfer models of Witt & Gordon (2000 – hereafter referred to as WG00). WG00 have computed the fractions of escaping/scattered radiation in the 1000 – 30000 spectral range from three representative types of galactic environments, filled with either homogeneous or two-phase clumpy dust distributions. Furthermore, they considered two types of interstellar dust, similar to those found in the average diffuse interstellar medium (ISM) of the Milky Way (MW) and in the Bar of the Small Magellanic Cloud (SMC). For a given optical depth of the model, absolute estimates of the escaping radiation require the knowledge of the spectral energy distribution (SED) of the intrinsic (i.e. non attenuated) interstellar radiation field (ISRF), e.g. through the comparison between data and calculations of stellar population synthesis models. In the case of NGC4826, low-resolution spectroscopy of the central region, with a slit encompassing equally extended regions on the obscured and unobscured side of the nucleus, provides to first order an observational determination of the intrinsic stellar SED in the dust lane, by assuming axial symmetry for the ISRF before dust absorption and scattering (cf. Block et al. 1994). As a consequence, it also provides a measurement of the attenuation of the intrinsic ISRF in the Evil Eye. A least-squares fit of the computed fractions of transmitted and scattered radiation at several different wavelengths to the ratio of the observed and intrinsic SEDs, for a given position across the dust lane, identifies the corresponding optical depth.
As a further goal, we want to search for a residual dust emission feature, which manifests itself in the familiar broad 0.7 band, known as Extended Red Emission (ERE). Broad-band () ERE, with a peak intensity wavelength between 0.65 and 0.88 , has been reported in many different dusty astrophysical environments of our Galaxy, e.g. the diffuse ISM (Gordon, Witt, & Friedmann 1998), cirrus clouds (Szomoru & Guhathakurta 1998), reflection nebulae (Witt & Boroson 1990), planetary nebulae (Furton & Witt 1990, 1992), the Orion Nebula (Perrin & Sivan 1992) and the high- dark nebula Lynds 1780 (Chlewicki & Laureijs 1987; Mattila 1979). We refer the reader to e.g. Witt, Gordon & Furton (1998) for a review of the observed properties of ERE. Here, it is sufficient to say that the ERE is commonly interpreted as a photoluminescence phenomenon originating in dusty environments illuminated by UV/optical photons. Identifying ERE in NGC4826 would extend our current knowledge of ERE to galaxies different from our own, so far limited to the halo of the starburst galaxy M82 (Perrin, Darbon, & Sivan 1995) and the 30-Doradus HII region in the Large Magellanic Cloud (LMC – Darbon, Perrin & Sivan 1998), but also provide the theory of the ERE carrier (Witt, Gordon & Furton 1998 and references therein) and photophysics (Smith & Witt 2001) with a further bench-mark.
We present new optical spectroscopy of NGC4826 in Sect. 2. Data reduction and analysis are discussed in Sect. 3. The results of our study are illustrated in Sect. 4. In Sect. 5 we discuss these results within the context of ERE observations in different dusty environments of our Galaxy, laboratory studies of photoluminescence properties of silicon nanocrystals and the models of Smith & Witt (2001). Conclusions are summarized in Sect. 6.
2 Observations
The observation of NGC4826 was performed with the Cryogenic Camera, the low-resolution () CCD spectrometer in use at the Mayall 4-Meter Telescope of the KPNO, on the photometric night of 1 February 1994. The camera system used a lens collimator, the 780-2 grism (300 g/mm; 1st order; 4900 – 9700 spectral range; /pixel) and an f/1 classical Schmidt camera with a Ford/Loral chip with pixels and a 0.84 arcsec/pixel scale. This chip is sensitive over the 4000 – 10000 spectral region, has a readout noise of 15 – 18 electrons rms, a full-well of 200000 electrons and a gain of 1.5 electrons per ADU. Its quantum efficiency peaks at % at . The overall system efficiency, including the atmosphere, telescope and instrument, peaks at about 20%.
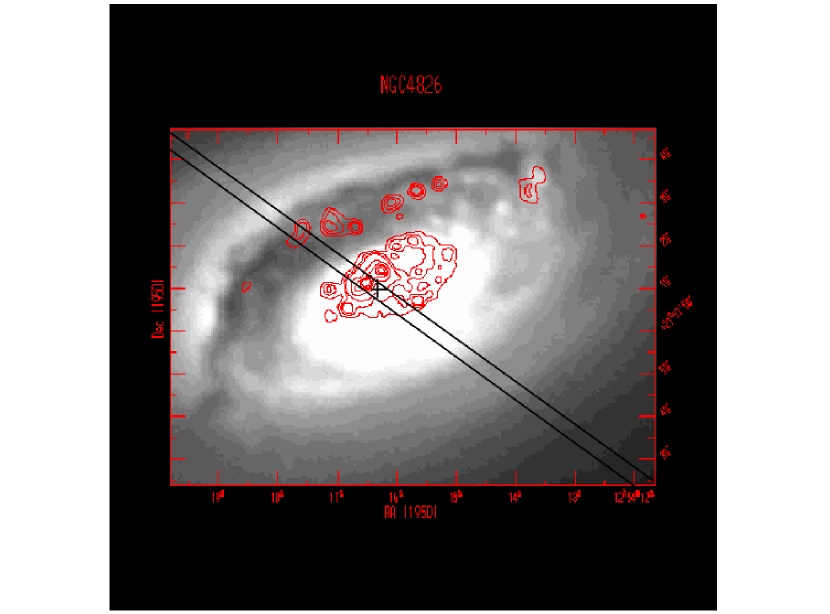
The camera system was operated in the long-slit mode, with a slit width of 2.5 arcsec, resulting in a 4650 – spectral range, with a resolution of (full-width at half-maximum – FWHM), as measured from sky lines. At the distance of 5 Mpc quoted by Rubin (1994) for NGC4826, the slit width comprises a metric distance equal to 60.6 pc. The slit was positioned across the galaxy’s nucleus, at a position angle of , Eastward from North with respect to the PA of the minor axis of NGC 4826 (cf. Sect. 1). With its 4.4 arcmin length, the slit encompassed the galaxy’s bulge size and equal galactocentric distances were covered on the obscured and unobscured side of the galaxy. A pictorial representation of the region of NGC4826 intercepted by the spectrograph slit under investigation is given in Fig. 1. Here, isophotal contours of the galaxy emission in the line (J. Young 2000, private communication) are superposed onto a grey-scale two-dimensional representation of the galaxy V-band surface brightness distribution (R. Evans 2000, private communication). A cross marks the position of the galaxy center adopted by us, i.e. RA(B1950.0) and Dec(B1950.0) .
Five 900 s exposures of NGC4826 were taken at an average air-mass of 1.07, for a total integration time of 4500 s. One 80 s exposure of the spectrophotometric standard star Feige 34 was obtained at an average air-mass of 1.02, with the same optical set-up used for the galaxy, to enable absolute flux calibration. Finally, one 10 s exposure and one 5 s exposure of a comparison HeNeAr arc were obtained, with the same optical set-up used for NGC4826, to enable absolute wavelength calibration of the galaxy and standard spectra, respectively.
3 Data reduction and analysis
3.1 Data reduction
Data reduction was performed in the IRAF environment and relied on the NOAO slit-spectroscopy packages.111IRAF is the Image Analysis and Reduction Facility made available to the astronomical community by the National Optical Astronomy Observatories, which are operated by AURA, Inc., under contract with the U.S. National Science Foundation. All the exposures were bias-subtracted, flat-fielded and flipped, in order to have wavelengths increasing from left to right along the CCD rows. The 5 single exposures of NGC4826 were combined successively with a median filter. Correction of the exposures of the target and of the standard for geometrical distortions in the spatial axis (along CCD columns) was performed through two-dimensional mapping of the wavelength in the raw spectrum of each associated comparison arc, assumed as the calibration image. This procedure enabled both the linearization of the raw spectra in the wavelength direction (i.e. along CCD rows) and their absolute calibration in wavelength, with an uncertainty of . The almost similarly wavelength-calibrated raw spectra of NGC4826 and of Feige 34 were furthermore transformed into the same absolute wavelength scale, covering the 4650 – 9710 spectral range. It was not possible to correct for the systematic increase of the skew of the line profiles in the lower half of the chip, which results from some misfunction in the optical set-up of the system.
Both the resultant raw spectra of NGC4826 and of Feige 34 were affected by non-linear tilts in the spatial direction. These tilts turned highly non-linear in two regions of the chip, defined approximately by the first and last 150 columns. Any spectrum requires a correction for its tilt in the spatial direction before extraction, of course. This procedure requires the mapping of the maximum intensity at any given wavelength along the spatial axis. The case of NGC4826 is particularly complex, since the inner region of this galaxy showed a strongly asymmetric radial intensity profile at any wavelength in the 4650 – 9710 spectral range, as a consequence of the presence of the dust lane (cf. Block et al. 1994; Witt et al. 1994). By contrast, the case of Feige 34 is simple, since its radial intensity profile is axially symmetric, by definition. The tilts of the two raw spectra were found to be identical, when allowing for a slight average displacement between the intensity peaks of each object at any given wavelength, along the spatial direction. A careful investigation of the variation of the displacement between the traces of the two raw spectra at individual wavelengths excluded the presence of any trend with wavelength. However, it also revealed a systematic increase (by a maximum factor of 2) of the FWHM of the spatial profiles of the target and of the standard toward the short- and long-wavelength ends of the chip. In addition to this increase, at random wavelengths within the short- and long-wavelength ends of the spectrum, the central portion of the intensity profile of each object shows an irregular shape, with peak-to-peak variations within of the rms readout noise. This irregular shape was already present in the raw spectra before their linearization in the wavelength direction. It was more pronounced in the spectral regions where the signal-to-noise ratio was lower than 10, associated with a particularly poor overall system efficiency. The broadening of the FWHM of the spatial profile in these two spectral regions reduced the maximum value of the observed intensity and the difference between the observed peak intensity and the intensities at neighboring positions. This effect, coupled to photon plus readout noise, produced the random disappearence of a single, well-defined peak of the observed intensity profiles of NGC4826 and Feige 34 at the short- and long-wavelength ends of their spectra. Reproducing the trace in these two bad regions of the chip required very high order Legendre polynomials, with the result that spurious features were introduced in the extracted spectrum of the star. This result led us to the decision of deleting the regions of baselines 1 – 150 and 1050 – 1200 pixels (equivalent to regions with and with , respectively) in the fitting of the trace of the Feige 34 spectrum. Consistently, the corresponding spectral regions of the NGC4826 spectrum will be deleted in the further data analysis as well.
The Feige 34 spectrum was extracted from a region of 35 arcsec width along the spatial axis. By contrast, the NGC4826 spectrum was extracted in a strip of 4.3 arcmin width across its nucleus, by adopting the trace fit of the raw Feige 34 spectrum, but allowing for a trace displacement of about 3 arcsec along the spatial axis. At each wavelength, the estimate of the trace displacement was derived from the fitted position of the true maximum intensity of NGC4826, under the assumption that the intensity distribution around the central position of the galaxy was represented by a Gaussian. A three-pixel spatial baseline, equivalent to 2.5 arcsec, was chosen for this fit. Larger spatial baselines were found to cause a shift of the new center toward the unobscured side of the galaxy and overall higher intensities and a bluer SED of the extracted NGC4826 spectrum at the dust lane side, with respect to symmetrically opposite positions at the unobscured side of the galaxy, in the inner parts of NGC4826. This behaviour was interpreted as due to the strong asymmetry of the observed intensity profile of NGC4826 at these scales (cf. Block et al. 1994; Witt et al. 1994) and motivated our choice of a three-pixel spatial baseline.
The program spectrum was extracted after background subtraction, the extraction window being limited by the presence of two regions of high instrumental noise at the lower and upper extremities of the chip. Median values of the background at each wavelength were estimated in two opposite equivalent regions of the raw spectrum, adjacent to the extraction window, at about 2.1 arcmin radial distance from the galaxy center, and fitted with a linear relation before subtraction. At the galaxy center, the background subtracted at e.g. (where no line emission is present) is equal to , with an rms uncertainty of . This value of the background is equal to the mean of the two median values of the background determined as described before, by construction. Within the extraction window, the largest variations of the background subtracted at are equal to 3% of the previous value. They are associated with the extrema on the unobscured and obscured side of the galaxy, respectively. The baseline subtracted as background is affected by emission from the peripheral regions of the galaxy disk, since the slit length is shorter than the projected angular size of NGC4826 (cf. Sect. 1 and 2). However, at galactocentric distances larger than 2.1 arcmin, the NGC4826 disk emission in the optical has a very shallow radial profile and a negligible intensity, when compared with the emission in its bulge region (Heraudeau & Simien 1996).
The intensity profile of NGC4826 at any given wavelength was centered and registered in the spectrum extraction procedure, so that the galaxy center is defined as a result. However, the true galaxy center may actually lie at a slightly different neighbouring position, as a consequence of the presence of the one-sided dust lane across the galaxy’s nucleus. Obviously, the centering precision plays a key-role on the robustness of the following results. In order to verify the correctness of the NGC4826 center position at any given wavelength, as given by the spectrum extraction procedure, we performed the following test. First, we assumed the center determined in the spectrum extraction procedure as a reference position and then folded each radial intensity profile around a fictious center, displaced from this reference position by 0, and pixel, i.e. 0, and arcsec, respectively. In each case, we extracted radial intensity profiles of NGC4826 at several different wavelengths, and computed the sum of the squares of the differences between the intensities of the two halves of each profile at galactocentric distances of 35 – 80 arcsec, corresponding to regions beyond the dust lane. Within this range of absolute radial distances, the galaxy profile obtained from V-band imaging (Block et al. 1994; Witt et al. 1994) seems to be to first order axi-symmetric. We found that the residuals did not depend on wavelength. Moreover, most of the minimum values of the sums of the squared residuals were obtained for a displacement of 0 pixel, but a non negligible fraction of the rest of the minima was associated with a displacement of 0.5 pixel. We further analyzed the ratios of the SEDs at symmetrically opposite positions relative to the NGC4826 center, on the obscured and unobscured sides of the galaxy, respectively. We found that, for the 0.5 pixel displacement, these SED ratios showed a U-downturn at the longest wavelengths, at least in the innermost region of the galaxy. This behaviour is at variance with the common understanding of the wavelength-dependent effects of absorption and scattering by the dust. Therefore, we concluded that the true galaxy center is possibly shifted, at maximum, about 0.25 pixels (i.e. 0.21 arcsec) toward the dust lane, with respect to the reference position. We discuss the effect of such an uncertainty on our results in Sect. 4.1.
After extraction, the NGC4826 spectrum was corrected for atmospheric extinction and calibrated in absolute flux by adopting the sensitivity function and flux conversion determined for Feige 34. The resultant absolute flux calibration rms error of Feige 34 spectrum was 1.1%. No wiggles in the flux calibration of Feige 34 spectrum were present within the spectral range of interest.
3.2 Data analysis
The NGC4826 spectrum was extracted in the “split” format, so that it was possible to extract further sub-spectra at individual positions, whose radial distances from the galaxy center were odd integer multiples of 0.5 pixel (i.e. 0.42 arcsec). Sub-spectra were extracted within a central region of 50.4 arcsec width, corresponding to twice the projected angular width of the dust lane at .
Under the assumption that the intrinsic radiation field of NGC4826 is to first order axially symmetric (Sect. 1), the SED at each position on the unobscured side of the galaxy, as seen by the observer, once corrected for Galactic extinction, represents the ISRF at the symmetrically opposite position on the obscured side, as seen by the dust lane. Hereafter we neglet the correction for Galactic extinction. Conversely, the partially obscured SED emerging through the dust lane consists of partially attenuated, directly transmitted radiation and radiation from the underlying ISRF scattered into the same beam. This assumption is equivalent to attributing the observed asymmetry of the radial intensity profiles of NGC4826 to the presence of the dust lane. This is supported by the consideration that a much higher degree of axial symmetry is shown by the -band surface brightness profile of NGC4826 with respect to the V-band one (Block et al. 1994; Witt et al. 1994). With this assumption, the ratios between the observed SEDs (in the 5300 – spectral region) at symmetrically opposite positions relative to the NGC4826 center, on the obscured and unobscured side, respectively, represent the fractions of radiation directly transmitted/scattered by the dust in the dark lane at different galactocentric distances. As a consequence of this division, the effects of the Milky Way interstellar extinction are filtered out.
Blue continuum emission, arising from HII regions in the central region of the galaxy, associated in particular with the Evil Eye (Fig. 1; see also Keel 1983a; Rubin 1994; Böker et al. 1999), introduces second order disturbances at the blue-end of the sub-spectra for the corresponding radial distances, as discussed in Sect. 4.1. With high confidence, the continuum emission arising from a region in size (cf. Sect. 2) associated with any of these HII regions is contributed by exciting stars and gas and reprocessed by local dust. The atomic continuum emission contributed by the gas is the sum of the two-photon decay emission and of the free-bound continuum radiation. It is almost constant with wavelength between and (the location of the Paschen break) and between and , the decrease at the Paschen break being of a factor of 3 (Perrin & Sivan 1992; Sivan & Perrin 1993; Darbon, Perrin & Sivan 1998; Darbon et al. 2000). Hence, the spectral distribution of the atomic continuum emission does not affect the profile of the observed SED except for the effect of the Paschen discontinuity, if significant. Shortward of the Paschen break the atomic continuum emission also does not exceed 40% of the optical continuum emission originated from scattering of starlight by dust grains in a dusty HII region like the Orion Nebula (Perrin & Sivan 1992). This fraction seems to be valid also between and . If this estimate applies to HII regions in NGC4826, the atomic continuum emission is expected not to exceed 17% of the total optical continuum emission there, under the assumption that the stellar contribution is at least equal to that of the scattered light. A reasonable representation of an HII region environment is the clumpy SHELL model of WG00, which predicts that, in the red, the scattered light ranges from 30 to 60% of the stellar light directly transmitted for reasonable values of the V-band optical depths, increasing from 1 to 10, without dependence on the intrinsic opacity function. As a consequence, in the observed HII region of NGC4826, we may expect that the atomic continuum emission does not exceed 8 – 13% of the total optical continuum emission. The non-detection of the Paschen break in the observed spectra supports the conclusion that the contribution of the atomic continuum emission to the total optical continuum emission collected by our slit width is negligible. Therefore, we do not correct these spectra for the fraction of the atomic continuum emission before the normalization by the corresponding unobscured spectra. In Sect. 4.5 we discuss further evidence for the conclusion that the origin of the blue continuum emission arising from these HII regions is mostly stellar.
Here we compare the SED ratios with the fractions of directly transmitted/scattered radiation predicted by the WG00 models for different astrophysical environments. For 25 wavelengths, ranging from 1000 to , WG00 computed the fraction of incoming radiation which is directly transmitted/scattered by and finally escapes from a galactic environment filled with either homogeneous or two-phase clumpy dust distributions. Each model is identified by its geometry, the intrinsic opacity function (MW- or SMC-like), the radial extinction optical depth from the center to the edge of the dust environment in the V-band (), assuming a constant density homogeneous distribution, and the type of structure (homogeneous/clumpy) in the dust region. Since the detailed analysis of the reddening in the Evil Eye (Block et al. 1994) and the comparison of the CO map (Sakamoto et al. 1999) with the image (Böker et al. 1999 ) of NGC4826 suggest that the global distribution of the dust with respect to the stars resembles a screen geometry while the local distribution of the dust is clumpy, we adopted the WG00 clumpy SHELL model. Both the MW- and SMC-types of interstellar dust were considered.
We determined a new grid of -dependent model fractions at each wavelength by fitting the predicted fractions of incoming radiation which is directly transmitted/scattered, quoted by WG00 at discrete values of , with a order polynomial in . After a visual comparison of the SED ratios previously obtained with the WG00 original fractions, we limited this fitting to the WG00 original fractions in the 0.25 – 5 range and computed new model fractions in the 0.01 – 5 range, with a step of 0.01 in . The fitting was limited to the WG00 original fractions at the four wavelengths 4754, 5985, 7535 and , encompassing the spectral range of the NGC4826 spectrum. The comparison between these new model ratios and the WG00 original ones, at the same values of , showed an agreement better than a few per cent, the largest disagreement being at for values of either or . For each value of , in the range 0.01 – 5, the new model fractions of incoming radiation, which is directly transmitted/scattered at the previous four wavelengths, were fitted with a order polynomial in , in order to obtain a continuous characterization of the wavelength-dependent effects of absorption and scattering within the whole 5300 – spectral range. A order polynomial was found to reliably fit the original WG00 model fractions at 4754, 5985, 7535 and .
4 Results
4.1 Extinction and scattering within the dark lane of NGC4826
Fig. 2a–n shows the SED ratios determined in Sect. 3.2 for absolute projected radial distances from the NGC4826 nucleus in the 2.1 – 23.9 arcsec range, with a step of 1.7 arcsec. We recall that the 0.84 arcsec/pixel angular scale of the CCD used for the present spectroscopy of NGC4826 corresponds to a 20.4 pc/pixel metric scale at the distance of this galaxy (cf. Sect. 1). The SED ratio for the innermost galactocentric distances of 0.4 and 1.3 arcsec have a strongly pronounced small-scale saw-tooth pattern, which is a high-spatial-frequency residual of the corrections discussed in Sect. 3.1. As a consequence, we did not fit the SED ratio for the galactocentric distance arcsec and this SED ratio is not reproduced in Fig. 2. A less pronounced small-scale saw-tooth pattern is still present in several of the ratios displayed in Fig. 2, especially in those associated with the shortest radial distances. This behaviour is persistent in the SED ratios determined in the test procedure described in Sect. 3.1 and, therefore, it is not due to the centering uncertainty. Furthermore, Fig. 2 shows evidence for bad sky-lines removal in well-confined spectral regions, such as those centered at about 6300, 7400 and .
Despite these “defects”, the SED ratios show a strong wavelength dependence, for any galactocentric distance. In fact, in each panel of Fig. 2, the SED ratio increases from the blue end to the red end of the spectral range. This general behaviour is expected on the basis of the wavelength-dependent effects of absorption and scattering by dust. The overall inspection of Fig. 2 shows further systematic changes of the SED ratio with , along the whole spectral range. An initial monotonic decrease of the SED ratio, at any given wavelength, with increasing from 2.1 (Fig. 2a) to 8.0 arcsec (cf. Fig. 2b–d), is followed by almost identical SED ratios, along the whole spectral range, within the 8.0 – 13.9 arcsec radial range (cf. Fig. 2e–h), while the SED ratios increase again, along the whole spectral range, at galactocentric distances greater than 13.9 arcsec (Fig. 2i–n). This distance-dependent behaviour is easily interpreted as due to radial changes of the optical depth across the dust lane, as confirmed by the values of associated with our best-fit WG00 model curves (cf. Sect. 3.2 and Sect. 4.2).
As a further result, we find that the SED ratios for 19.7 arcsec (cf. Fig. 2a–l) can not be fitted by any WG00 model curve along their whole spectral range. In particular, the observed SED ratios exceed the model predictions in the 5700 – spectral range for 1.3 arcsec, this spectral range moving toward longer wavelengths and the excess diminishing for 1.3 13.0 arcsec (cf. Fig. 2a–h). The discrepancy between model curves and data is even more dramatic if we use MW/SMC extinction curves. In fact, no SED ratio can be fitted by any of the latter curves. We show a representative case of this result in Fig. 3, where we reproduce and zoom the SED ratio for 22.3 arcsec together with its best-fit WG00 model curve with MW-type dust from Fig. 2m and the MW extinction curve for the same value of as the WG00 model, as tabulated in WG00. We choose this SED ratio as an example because at the distance of 22.3 arcsec no excess emission (either at the blue- or at the red-end of the spectral range) is present (cf. Fig. 2a–n). Fig. 3 shows that while both the WG00 model curve with MW-type dust and the MW extinction curve fit the data comparably well at , the MW extinction curve predicts particularly higher fractions of escaping radiation than those shown by the data at longer wavelengths. This is true in particular at , where, conversely, the WG00 model curve with MW-type dust fits the data as well as at the blue-end of the spectral region. Fitting the SED ratio at with a MW extinction curve would require a slightly higher optical depth but this new fit would systematically underestimate the SED ratio at . From this comparison, we conclude that the effect of scattering by dust on the spectral energy distribution of the radiation escaping through a dusty environment is not negligible and can be treated properly only via radiative transfer calculations. As a corollary result, we also conclude that the behaviour in Fig. 2a–h is not a spurious effect of the WG00 radiative transfer model. We need to examine whether this behaviour is due either to an uncertain centering of the NGC4826 spectrum or to the violation of our assumption of an axi-symmetric intrinsic ISRF.
In order to answer the first question, we determined a new set of SED ratios under the assumption that the true galaxy center is displaced by 0.5 pixel toward the dust lane, i.e. twice the estimated centering uncertainty (cf. Sect. 3.1). Accordingly, we derived a further set of SED ratios by considering pairs of symmetrically opposite positions, whose radial distances from the newly determined galaxy center are even integer multiples of 0.5 pixel (i.e. of 0.42 arcsec). We found that (1) at any given galactocentric distance, these SED ratios were lower than those in Fig. 2, along the whole spectral range, but that (2) the radial behaviour of these SED ratios was the same as that displayed in Fig. 2 and that (3) the shapes of these SED ratios for 19.7 arcsec, although slightly different from those displayed in Fig. 2, showed a similar excess which could not be fitted either by any of the WG00 model curves or by any of the MW/SMC extinction curves. Therefore, we conclude that the behaviour of the SED ratios shown in Fig. 2 for 19.7 arcsec is not due to the centering uncertainty.
The central region of NGC4826 hosts several regions of ongoing star formation activity, with different extensions and intensities (cf. Fig. 1). Fig. 2h–l shows that the SED ratios for 13.0 19.7 arcsec have an almost flat or slightly rising shape in the spectral region at . This behaviour is “anomalous”, since it is at variance with the well-known wavelength-dependent effects of dust absorption and scattering, under the assumption that the intrinsic ISRF of NGC4826 is axi-symmetric. We interpret this excess emission at for 13.0 19.7 arcsec as due mainly to stars in a broad, bright HII region, associated with the Evil Eye, intercepted by the spectrograph slit, as discussed in Sect. 4.5. This interpretation is supported by the strength of the residual line emission for 13.0 19.7 arcsec (Fig. 2h–l) and is in agreement with the phenomenology of the line emission of NGC4826 (Böker et al. 1999). It implies a violation of the axial symmetry assumption for the intrinsic ISRF of NGC4826 (Sect. 1) and explains the failure of our fitting procedure along the 5300 – spectral range, for galactocentric distances in the 13.0 – 19.7 arcsec range. Minor violations of our assumption are manifested by residuals in line subtraction and by excess emission at in the SED ratios for 12.2 arcsec (cf. Fig. 2a–g). The SED ratio for arcsec still shows relatively strong line emission features with respect to inner SED ratios, so that arcsec may be identified as the inner edge of the previous broad, bright HII region. Even deleting the spectral region defined by , the SED ratios for arcsec can still not be fitted either by any of the WG00 model curves or by any of the MW/SMC extinction curves. Therefore, we conclude that this impossibility is significant. The only physically reasonable interpretation of the behaviour of the SED ratios for arcsec is the presence of a broad featureless band emission arising from the dust lane, which causes the significantly higher values of these ratios, with respect to those predicted by the WG00 model curves and by the MW/SMC extinction curves, longward of . Given the existence of analogous examples in the literature (Sect. 1), we interpret this excess red emission, arising from the region of the dust lane of NGC4826 for arcsec, as due to ERE.
With this tentative interpretation, we fit our model curves to each SED ratio in the spectral region where neither ERE or excess blue emission is reasonably found to be significantly present. In Sect. 4.2, we will compare the properties of the hypothetical ERE from the dust lane of NGC4826 with the phenomenology of the ERE reported in the literature, in order to test our interpretation. As a consequence of the previous discussion, we fit our model curves to the SED ratios in the 5350 – spectral region, for arcsec, and in the 7800 – spectral region, for arcsec, while we adopt an average of the fits obtained in these two spectral regions for 22.3 25.6 arcsec. Slight changes of the limits of these spectral regions introduce variations of the order of a few per cent on the values of , , and , quoted in Sect. 4.2, due to different best-fit model curves, which are insignificant for the purposes of the present analysis.
Each least-squares best-fit WG00 model curve identifies a value of , where is the extinction optical depth of the dust lane along the sight line in the V-band, assuming a constant density homogeneous distribution of dust (cf. Sect. 3.2). From the analysis of the values of the least-squares fit model curves, obtained for each SED ratio, we attribute an uncertainty of a few per cent to the best-fit . Since determines the model fraction of light scattered/directly transmitted by dust at any given wavelength, it is straightforward to derive the SEDs of the scattered/directly transmitted light. ERE flux densities are derived by subtraction of these contributions from the flux densities actually observed in the dust lane. SMC-type dust models require values of up to 4% larger than the MW-type dust ones, as the HII region is approached, this discrepancy diminishing when the outer edge of the dust lane is reached. Given this systematic but slight discrepancy, we conclude that the ERE flux densities are not affected by which type of dust is adopted.
We note that, taking best-fit values at face-value, we find hints that SMC-type dust describes the attenuation in the core of the prominent HII region observed in the dust lane better than MW-type dust. Although this result is consistent with the finding that starburst galaxies have LMC-like extinction laws (Gordon, Calzetti & Witt 1997), we do not claim any statistically robust evidence of this effect. On the other hand, the Gordon et al.’s conclusion was based on an analysis in the UV spectral range, where the differences between the MW and the SMC dust become much more pronounced. Since there are no remarkable differences between the best fit values obtained either with SMC- or with MW-type dust everywhere else in the NGC4826 bulge region within our spectral range (cf. Fig. 2), hereafter we show and discuss results obtained under the neutral assumption that the dark lane of NGC4826 hosts dust of MW-type.
We plot the (assumed) intrinsic SED of the ISRF (as seen by the observer) and the (calculated) SED of the ISRF escaping through the dust lane, together with the observed flux density distribution, for different positions across the dark lane of NGC4826 in the upper portion of Fig. 4a–n. For the same vaues of , we plot the model spectrum of the light scattered by dust and the residual ERE intensity profile in the lower portion of Fig. 4a–n.
Where detected, the ERE intensity at ranges from about twice to 15% of the background subtracted at this wavelength in the data reduction (cf. Sect. 3.1). Intensities within this range are significant with respect to both the rms uncertainty of the background at and the maximum variation of this background within the extraction window. This result extends to the whole spectral range under study.
4.2 ERE properties in the Evil Eye
From the visual inspection of Fig. 4, it emerges that (1) the ERE band and peak intensity shift toward longer wavelengths with increasing projected galactocentric distance and that (2) the ERE peak intensity and the ERE band-integrated intensity decrease at the same time. Band-integrated means that the wavelength domain of integration corresponds to the wavelength range where ERE is detected (limited longward at ), for each value of . This behaviour is confirmed more quantitatively by fitting the smoothed ERE intensity profiles with Legendre functions and by numerical integration of the same profiles within the wavelength range of the ERE band (shorter than the 5300 – spectral range). Smoothing was obtained by averaging the ERE intensity in wavelength bins of width. This width is arbitrary; however, it is a fairly good compromise in order to reproduce the ERE intensity profile via a discrete but not coarse sampling, without being biased by residuals of an uncorrect line-subtraction. We used the lowest order Legendre function reproducing at best the ERE intensity profile within the wavelength range of ERE detection, for any given . This best-fit may not represent the unknown and unpredictable shape of the ERE intensity profile of the Evil Eye longward of . Therefore, it does not provide robust estimates of the total ERE band-integrated intensity and of the fraction of it represented by the measured ERE band-integrated intensity. In particular, for arcsec, ERE is detected at , with a peak intensity near . By contrast, for arcsec (Fig. 4c), ERE is detected at , with , and , while, for arcsec (Fig. 4e), ERE is detected at , with . Finally, for arcsec, ERE is not detected, at least within the 5300 – spectral range (cf. Fig. 4h–n). The same smoothing and band-integration procedure was applied to each model spectrum of the scattered light, so that we obtained the ERE-to-scattered light band-integrated intensity ratio.
We plot the radial behaviour of the ERE band-integrated (within the 5300 – spectral range) intensity, , and of the ERE-to-scattered light band-integrated ratio, , in Fig. 5a,b, respectively. Globally, we find that decreases from to 0, with increasing from 1.3 to 13.0 arcsec (Fig. 5a). Consistently, declines from 0.67 to 0 as well, though not in a monotonic way as for (Fig. 5b). In fact, while falls steeply for arcsec, its decrease becomes more gradual at greater galactocentric distances. By contrast, after an initial fall from 0.67 to 0.25 for arcsec, rises again to at arcsec and then falls toward 0 for radial distances greater than 11.3 arcsec. We estimate statistical uncertainties of the order of 7% for , of 9% for and of 11% for . Therefore, the radial variation of and is significant.
The shift of the ERE band and peak wavelength toward longer wavelengths (Fig. 4a–g), as the broad HII region of NGC4826 is approached, is analogous to those manifested in the transition from low-UV photon density environments (e.g. Galactic diffuse ISM) to high-UV photon density environments (e.g. Orion Nebula) (cf. Gordon, Witt & Friedmann 1998; Smith & Witt 2001). In fact, in the ISM, while in the Orion Nebula bar adjacent to the Trapezium stars, where the radiation density is several orders of magnitude higher. For the latter object, ranges between and , and ranges from 0.2 to 0.6 (Gordon, Witt & Friedmann 1998). These ranges are in agreement with those spanned by and across the Evil Eye (Fig. 5a,b). This comparison supports our hypothesis about the nature of the excess red emission discovered in the comparison of the SED for pairs of symmetrically opposite positions, across the NGC4826 nucleus, on the obscured and unobscured side of the galaxy (Sect. 4.1).
This conclusion is not biased by systematic errors. We estimate that the presence of extra blue emission for arcsec (Sect. 4.1) may cause a systematic overestimate of the corresponding best-fit model values of of the order of a few per cent. As a consequence, the ensuing underestimate of , and is negligible. Potentially more severe is the effect of the uncertainty in centering. In the extreme and unrealistic case that the true galaxy center is shifted by 0.42 arcsec (cf. Sect. 3.1), we find an average increase of up to 0.4, so that is reduced to one third of its previous value, while is less affected. This value corresponds to an extremely conservative upper limit to the systematic error of .
4.3 ERE and dust column density in the Evil Eye
As mentioned in Sect. 1, the ERE phenomenon requires the presence of both dust and UV/optical photons. Here, we inspect the radial variation of the ERE integrated properties and of the dust column density, as measured by the optical depth, in the Evil Eye.
We plot the radial dependence of the attenuation optical depth in the V-band, , in Fig. 5c, together with that of and . The attenuation optical depth is defined by WG00 as:
where is the fraction of the radiation flux density at wavelength (in our case at the V-band effective wavelength) escaping through the dust lane. On average, is about 30 – 50% of , the extinction optical depth of the dust lane along the sight line in the V-band, determined by assuming a constant density homogeneous distribution of dust. The lower value of compared to that of is due, in part, to the reduced opacity of a clumpy medium, and, in part, to the partial return of radiation scattered into the beam by dust. However, remains a useful parameter in that it measures the actual average dust column density. Fig. 5c shows that the maximum is about 1.6, equivalent to a maximum . The mean is , equivalent to a mean . If the latter value is held as representative of the whole dust lane of NGC4826, then it is consistent with the average V-band optical depth of determined by Block et al. (1994). It also favours a low value of the hydrogen column density at the Evil Eye (cf. Sect. 1).
A range of values of are found to exist across the dust lane. For arcsec, rises steeply from 0.16 to 1.06 with increasing . For arcsec, increases up to and holds this maximum value for arcsec, while, for arcsec, drops to . For greater distances, approaching the exit from the dark lane, decreases smoothly toward 0. We note that the less certain interpolation/extrapolation of the WG00 calculations at/to values of (cf. Sect. 3.2) does not affect this behaviour.
By contrast, and decrease toward 0, for increasing from 1.3 to 13.0 arcsec, and, in particular, their radial variation is at variance with that of for arcsec (Fig. 5a,b). Therefore, we conclude that the radial dependence of and manifested across the Evil Eye can not be simply attributed to a radial change of the dust column density. Instead, we infer that the ERE mechanism is increasingly quenched when the UV-rich radiation environment of the HII region is approached.
4.4 The integrated Lyman continuum photon flux across the Evil Eye
The conclusions reached in Sect. 4.2 and 4.3 and the observation that both and diminish in direction of a broad, bright HII region associated with the dark lane, intercepted by the spectrograph slit, suggest that the UV/optical component of the local ISRF not only powers the ERE but also regulates the photophysics of its carrier (Smith & Witt 2001).
Unfortunately, our data do not characterize the stellar optical flux at . However, we can estimate the strength and the hardness of the UV emission as follows. Fig. 6 reproduces the radial intensity profile of NGC4826 at the rest-frame effective wavelength of the R-band ( – short-dashed line) and at the rest-frame line central wavelength ( – solid line), as measured from our long-slit spectrum. The latter intensity is not corrected for the contribution of the neighbouring [NII] ( 6548, ) lines. First, we note that Fig. 6 confirms the global axial symmetry of these two profiles at radial distances greater than 35 arcsec, beyond the dust lane (cf. Sect. 3.1). Furthermore, and more interestingly, these two radial intensity profiles are significantly different in three well-defined regions of the galaxy, identified as regions of massive star formation activity by the relatively large -to- intensity ratio, this ratio being equivalent to first order to the line equivalent width (e.g. Rubin 1994). These three regions of ongoing star formation correspond (1) to the galaxy nucleus, (2) to a relatively extended region within the 8 – 13.9 arcsec galactocentric distance range (visible in the unobscured region, on the left side of each profile in Fig. 6), and (3) to a broad, bright HII region associated with the dust lane, with peak emission at 13.9 arcsec.
A better description of the strength of the ionizing UV photon field across the dust lane is given by the integrated line intensity, as derived through fitting via Voigt profiles and deblending the line and the adjacent [NII] doublet. In Fig. 7, we plot the radial variation of the integrated line intensity, , across the dust lane of NGC4826, folded around its nucleus. Here, the solid and long-dashed lines refer to the unobscured and obscured regions of the galaxy, respectively. The typical uncertainty of the integrated line intensity is about 10% or lower. This figure increases up to about 50% for the sub-spectra relative to radial distances of arcsec, where the intensities of the two adjacent [NII] lines are at least comparable with , and where the underlying continuum is badly estimated. Despite this large error, our mean central (within a strip of ) value of is about half of that quoted by Keel (1983b) (), obtained within a larger area, equivalent to a circular aperture of 4.7 arcsec in diameter. Given the aspect of the nuclear region of NGC4826 in the line emission (Fig. 1), these two measurements are consistent. Our higher spatial resolution suggests the existence of a minimum line intensity at the actual center of the galaxy (Fig. 7). If this is real, the inconsistency with the presence of a maximum rest-frame intensity in Fig. 6 is due to contamination of the latter intensity by strong [NII] line emission. This explanation is supported by the recognition that NGC4826 is probably a starburst-powered LINER (cf. Sect. 1), so that its nucleus is characterized by a high [NII]-to- line intensity ratio (as also found by us – cf. Fig. 9b). An uncertainty by a factor of 2 affects values of lower than , corresponding to very small line equivalent widths. Such low values of are found at galactocentric distances larger than 15 about arcsec and 22 arcsec on the unobscured and obscured side of the galaxy, respectively.
Globally, the phenomenology of the line emission delineated in Fig. 6 and in Fig. 7, are consistent. The latter figure, however, reveals the existence of two equally displaced but un-even line intensity peaks, near the galaxy nucleus (at arcsec), which might be interpreted as features of a ring-shaped region of massive star formation activity. The almost 50% lower line intensity peak occurs on the unobscured side of the galaxy. The suggested ring-shaped region of line emission seems to be consistent with the arc-shaped morphology of the emission revealed by NICMOS imaging (Böker et al. 1999), when taking into account the higher spatial resolution (0.2 arcsec/pixel) of NICMOS. By contrast, this structure is unresolved in the image of Young (2000, private communication) displayed in Fig. 1, where the peak emission is saturated, and in the image (0.86 arcsec/pixel resolution) of Rubin (1994). The line emission from the hypothetical inner ring, might be partly associated with the presence either of an AGN (Ho, Filippenko, & Sargent 1997) or, more favourably, of a starburst-powered LINER (Keel 1983b; Alonso-Herrero et al. 2000). At larger galactocentric distances ( arcsec), on the unobscured side, an extended region of multiple line intensity peaks, comparable in strength with the previous one, is found. Here, is on average about 2.5 times higher than at the symmetrically opposite side of the galaxy. At these galactocentric distances, on the obscured side, increases from 1.3 to 1.6 (cf. Fig. 5b), so that at least about 20% of the emerging radiation escapes. In this region of the Evil Eye, we assume that dust almost completely obscures line emission as intense as that observed on the opposite side of the galaxy, but we also allow for an excess photon flux, as can be inferred from ground-based and HST-NICMOS imaging. Farthermore, across the region of the Evil Eye probed by our spectroscopy, a very bright and relatively extended HII region is encountered, which has no counterpart at the symmetrically opposite position, on the unobscured side of the NGC4826 bulge region. The presence of this broad, bright HII region, associated with the dust lane, violates the assumed axial symmetry of the intrinsic ISRF of NGC4816, but does not bias our conclusions (cf. Sect. 4.1). Finally, a region of extremely low line emission is present at a radial distance of about 20.6 arcsec, on both sides of the galaxy. We tentatively interpret the latter region of mild star formation activity as the signature of two symmetric spiral arms.
Fig. 7 details the morphology of the line emission across a strip of about centered on the galaxy nucleus, but does not solve the question about the topology of the sources of the line emission associated with the dust lane of NGC4826. The interpretation of the CO map of this galaxy by Sakamoto et al. (1999 - cf. Sect. 1) may give a hint that the ongoing star formation activity across the Evil Eye is associated with the disk and obscured by the molecular gas in the dark lane which has not yet settled in the disk. Since this interpretation is questionable (cf. Sect. 1), we assume two limiting cases for the topology of the sources of the asymmetric line emission. In the first case (case “a”), the latter sources are assumed to be located below the dust lane, so that the excess (asymmetric) line intensity, as seen by the observer, must be corrected for absorption and scattering by the dust in the Evil Eye, as well as the axi-symmetric component of the line emission, associated with the disk. Therefore, the total (axi-symmetricasymmetric) line flux, , corrected for absorption and scattering by dust, as seen by the observer is given by:
where is the observed total line flux across the dust lane. In the second case (case “b”), we assume that the sources of the asymmetric line emission are on top of the dust lane, so that their contribution to is not corrected for absorption and scattering by dust. This time is given by:
where is the axi-symmetric component of the line emission. The line flux seen by the dust lane is intermediate with respect to these two estimates.
The integrated (shortward of ) Lyman continuum (Lyc) photon flux of a given OB-association is estimated from the line flux, by adopting a Lyc/ photon conversion factor of 2.2 for case-B recombination (Osterbrock 1989) with an assumed electron temperature (Hummer & Storey 1987; Oey & Kennicutt 1997).
We plot the radial variation of the total integrated Lyc photon flux in Fig. 8. Here the long- and short-dashed lines represent cases “a” and “b”, respectively, while the solid lines correspond to reference values of the integrated Lyc photon flux (at the stellar surface) for representative individual stars of spectral type O3 and O9.5 and of luminosity class I, III and V. These reference stellar values are derived by Schaerer & de Koter (1997) from their solar metallicity CoStar models, using the -log calibration of Vacca et al. (1996) and adopting the stellar radii from Vacca et al.. The values of estimated for the Evil Eye fall nicely between those of individual O3 – B0 stars (cf. Schaerer & de Koter), and suggest that the Evil Eye probably does not host O-stars as UV-bright as type O5I or brighter (i.e. with ), though luminosities are uncertain by a factor of 4 (cf. Sect. 1). Of course, the number of OB-stars of given spectral type (and with given metallicity, effective temperature and surface gravity ) actually present in the different regions of the galaxy under study is not constrained. The radial variation of implies that the total number of stars in the various OB-associations across the dark lane changes, this change being significantly different between cases “a” and “b”.
A better characterization of the hardness of the local radiation field across the dust lane is given by the ratio of the [NII] () and the line intensities, , and of the intensity ratio between the [SII] (, ) doublet and the line, . In fact, these ratios depend also on the characteristic of the OB-stars (e.g. Kennicutt et al. 2000). We plot the radial behaviour of and of , for cases “a” and “b”, in Fig. 9. Larger uncertainties affect the two ratios for 1.3 arcsec, due to the uncertain continuum baselines and deblending there, and for radial distances larger than about 20.6 arcsec, where the differences between the [NII](), [SII]() and line intensities of the obscured and unobscured regions across the galaxy nucleus are very small and of the same order of magnitude of the observational errors. This explains the sudden fall of for arcsec in Fig. 9c. Reassuringly, both these spectroscopic indices show the same overall radial dependence, irrespective of the assumed location of the sources of the extra line emission with respect to the dust lane. Changes of happen in a smoother way, probably because of the complementarity of the [NII]() and line fluxes, due to the partial blending of these two lines at our spectral resolution.
Fig. 9b shows that drops from 0.2 dex to dex, moving from the nucleus to the neighborhood of the broad, bright HII region, while it increases again for galactocentric distances larger than about 18.1 arcsec, external to this HII region. For the HII regions in our Galaxy and in the Magellanic Clouds, values of of about dex are characteristic of stellar effective temperatures between 35 and 45, while typically corresponds to (Kennicutt et al. 2000). Therefore the presence of solar metallicity stars of type O5 – O8 seems to be allowed in the broad, luminous HII region associated with the Evil Eye, while only stars later than O9 are probably present at other locations across the dust lane (cf. Schaerer & de Koter 1997, their Tab. 3) and, therefore, are the sources of the H-ionization there. Whatever the exact stellar classification of the OB-associations in the obscured region of NGC4826 is, Fig. 9 confirms that the radial increase of toward the broad, bright HII region in the Evil Eye is associated with the hardening of the stellar UV spectrum.
The large values of for arcsec are in excellent agreement with the range quoted by Keel (1983b) () for the nuclear region of NGC4826. They exceed the upper values of found in HII regions of our Galaxy and of the Magellanic Clouds (Kennicutt et al. 2000) and, as concluded by Keel, they may point to different sources of ionization and/or of the ionizing spectrum in the NGC4826 nucleus, as provided by either an AGN or by a starburst-powered LINER (cf. Ho et al. 1997; Alonso-Herrero et al. 2000). By contrast, Keel quotes values of in the – dex range, against our mean value of dex within a distance of 2.35 arcsec from the NGC4826 nucleus. This discrepancy may point to inaccurate line modeling and/or subtraction of the continuum for the [SII] () lines of our sub-spectra for arcsec. The large values of and for arcsec do not find any counterparts in those reproduced in Kennicutt et al. (2000). We suspect that these values of ours are biased by errors in deblending and continuum subtraction, these lines having a low signal-to-noise ratio, in addition.
Finally, in Fig. 10, we plot the radial distribution (across the dust lane) of (panel a) and of (panel b), as derived in Sect. 4.2, together with that of (panel c), for the two limiting cases considered here. The comparison of this plot with that in Fig. 5 is subject of interpretation in Sect. 5.
4.5 The continuum emission from the broad HII region in the Evil Eye
The detailed study of the observed stellar SED of NGC4826 involves the comparison with model stellar SEDs and is beyond the goal of the present investigation. Nonetheless, the (admittedly rough) information about the spectral types of the stars responsible of the H-ionization (cf. Sect. 4.4) provides an order-of-magnitude estimate of the contribution of these stars to the residual blue emission found in the sub-spectra of the broad HII region of the Evil Eye intercepted by the spectrograph slit (cf. Sect. 4.1). For simplicity, here we assume that the H-ionizing stars present there form a simple stellar population with solar metallicity.
As an initial working hypothesis, we assume that all these stars may be represented by only one spectral type, identified by the average of 40000 K (cf. Sect. 4.4). Such a star corresponds to a 2.23 Myrs old star with initial mass of 60 , classified as spectral type O5.5IV (on the basis of its location in the HR-diagram), according to the CoStar model D3 (Schaerer & de Koter 1997). The Lyc photon flux of this model star may be easily derived from the data listed by Schaerer & de Koter. As a result, we find that one model D3 star may provide 60% of the total Lyc photon flux produced within the HII region at e.g. arcsec in case “a” (cf. Sect. 4.4), equal to . By contrast, only O-stars less UV-bright than one model D3 star may provide the total Lyc photon flux produced there in case “b” (cf. Sect. 4.4), equal to . A more complex representation of the OB-associations across the Evil Eye is needed. Therefore, now we assume that these OB-associations are represented by two ensembles, one associated with within 35 and 45 and the other with , consistent with our data (cf. Sect. 4.4). Schaerer & de Koter provide only two models which satisfy all our requirements: one (model B2) corresponds to a 2.60 Myrs old star with initial mass of 25 and , classified as spectral type O9V; the other (model D4) corresponds to a 2.76 Myrs old star with initial mass of 60 and , classified as spectral type O7I. For our illustrative purposes this is enough. We note that the number of model B2 objects should be at least 3 times larger than that of model D4 objects in order to satisfy our observational constraint on the effective temperatures of the H-ionizing stars within the broad HII region of NGC4826 (Fig. 9b). On the other hand, the number of 25 (model B2) stars should be about 8 times larger than that of 60 (model D4) stars in case of e.g. a Salpeter (1955) initial mass function (IMF). Model D4 has a Lyc photon flux about 7 times larger than model B2 (Schaerer & de Koter), so that, for a Salpeter IMF, we may expect that equipartition of the total Lyc photon flux between these two ensembles applies, to zeroth order. Due to the discrete nature of stars, we find that either a mix of 24 model B2 stars and 2 model D4 stars or a mix of 17 model B2 stars and 3 model D4 stars are reasonable solutions for case “a”. By contrast, either 2 model B2 stars plus one model D4 star or 10 model B2 stars alone may provide the needed total Lyc photon flux for case “b”. In both cases, we can predict the observed SEDs of the OB-association within the broad HII region of NGC4826 at arcsec from the knowledge of the optical depth at different wavelengths there (cf. Sect. 3.2), given the intrinsic SEDs of the model stars (D. Schaerer 2001, private communication). In Fig. 11, we show the predicted profile of the total continuum emission for case “a” (with extinction applied) and that for case “b”, together with the spectrum of the residuals already displayed in Fig. 4h, here reproduced by using a magnified intensity scale. The predicted total continuum emission is the sum of the atomic continuum emission from the gas (derived hereafter) and the continuum emission arising either from the mix of 17 model B2 stars and 3 model D4 stars, for case “a”, or from the mix of 2 model B2 stars and 1 model D4 star, for case “b”. For case “a” the predicted total continuum emission is an upper limit, as we will explain.
The comparison between model predictions and data shows that, in either case, up to about 50% of the residual blue emission can be accounted for by the emission of the two ensembles of H-ionizing stars alone. At , the predicted stellar emission is of the same order of magnitude of the rms uncertainty of the background subtracted in the spectrum extraction procedure (Sect. 3.1). It is also at least of the same order of magnitude of the estimated observed atomic continuum emission, as we demonstrate hereafter.
The nebular continuum intensity relative to the () line intensity corrected for interstellar extinction, may be espressed as a function of the observed nebular continuum intensity and observed line intensity according to the classical formula:
where and are the extinction correction at and the extinction correction function, respectively. In the 5300 – spectral range, the nebular continuum intensity profile may be approximated by two top-hat functions, the intensity shortward of being three times higher than longward of (cf. Sect. 3.2). We set equal to 0.015 in the 5300 – spectral range, this ratio being found by Sivan & Perrin (1993) for the “Bubble Nebula” (NGC7635). Since our spectral range does not cover the region of the line, we derive and from the analogous values of the line intensity. At arcsec, the observed line intensity associated with the broad HII region in the Evil Eye is equal to . If the nebular emission arises from the top of the dust lane (case “b”), it is not affected by extinction and, therefore, in the 5300 – spectral range, and the -to- line ratio is equal to its theoretical value. For electron densities and electron temperatures , the theoretical -to- line ratio is equal to 0.351 (Osterbrock 1989). As a consequence, the predicted nebular continuum intensity (as seen by the observer) is in the 5300 – spectral range and in the – spectral range, for case “b”. It is straightforward to see that, when extinction matters (case “a”), in the 5300 – spectral range and the observed -to- line ratio is less than 0.351. Therefore, the predicted nebular continuum intensity (as seen by the observer) is less than in the 5300 – spectral range and less than in the – spectral range, for case “a”. As anticipated in Sect. 3.2, in the broad HII region of the Evil Eye under investigation, the observed nebular continuum emission is expected to be at maximum equal to the observed emission from the H-ionizing stars only at wavelengths larger than .
From the consideration of the poor assumptions made here and the significant results obtained from them, we conclude that a mixture of H-ionizing stars with different spectral types, in reasonable number (considering the region of area sampled per pixel), is responsible of most of the residual blue emission found in the sub-spectra of this HII region. Reassuringly, the total continuum emission from H-ionizing stars and the gas in the 7800 – 9100 spectral region, where the fit in Fig. 4h is made, is at maximum of the same order of magnitude of the rms uncertainty of the background subtracted in the spectrum extraction procedure (Sect. 3.1) and has a flat spectrum between 8200 and 9100 . As a consequence, we conclude that optical depths may be systematically, but only slightly, underestimated when traversing the broad HII region in the Evil Eye intercepted by the spectrograph slit, but that the detection of ERE there is not compromised by the neglect of the total continuum emission from H-ionizing stars and the gas.
5 Discussion
The detection of ERE from the dust lane of NGC4826 has been validated from the analysis reported in Sect. 3.2, 4.1 and 4.5. In addition to our own Galaxy, M82 and LMC (cf. Sect. 1), the Evil Eye Galaxy is the fourth galaxy known so far to display ERE. We note that different methods were adopted for the detection of ERE in these galaxies. Since the spatial information about individual sources of ERE in our Galaxy is still un-matched by observations of external galaxies, it may make more sense to compare the ERE phenomenology of NGC4826 with those of the halo of M82 and 30-Doradus in the LMC. This may be also suggested by the starburst nature of these three galaxies or, at least, of their observed regions (cf. Sect. 1). However, the more extensive ERE phenomenology displayed by the Milky Way is a good basis to the understanding of the ERE phenomenon and is taken into account hereafter.
In the halo of M82, ERE is found to be centered at about , with a FWHM of approximately (Perrin, Darbon & Sivan 1995). In 30-Doradus, the ERE band peaks around , is wide (Darbon, Perrin & Sivan 1998) and also looks similar to those found in Galactic HII regions (Perrin & Sivan 1992; Sivan & Perrin 1993; Darbon et al. 2000). In the Evil Eye, we were able to determine radial changes of , as well as of the wavelength range of the ERE (Sect. 4.2) for the first time in an external galaxy. In particular, in the innermost region of the Evil Eye, and shifts longward of , at galactocentric distances larger than 8.8 arcsec. A larger value of is associated with a larger characteristic size of the photoluminescing particles, as found by Ledoux et al. (2000) for silicon nanocrystals. Under the assumption that the ERE carriers are identified with silicon nanoparticles (e.g. Witt, Gordon & Furton 1998), the results of Ledoux et al. lead us to the conclusion that the active ERE carriers in the Evil Eye have a characteristic size of about 5 nm or larger, i.e. about 40% larger than those in the halo of M82 and almost two times larger than those in the Galactic diffuse ISM (cf. Szomoru & Guhathakurta 1998). Unfortunately, the spectral range of our observations does not allow us to recover the whole ERE band-width. We estimate an extraordinarily large FWHM of approximately from fitting the observed SED of the ERE in the innermost region of the Evil Eye with a symmetry argument, whose validity may be questionable. However, for the Evil Eye, the finding of large values both of the ERE band FWHM and of is consistent with the existence of a relation between these two quantities (Darbon, Perrin & Sivan 1999). For reference, in the Orion Nebula, ERE peaks around , with a FWHM (Perrin & Sivan 1992). We also find a maximum value of of about , for a galactocentric distance arcsec, about four times higher than that derived in the halo of M82 (). In the Orion Nebula, is about (Perrin & Sivan 1992), i.e. almost the same as the maximum value of in the dark lane of NGC4826, with of about 0.6 (Gordon, Witt & Friedmann 1998). In the Evil Eye, decreases to a value of , for arcsec, and keeps on decreasing farther out. At larger galactocentric distances, where there is a broad, bright HII region associated with the dust lane (Sect. 4.2), ERE, if any, has to be faint and beyond the spectral range of our observations. No ERE is detected at even larger galactocentric distances, within the spectral range and noise threshold of our observations.
Since is to first order a measure of the illuminating UV/optical radiation field intensity, as in any other photoluminescence phenomenon, we conclude that the strength of the UV/optical light in the innermost region of the Evil Eye is about four times larger than in the halo of M82 and almost the same as in the Orion Nebula. However, from the comparison of Fig. 5 and Fig. 10, it emerges that the ERE intensity is not simply given by the product of the illuminating UV/optical radiation field times the dust column density, as it might be expected. In fact, both and do not show a monotonic behaviour with increasing values of (Fig. 5) and of (Fig. 10). We remind the reader that is proportional to the radiation field shortward of and is proportional to the number of optical photons longward of . Thus the bluer the illuminating radiation field, the larger . Conversely, and tend to 0, at least within the spectral range and noise threshold of our observations, as a broad, bright HII region is approached. The interpretation of the complex behaviour of the ERE intensity with optical depth and UV/optical radiation field intensity has been recently investigated theoretically by Smith & Witt (2001). These authors show how the experimentally established recognition that photoionization quenches the luminescence of silicon nanoparticles (SNPs) may play a key-role in the reproduction of the extensive phenomenology of ERE in different astrophysical environments of our Galaxy. Thus, it is the excitation and ionization equilibrium of SNPs under the interstellar conditions of a given environment that regulates the fraction of neutral ERE carriers, the only ones capable of luminescing, there. According to this model, the shift of the ERE band’s peak wavelength toward larger values with increasing UV/optical radiation density requires a change of the size distribution of the actively luminescing ERE carriers. This is accomplished by the selective removal of the smaller particles due to size-dependent photofragmentation. We refer the reader to the work of Smith & Witt in order to understand the photophysics of the ERE carriers in more detail. Hereafter we interpret our observational results through this model.
First, it is straightforward to conclude that the presence of a broad, bright HII region, in the portion of the dust lane of NGC4826 subject to our spectroscopic observation, has one main consequence on the ERE phenomenology, illustrated in Fig. 4a–n: no ERE is detected (within our spectral range and noise threshold) between the inner edge of this HII region and the outer edge of the dust lane (Fig. 4h–n). Since the optical depth is relatively large in the vicinity of the HII region (Fig. 5), we conclude that the observed absence of ERE there is not a result of a lack in dust but may be consistent with the photoionization-induced quenching of the luminescence in silicon nanoparticles and the effect of photofragmentation on the characteristic size of the (neutral) luminescing particles. Indeed a hard and strong UV radiation field is present there, as witnessed by the hot effective temperatures and the ionizing photon rate of the OB-associations (Sect. 4.4).
This conclusion seems at odds with the detection of ERE from some of the observed regions of the interstellar medium within Galactic HII regions like Orion (Perrin & Sivan 1992), the Bubble Nebula (Sivan & Perrin 1993) and Sh152 (Darbon et al. 2000) or within 30-Doradus in the LMC (Darbon, Perrin & Sivan 1998). In particular, ERE with peak intensity of about 4 – 6 , peak wavelength around and band-width around has been found to be spatially associated with the ionized gas in Sh152 (Darbon et al. 2000). Nonetheless, in this HII region, no significant ERE is detected where the -line surface brightness peaks, i.e. at the location of the ionizing O9V star S152.1 (Fig. 7 in Darbon et al. 2000). Under the assumption that ERE with around arises from the HII region of NGC4826 under discussion, this peak intensity would result to be one order of magnitude higher than the rms uncertainty of the background subtracted around this wavelength (cf. Sect. 3.1) and, therefore, detectable. Fig. 11 shows that the ratio of the residual intensity and the rms uncertainty of the background subtracted at around is only about two. By contrast, ERE intensities of less than are detected by us at for arcsec (Fig. 4f), and ERE intensities of less than are tentatively detected at for arcsec (Fig. 4g). Therefore, we conclude that, whether there is ERE across this HII region, it has to be longward of . A priori there is no reason to believe that the astrophysical conditions in Orion, the Bubble Nebula, Sh152 and 30-Doradus are the same as in the HII region of the Evil Eye under discussion and even homogeneous across each of them. Indeed the ERE phenomenology is different even for these four HII regions where ERE was detected.
If there is no detection of ERE in the broad, bright HII region intercepted by the spectrograph slit, strong ERE (i.e. with ) is found near the nuclear region of NGC4826. The high values of and of () measured there may point either to a maximum fraction of neutral SNPs or to a maximum ERE efficiency at this location. The NGC4826 nucleus probably hosts different sources of H-ionization, probably associated with a starburst-powered LINER, and has a minimum dust column density. Therefore a particularly high ERE efficiency associated with a small population of neutral SNPs seems to be a viable explanation of the ERE phenomenology there (cf. the case of Orion discussed by Smith & Witt). Conversely, photoionization of the ERE carrier may justify the drop of and for increasing from 1.3 to 4.6 arcsec, where has a (probably secondary) peak (Fig. 10), increasing continuously there (Fig. 5). A shallower decrease of and an increase of take place for 4.6 8.0 arcsec, where is approximately constant and still increases, with no shift of the ERE band. This behaviour may reasonably be due to an increase of the recombination rate, i.e. of the neutral fraction of the ensemble of silicon nanoparticles, the only one capable of luminescing. For 8.0 arcsec, the once again increasing strength (probably) and hardness of the UV radiation field cause the decline of both and and the shift of the ERE band toward longer wavelengths, since the optical depth is about constant there. At the inner edge of the HII region (for 13 arcsec), and are equal to 0, as previously discussed. The absence of ERE in the outermost regions of the Evil Eye, external to this HII region, is consistent with the drop of the dust column density and of the UV/optical radiation field (as suggested by the precipitous drop of the integrated Lyc photon flux).
According to Smith & Witt, the size-dependence of multiple ionization, coupled with single-photon heating, may determine eventually the characteristic size of the (neutral) luminescing particles. In agreement with the results of the latter authors and with the size-dependent photoluminescence properties of silicon nanocrystals (Ledoux et al. 1998), in the Evil Eye both the ERE band and shift to longer wavelengths (cf. Fig. 4a–n) with increasing , approaching the HII region, as previously shown. Indeed the values of of NGC4826 are even larger than in the 30-Doradus, Bubble Nebula and Orion HII regions. Aside from the exceptional size distribution of the actively luminescing particles, the Evil Eye shows similar values of (from 0.7 to 0, with increasing values of ) to those spanned by different Galactic objects, like the diffuse ISM, reflection nebulae and the Orion Nebula (cf. Gordon, Witt & Friedmann 1998). Relying on the results of the latter authors, we conclude that the ERE photon conversion efficiency in NGC4826 is as high as found elsewhere.
6 Conclusions
NGC4826 is a nearby Sab galaxy with an outstanding asymmetrically placed, absorbing dust lane (called the “Evil Eye”) across its prominent bulge, associated with several regions of ongoing star formation. For this galaxy, we obtained accurate low-resolution (/pixel) long-slit spectroscopy (KPNO 4-Meter) in the 5300 – wavelength range, with a slit of 4.4 arcmin length, encompassing the galaxy’s bulge size, positioned across its nucleus. This allowed us to study the wavelength-dependent effects of absorption and scattering by the dust by comparing the stellar spectral energy distributions of pairs of positions across the bulge, symmetrically placed with respect to the nucleus, under the assumption that the intrinsic (i.e. unobscured) radiation field is axi-symmetric, except for the extra contribution due to ongoing star formation activity associated with the dust lane. In this analysis we made use of the multiple-scattering radiative transfer calculations of Witt & Gordon (2000).
As a main result, strong residual Extended Red Emission (ERE) was detected from a region of the Evil Eye within about 13 arcsec projected distance from the NGC4826 nucleus, adjacent to a broad, bright HII region, intercepted by the spectrograph slit.
In the innermost portion of the dust lane, the ERE band extends from about 5700 to , with an estimated peak intensity near . Here, the ERE-to-scattered light band-integrated intensity ratio is about 0.7.
At farther galactocentric distances, approaching the broad, bright HII region, the ERE band and peak intensity shift toward longer wavelengths, while the ERE band-integrated intensity diminishes. Finally, no ERE is detected within our spectral range and noise threshold at the inner edge of this HII region and at any other position at larger galactocentric distance. A secondary maximum of the ERE-to-scattered light band-integrated intensity ratio is found near the position of maximum opacity across the dust lane, associated with a secondary maximum of ongoing star formation activity.
These variations reveal a complex dependence of the ERE on dust column density and interstellar radiation field. While the former quantity is derived from modeling, our data do not characterize the UV/optical flux shortward of . However, we are able to estimate the integrated (i.e. shortward of ) Lyman continuum photon rate and the characteristic effective temperatures of the OB-stars at its origin from the () line intensity and from the line intensity ratios and .
We interpret the ERE as originating from photoluminescence by nanometer-sized oxygen-passivated silicon particles, illuminated by UV/visible photons of the local radiation field. The phenomenology of the ERE in the Evil Eye is consistently interpreted through the recent model of the photophysics of the ERE carrier by Smith & Witt (2001), which attributes a key-role to the experimentally established recognition that photoionization quenches the luminescence of silicon nanoparticles.
When examined within the context of ERE observations in the diffuse ISM of our Galaxy and in a variety of other dusty environments such as reflection nebulae and the Orion Nebula, we conclude that the ERE photon conversion efficiency in NGC4826 is as high as found elsewhere, but that the size of the actively luminescing nanoparticles in NGC4826 is about twice as large as those thought to exist in the diffuse ISM of our Galaxy.
References
- Alonso-Herrero et al. (2000) Alonso-Herrero, A., Rieke, M. J., Rieke, G. H., and Shields, J. C. 2000, ApJ, 530, 688
- Block et al. (1994) Block, D. L., Witt, A. N., Grsbl, P., et al. 1994, A&A, 288, 383
- Böker et al. (1999) Böker, T., Calzetti, D., Sparks, W., et al. 1999, ApJS, 124, 95
- Braun et al. (1992) Braun, R., Walterbos, R. A. M., and Kennicutt, R. C. 1992, Nature, 360, 442
- Chlewicki and Laureijs (1987) Chlewicki, G., and Laureijs, R. J. 1987, in Polycyclic Aromatic Hydrocarbons and Astrophysics, ed. A. Leger, L. d’Hendecourt, & N. Boccara (Dordrecht: Reidel), 335
- Darbon et al. (1998) Darbon, S., Perrin, J.-M., and Sivan, J.-P. 1998, A&A, 333, 264
- Darbon et al. (1999) Darbon, S., Perrin, J.-M., and Sivan, J.-P. 1999, A&A, 348, 990
- Darbon et al. (2000) Darbon, S., Zavagno, A., Perrin, J.-M., et al. 2000, A&A, 364, 723
- de Vaucouleurs et al. (1991) de Vaucouleurs, G., de Vaucouleurs, A., Corwin, H. G., et al. 1991, Third Reference Catalogue of Bright Galaxies (Berlin, Heidelberg, New York: Springer-Verlag) (RC3)
- Digel et al. (1995) Digel, S. W., Hunter, S. D., and Mukherjee, R. 1995, ApJ, 441, 270
- Furton and Witt (1990) Furton, D. G., and Witt, A. N. 1990, ApJ, 364, L45
- Furton and Witt (1992) Furton, D. G., and Witt, A. N. 1992, ApJ, 386, 587
- Gordon et al. (1997) Gordon, K. D., Calzetti, D., and Witt, A. N. 1997, ApJ, 487, 625
- Gordon et al. (1998) Gordon, K. D., Witt, A. N., and Friedmann, B. C. 1998, ApJ, 498, 522
- Heraudeau and Simien (1996) Heraudeau, P., and Simien, F. 1996, A&AS, 118, 111
- Ho et al. (1997) Ho, L. C., Filippenko, A.V., and Sargent, W. L. W. 1997, ApJS, 112, 315
- Hummer and Storey (1987) Hummer, D. G., and Storey, P. J. 1987, MNRAS, 224, 801
- Israel (1997) Israel, F. P. 1997, A&A, 328, 471
- Keel (1983) Keel, W. C. 1983a, ApJ, 268, 632
- Keel (1983) Keel, W. C. 1983b, ApJ, 269, 466
- Kennicutt et al. (2000) Kennicutt, R. C., Bresolin, F., French, H., and Martin, P. 2000, ApJ, 537, 589
- Kraan-Korteweg and Tammann (1980) Kraan-Korteweg, R. C., and Tammann, G. A. 1980, ANac, 300, 181
- Ledoux et al. (1998) Ledoux, G., Ehbrecht, M., Guillois, O., Huisken, F., Kohn, B., Laguna, M. A., Nenner, I., Paillard, V., Papoular, R., Porterat, D., and Reynaud, C. 1998, A&A, 333, L39
- Ledoux et al. (2000) Ledoux, G., Guillois, O., Porterat, D., et al. 2000, Phys. Rev. B, 62, 23, 15942
- Maloney and Black (1988) Maloney, P., and Black, J. H. 1988, ApJ, 325, 389
- Mattila (1979) Mattila, K. 1979, A&A, 78, 253
- Nakai and Kuno (1995) Nakai, N., and Kuno, N. 1995, PASJ, 47, 761
- Nilson (1973) Nilson, P. 1973, Uppsala General Catalogue of Galaxies (Uppsala: Acta Universitatis Upsaliensis)
- Oey and Kennicutt (1997) Oey, M. S., and Kennicutt, R. C. 1997, MNRAS, 291, 827
- Osterbrock (1989) Osterbrock, D. E. 1989, The Astrophysics of Gaseous Nebulae and Active Galactic Nuclei (Mill Valley: University Science Books)
- Perrin et al. (1995) Perrin, J.-M., Darbon, S., and Sivan, J.-P. 1995, A&A, 304, L21
- Perrin and Sivan (1992) Perrin, J.-M., and Sivan, J.-P. 1992, A&A, 255, 271
- Rix et al. (1995) Rix, H.-W. R., Kennicutt, R. C., Braun, R., and Walterbos, R. A. M. 1995, ApJ, 438, 155
- Rubin (1994) Rubin, V. C. 1994, AJ, 107, 173
- Sakamoto et al. (1999) Sakamoto, K., Sachiko, K. O., Sumio, I., and Scoville, N. Z. 1999, ApJS, 124, 403
- Salpeter (1955) Salpeter, E. E. 1955, ApJ, 121, 161
- Schaerer and de Koter (1997) Schaerer, D., and de Koter, A. 1997, A&A, 322, 598
- Scoville et al. (1987) Scoville, N. Z., Yun, M. S., Clements, D. P., et al. 1987, ApJS, 63, 821
- Sivan and Perrin (1993) Sivan, J.-P., and Perrin, J.-M. 1993, ApJ, 404, 258
- Smith and Witt (2001) Smith, T. L., and Witt, A. N. 2001, astro-ph/0109482, ApJ (in press)
- Solomon et al. (1987) Solomon, P. M., Rivilo, A. R., Barrett, J., and Yahil, A. 1987, ApJ, 319, 730
- Strong et al. (1988) Strong, A. W., Bloemen, J. B. G. M., Dame, T. M., et al. 1988, A&A, 207, 1
- Szomoru and Guhathakurta (1998) Szomoru, A., and Guhathakurta, P. 1998, ApJ, 486, L65
- Tully (1988) Tully, R. B. 1988, Nearby Galaxy Catalog (Cambridge: Cambridge University Press)
- Vacca et al. (1996) Vacca, W. D., Garmany, C, D., and Shull, J. M. 1996, ApJ, 460, 914
- Wilson and Scoville (1990) Wilson, C. D., and Scoville, N. Z. 1990, ApJ, 363, 435
- Witt and Boroson (1990) Witt, A. N., and Boroson, T. A. 1990, ApJ, 355, 182
- Witt and Gordon (2000) Witt, A. N., and Gordon, K. D. 2000, ApJ, 528, 799 (WG00)
- Witt et al. (1998) Witt, A. N., Gordon, K. D., and Furton, D. G. 1998, ApJ, 501, L111
- Witt et al. (1994) Witt, A. N., Lindell, R. S., Block, D. L., and Evans, R. 1994, ApJ, 427, 227
- Witt et al. (1992) Witt, A. N., Thronson, H. A., and Capuano, J. M. 1992, ApJ, 393, 611