Cosmology with the Space-Luminosity Distribution of Virialized Halos
Abstract
We derive the observed luminosity function of virialized systems. Coupling this statistic with the mass function predicted by CDM cosmogonies we obtain the functional behavior of the mass–to–light ratio over a wide dynamical range in mass. We conclude that the mass–to–light ratio has a minimum close to the luminosity of an galaxy halo. We also show how to derive in a self-consistent way the X-ray–to–optical luminosity ratio for galaxy systems. As a consequence, we predict a fundamental break in the auto-similar scaling behavior of fundamental correlations in going from the group to the cluster scales.
Department of Astronomy, Cornell University,
412 Space Sciences Bldg. Ithaca, NY 14853, US.
Department of Physics, University of Waterloo,
Waterloo, ON N2L 3G1, Canada.
Dipartimento di Astronomia, Università di Trieste,
via Tiepolo 11, 34131 Trieste, Italia.
1. Introduction
The luminosity function of virialized systems (VS LF) is a relatively unexplored statistical tool.
The VS LF can be used to probe a number of fundamental problems in cosmology, ranging from the efficiency of galaxy formation to the connection between X-ray and optical light in galaxy systems. Moreover the VS LF is more robust at the low–mass end of the clustering hierarchy than is the mass function obtained by traditional estimators such as projected velocity dispersions and X-ray temperatures.
We constructed the VS LF (Marinoni, Hudson & Giuricin, ApJ submitted) after processing, with a weighting scheme, bound objects extracted from the Nearby Optical Galaxy (NOG) catalog (Giuricin et al. 2000). NOG is a statistically controlled, distance-limited ( 6000 km/s) and magnitude-limited (B14) complete sample of more than optical galaxies. The sample covers 2/3 (8.27 sr) of the sky (), a volume of and has a redshift completeness of 98% (see Marinoni 2001). The NOG sample spans a fair volume of the Universe, but better samples the nearby cosmological space than previous all-sky catalogues.
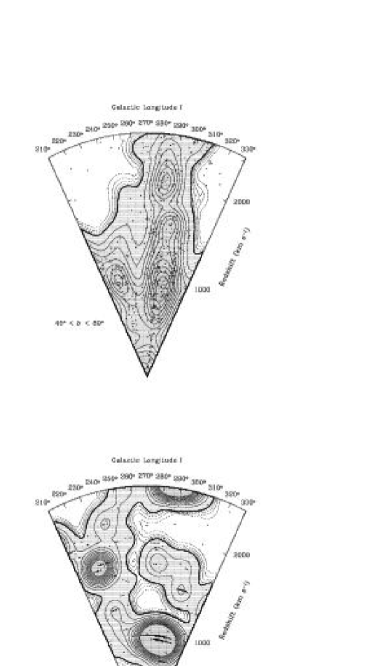
In Fig. 1, the NOG galaxy distribution is shown using 3D isodensity surfaces of low-density contrast () obtained by smoothing with a Gaussian filter of short smoothing length ( km/s). In this way we show the richness of details recovered also on small scales.
In Fig. 1, we have graphically summarized the performance of the algorithms developed in order to reconstruct, in an self-consistent way, galaxy systems and pseudo real-space positions (Marinoni et al. 1998; Marinoni et al. 1999; Giuricin et al. 2000). Most of the NOG galaxies are found to be members of galaxy binaries (which comprise 15% of galaxies) or groups with at least three members (45% of galaxies). About 40% of the galaxies are left ungrouped (isolated galaxies).
2. The Virialized Systems Luminosity Function
Having obtained the group catalog, we correct the sample for galaxies falling beyond the NOG magnitude limit and for the completeness of virialized systems of a given richness. The resulting “all-systems” catalog contains 4000 objects ( 2800 systems with one observed member and 1100 groups with at least 2 members). We then calculate a VS LF for virialized systems in the same manner as is usually done for galaxies.
Our results show that the B-band VS LF is insensitive to the choice of the group-finding algorithm, to the peculiar velocity field models with which distances are reconstructed, but is sensitive to the effects of the large-scale environmental density.
We denote by the subscript “s” luminosities of systems (as opposed to individual galaxies). The VS LF (Fig. 2) is well described, over the absolute magnitude range , by a Schechter function with , and or by a double-power law: for and for with , corresponding to . The characteristic luminosity of virialized systems, , is times brighter than that () of the luminosity function of NOG galaxies. In Fig. 2, we show how isolated galaxies dominate the low-luminosity portion of the VS LF, while richer systems dominate in a progressive way the bright end. In the limit of low luminosity the VS LF approaches the galaxy LF. We find that, after correcting for the unseen luminosity, systems with total luminosity give a 25% contribution to the total luminosity density of the universe, systems with and contribute by 58% and 75% respectively, while a substantial fraction of luminosity density (10%) is contributed by large systems with more than .


3. Cosmology with Distribution Functions
The traditional approach for shaping interesting cosmological scaling relationships has been to estimate correlations directly from the data. However this is problematic since different fitting procedures of the same set of data (with often unknown errors) usually lead to discrepant results. Moreover, when errors are large it is almost impossible to disentangle subtle deviations from the traditional null hyphotesis of a logaritmically linear correlation.
On the other hand, comparing statistical distributions of complete set of data is an economic way to obtain robust insights into the physical properties of cosmological objects. Here we show how comparing the VS LF with the Press & Schechter mass distribution function and with the X-ray luminosity function we can link in a continuum some physical properties of galaxy and clusters.
3.1. The Mass–to–Light Ratio as a Function of Environment
The traditional assumption in cosmological applications is that mass-to-light ratio () is approximately constant. By comparing our observed luminosity function with the Press-Schechter mass functions in cold dark matter cosmogonies (SCDM, OCDM, CDM and CDM) we can turn the problem around and obtain the function directly.
In this way the scaling, which tells us about the efficiency with which the universe transforms matter into light, can be used not only as a traditional estimator of the density parameter but also as a diagnostic tool for different models of galaxy formation.
We find that, if a constant is assumed, all cosmological models fail to match our results. In order for these models to match the faint end of the luminosity function, a decreasing as with luminosity is required. The value of reaches a minimum around , which corresponds roughly to . It then remains quite flat over 1.5 dex in luminosity. The behavior at the bright end is model-dependent; for the CDM model, must remain constant (), whereas for the CDM model it must increase with luminosity as from the scale of galaxy groups () to that of rich clusters (). This scaling behavior of in a CDM cosmology appears to be in qualitative agreement with the predictions of semi-analytical models of galaxy formation (Benson et al 2000).


3.2. The vs Function
The problem of deriving the functional form in galaxy systems can be solved if we assume that all virialized halos detected in the optical also radiate in X-rays and compare their observed LFs. In the regime of faint systems and groups ( or ), we find that the numerical solution is well approximated by . In the regime of rich groups to clusters ( or ), the solution is well approximated by . In Fig. 4 we compare our predictions with observational data. Interestingly we note that the change in the shape of the relation for corresponds exactly to a change in the chemical properties and the spatial distribution of the ICM on the scales of groups (Renzini 1997).
| Groups | Clusters | ||
| Predicted | Observed | Predicted | Observed |
| Moore et al. 1993 | Adami et al. 1998 | ||
| Ponman et al. 1996 | White, et al. 1997 | ||
| Helsdon et al. 2000 | |||
| Ponman et al 1996 | White et al. 1997 | ||
Coupling the mass–to–light ratio with the X-ray–to–optical luminosity ratio and making some minimal and self-consistent hypotheses (virialization, X-ray emission described in terms of thermal bremsstrahlung), we can predict the behavior of fundamental scaling relationships over the group and cluster regimes. In Table 1, we compare our predictions (CDM cosmology) with existing observations. Our results are in agreement with models that predict an initial non-equilibrium phase of preheating during halo formation (Cavaliere, Menci, & Tozzi 1997).
References
Adami, C., Mazure, A., Biviano, A., & Katgert, P. 1998, A&A, 331, 493.
Benson, A. J., Cole, S., Frenk, C. S., et al. 2000, MNRAS, 311, 793.
Cavaliere, A., Menci, N., & Tozzi, P. 1997, ApJ, L21.
Giuricin, G., Marinoni, C., Ceriani, L., & Pisani, A. 2000a, ApJ, in press
Kaiser, N. 1986, MNRAS, 222, 323
Mahdavi, A., Geller, M. J., Böhringher, et al. 1999, ApJ, 518, 69.
Marinoni, C., Monaco, P., Giuricin G., & Costantini, B. 1998, ApJ, 505, 484
Marinoni, C., Monaco, P., Giuricin G., & Costantini, B. 1999, ApJ, 521, 50
Marinoni, C. 2001, Ph. D. Thesis, University of Trieste, Trieste
Moore, B., Frenk, C. S., & White S. D. M. 1993, MNRAS, 261, 827.
Ponman, T. J., Bourner P, D, J., Ebeling, H., et al. 1996, MNRAS, 283, 690.
Renzini, A. 1997, ApJ, 488, 35.
White, D. A., Jones, C., & Forman W. 1997, MNRAS, 292, 419.