A Solar Neighborhood Search for Tidal Debris from Centauri’s Hypothetical Parent Galaxy
Abstract
Recent stellar population and chemical abundance studies point to an accreted origin of Cen. In this light, and given the retrograde, small size orbit of Cen, we search for a kinematical signature left by its hypothetical parent galaxy in the Solar neighborhood. We analyze the largest-to-date sample of metal poor stars (Beers et al. 2000) and we find that, in the metallicity range [Fe/H] , a retrograde signature that departs from the characteristics of the inner halo, and that resembles Cen’s orbit, can be identified.
Department of Astronomy, University of Virginia, 530 McCormick Road, Charlottesville, VA 22903
1. Introduction
Recent advances in understanding the nature and origin of the highly unusual globular cluster Centauri (see Majewski et al. 2000 for a summary of properties), are due primarily to the following findings: the multiple-peak metallicity distribution seen in the structure of the giant branch (Lee et al. 1999; Pancino et al. 2000; Frinchaboy et al. 2001), the correlation between age and metallicity (e. g., Hughes & Wallerstein 2000, Hilker & Richtler 2000), and the s-process enhanced enrichment in cluster stars compared to halo stars of similar metallicity (Smith et al. 2000; Vanture, Wallerstein & Brown 1994). These findings suggest that Cen underwent self-enrichment with at least three primary enrichment peaks (Pancino et al. 2000, Frinchaboy et al. 2001), over a period of at least 3 Gyr (Hughes & Wallerstein 2000). The s-process heavy-elements are primarily synthesized in low-mass (1.5 to 3.0 M⊙) asymptotic giant branch (AGB) stars (see e.g., Travaglio et al. 1999 and references therein). In order to enrich the cluster in s-process elements, the ejecta from low-mass stars that evolve on timescales of years had to be retained by the cluster and incorporated in the next generations of stars. This long and complex star formation history is inconsistent with the cluster originating on its current orbit, which is of low energy and confined to the disk. With a period of only 120 Myr (Dinescu, Girard, & van Altena 1999 - hereafter DGvA), the frequent disk crossings would have certainly swept out all of the intracluster gas soon after its formation, and the result would be a single-metallicity system that would resemble most of the Galactic globular clusters.
It appears thus that Cen evolved somewhere away and independently from the Milky Way, in a system that was massive enough to retain ejecta from previous generations of stars, and to undergo multiple episodes of star formation. Its current orbit can be reconciled with the complex star formation history only if it represents a strongly decayed orbit. This, in turn, requires a massive enough system such that dynamical friction was able to drag it to the inner regions of the Galaxy. This system must have also been rather dense in order to survive the tidal field of the Milky Way and continue to loose orbital energy due to dynamical friction down to an orbit with an apocenter of the order of the Solar circle radius. The current mass of Cen (5 M⊙; Meylan et al. 1995) can not generate sufficient dynamical friction to modify its orbit to its current small size (DGvA).
Following these arguments, the debris from the massive putative parent galaxy of Cen may be expected to imprint a kinematical feature in large samples of local, metal-poor stars. The purpose of this investigation is to search for such a feature in the kinematically hot halo. We have used three data sets: the largest, kinematically unbiased sample of metal poor stars () provided by Beers et al. (2000) (hereafter B2000), the sample of globular clusters with measured absolute proper motions (DGvA updated with new distances from Harris 1996, and with a few more clusters; see Dinescu et al. 2001), and a small sample of stars with complete kinematics and abundance measurements for O, Na, Mg, Si, Ca, Ti, Cr, Fe, Ni, Y and Ba (Nissen & Schuster 1997, hereafter NS97).
2. Cen and the Globular Cluster System
DGvA pointed out that Cen’s orbit is markedly retrograde for its low inclination and low orbital energy, when compared to the orbits of clusters with similar metallicity, horizontal branch morphology and orbital energy (see Fig. 6 and 7 in DGvA). Along with Cen, two other clusters were identified to lie in the same region of the orbital parameter space: NGC 362, and NGC 6779 (M56) (DGvA). They both have low-inclination, retrograde orbits, with pericentric distances similar to that of Cen ( kpc). However, NGC 362 and NGC 6779 have apocentric distances larger than Cen: 11 and 14 kpc respectively, compared to 6 kpc for Cen.
Some controversy regarding NGC 362’s absolute proper motion is apparent: Geffert reported at this conference that his new determination with respect to stars implies an orbit less similar to that of Cen. In our paper (DGvA) we have used an average of two proper-motion measurements for NGC 362. These measurements were: a) calibrated to stars (Odenkirchen et al. 1997), and b) calibrated to stars in the Small Magellanic Cloud (SMC) (Tucholke 1992), to which was applied the absolute proper motion of the SMC as measured by Kroupa & Bastian (1997). While the absolute proper motion determination may remain debatable, another piece of evidence was presented at this conference regarding a possible common origin of NGC 362 and Cen. Smith et al. (2000) showed that the [Cu/Fe] abundance of Cen’s stars is low ([Cu/Fe] = -0.6) and remains remarkably constant with increasing metallicity (their Fig. 9). In field stars, the Cu abundance increases with metallicity (Sneden, Gratton, & Crocker 1991, Castro, Porto de Mello, & da Silva 1999) from subsolar values to 0 at solar metallicity. This trend is explained if a substantial contribution to Cu comes from supernovae Type Ia (Matteucci et al. 1993). Cuhna et al. (2001) reported at this conference that NGC 362 too shows the deficit in [Cu/Fe] much like Cen’s stars, and in contradistinction with clusters NGC 288 and M4. These latest clusters have a similar metallicity with NGC 362, but do not show an underabundance in Cu, when compared to field stars of similar metallicity.
NGC 6779’s absolute proper motion determination was based only on the calibration to stars (Odenkirchen et al. 1997). This measurement seems reliable as diffuse X-ray emission detected in the area of the cluster is found to be aligned with the direction of the proper motion (Hopwood et al. 2000). This emission is interpreted as heated interstellar medium in the wake of the cluster as a result of the interaction of the intracluster gas with the halo gas.
3. Inner Halo Properties as Derived from the Beers et al. Catalog
Chiba & Beers (2000) characterized the local halo from the analysis of the B2000 catalog. The sample they analyzed comprised stars within 4 kpc of the Sun, and with Galactocentric distance along the plane between 7 and 10 kpc. From their results we summarize here those that are relevant to our investigation. A relatively “pure” sample of halo stars can be found at [Fe/H] (their Fig. 9). Thick disk stars begin to contribute to the overall metal poor population ([Fe/H] ), with a fraction that increases with increasing metallicity (their Fig. 10). In the metallicity range [Fe/H] -1.5, this fraction is . The mean rotation velocity of halo stars decreases with increasing distance from the Galactic plane: km/s/kpc). At a mean distance from the Galactic plane kpc, the rotation velocity is km/s (their Fig. 4). They have also found that, at a metallicity of -1.7, the mean rotation of the low ( kpc) halo drops to 20 km/s, from 60 km/s at lower metallicities. At higher metallicities, the mean rotation increases with increasing metallicity, as more thick disk stars begin to contribute to the overall population (see their Fig. 3). At the same value of [Fe/H] , Chiba & Beers (2000) also find a higher concentration of stars at large eccentricities (e ) (their Fig. 6). They speculate that stars at [Fe/H] formed from infalling gas rather than from the somewhat more organized material of the inner halo. Interestingly, the mean metallicity of Cen is -1.6 (Harris 1996).
Here, we will look in more detail at the stars that produce the drop in the rotation velocity dependence with metallicity. Using the B2000 distances, radial velocities, and absolute proper motions we derive velocities using R0 = 8 kpc, km/s , and a peculiar Solar motion (U, V, W ) = (-11.0, 14.0, -7.5) km/s, where U is positive toward the Anticenter. We integrate the orbits in the axi-symmetric analytic potential described in Paczyński (1990), and we derive orbital parameters in the manner described in DGvA.
3.1. Rotation Velocity Distributions
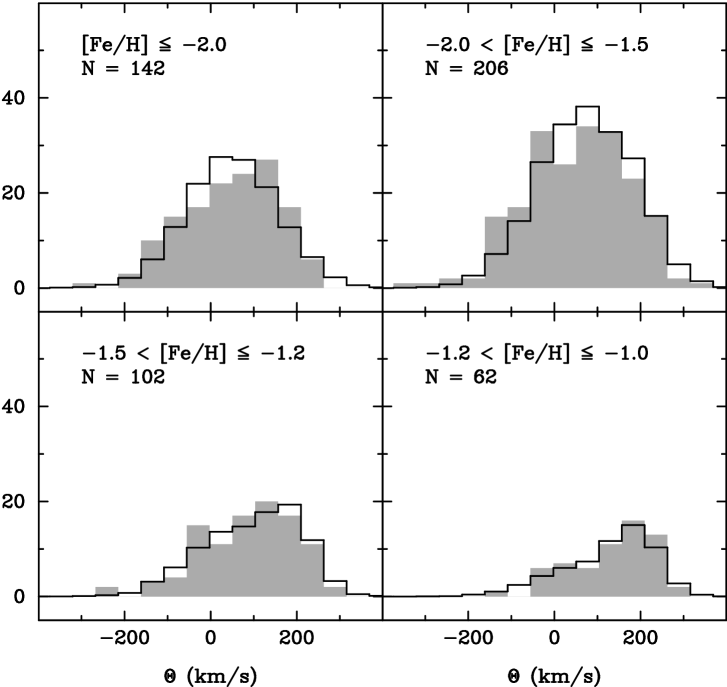
In Figure 1 we show the distribution of the rotation velocity (in a cylindrical coordinate system, where the component is positive outward from the Galactic center, is positive toward Galactic rotation, and W is positive toward the North Galactic Pole), for four metallicity groups, and within kpc. The shaded histograms represent the observed distribution, and the continuous line represents the distribution derived from a simple kinematical model. Velocities in this model were drawn from Gaussian velocity distributions of means and dispersions derived from the B2000 catalog, and including both halo and thick disk populations. Specifically, for [Fe/H] we used km/s, km/s, and the fraction of thick disk stars fTD = 0.0; for [Fe/H] , km/s, km/s, fTD = 0.1, km/s, km/s; for [Fe/H] , km/s, km/s, fTD = 0.3, km/s, km/s; and for [Fe/H] , km/s, km/s, fTD = 0.5, km/s, km/s. The total number of stars in each sample is indicated in the respective panel. The model distributions were drawn for 10000 points, and normalized to the area of the observed distributions. We have chosen only one mean rotation velocity to represent the halo, for each metallicity interval in the following way. For all the stars within kpc, the median was determined, and for this value of , the rotation velocity was read directly from the linear fit derived in Fig. 4 of Chiba & Beers (2000).
For the “pure” halo sample (top, left panel of Fig. 1) the simple, one-Gaussian model does not represent the data well. The data peak at km/s — a higher velocity than the value we chose in the model — and they also show more stars at strongly retrograde velocities ( km/s) than the model. A superposition of two or more Gaussians with appropriately chosen mean rotation velocities and relative number of stars with respect to the majority of stars that peak at km/s, can be envisaged however, to better describe the data. This composite kinematics can be thought of as arising from the fact that some of the stars within kpc are visiting this region rather than being confined to it. These stars actually reside on orbits of various, mean larger than 1 kpc, and therefore belong to various populations of accordingly lower mean .
The next two metallicity samples (upper right and lower left panels) show the expected peaks at prograde velocities that are approximately matched by the models, and a second peak at modest retrograde velocities ( km/s). The most metal rich sample (lower right panel) shows a rather good fit to the simple kinematical model, but there are few stars in this sample. The second peak seen at retrograde velocities is intriguing not necessarily because it is not reproduced by the kinematical model, but for the following reason. The sample with [Fe/H] has a minor contamination from the thick disk; therefore, it can be compared in a meaningful way to the “pure” halo sample. They both show a tail toward strongly retrograde velocities — that is not reproduced by our one-Gaussian models — but there is no second peak in the “pure” halo sample. It is thus difficult to explain the second peak at retrograde velocities even in a composite kinematical model of the halo, as sketched above and perhaps seen in the “pure” halo sample. One would have to imagine a significant population that comes from orbits of one particular mean value that corresponds to km/s, rather than a population drawn from a mixture of various mean orbits.
In what follows we will focus on two metallicity samples: the “pure” halo [Fe/H] , and the sample within [Fe/H] , which has a relatively small fraction of thick disk stars ().
3.2. Orbital Angular Momentum Distributions
We have constructed the orbital angular momentum Lz distributions for the [Fe/H] sample and for the [Fe/H] sample, and for stars with maximum excursions above/below the Galactic plane kpc, to represent the low halo, and kpc for the whole halo. These are shown in Figure 2, where the thin line represents the metal-poor sample (referred to as sample A hereafter), and the thick line the less-metal-poor sample (referred to as sample B hereafter); the range of is specified in each panel.
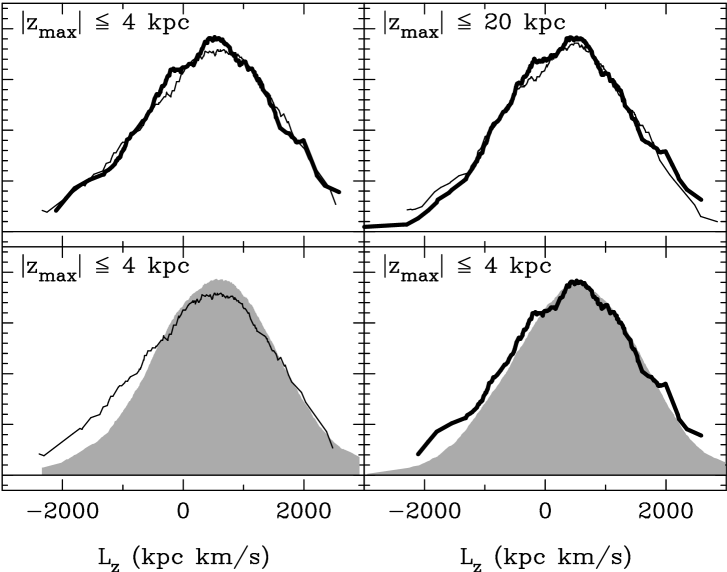
The distributions were constructed by passing a moving box of half-width equal to the dispersion in Lz: 900 kpc km/s. They were also normalized to the total number of stars, in order to be intercompared. A thick-disk component of (Section 3) of the total number of stars is expected in sample B, roughly at L kpc km/s = 1520 kpc km/s. For this reason, sample B was normalized to a slightly larger number than the number corresponding to a “pure” halo population. Therefore, the distributions were slightly shifted in Lz (up to 100 kpc km/s) in an attempt to best match them, and to keep the sample B distribution slightly under the sample A distribution. For the kpc samples (top right panel), the distributions are remarkably similar with the following exceptions. They differ in the thick-disk range (L to 2000 kpc km/s), which was expected, at strongly retrograde orbits (L kpc km/s), but there are few stars here, and — most significantly — at modest retrograde orbits L kpc km/s. At this latter value of Lz, sample B shows an excess of stars, that produce a shoulder in the distribution when compared with sample A. For the low halo ( kpc; top left panel in Fig. 2), sample B again shows the shoulder, or the excess of stars at L, when compared to sample A. Sample B also seems to have a slightly sharper peak than sample A.
The bottom panels of Fig. 2 show — for the low halo — the observed distributions for sample A (left panel) and sample B (right panel) compared to a model of the halo (shaded curves). This model was designed to describe the halo only, and to input the kinematics only and not the spatial distribution. Thus, for each star in the appropriate metallicity sample, a velocity drawn from a Gaussian distribution was assigned, while preserving the positional information from the B2000 catalog. Each of the velocity components were drawn from Gaussian distributions specific for the halo. We have used (W) = (0, 60, 0) km/s, and () = (141, 106, 94) km/s. Ten sets of halo velocity components were assigned to each star, and for each the orbits were integrated in order to obtain the model distributions. The models agree well with the data in the prograde regime; however, they fail to reproduce the tail toward retrograde orbits, likely due to the use of a single value of the mean . They can not reproduce the shoulder structure seen in sample B. Therefore, preserving the current spatial distribution of the stars and statistically assigning halo-like velocities will not produce the excess of stars at L kpc km/s. The conclusion is that the shoulder is due to stars on particular orbits; the excess of such orbits is not seen in sample A. For Solar neighborhood stars, this Lz excess corresponds to that seen in the rotation velocity distribution at modest retrograde velocities (Section 3.1).
4. Orbit Characteristics
We look now at the detailed characteristics of the orbits in samples A and B. In Figure 3, top panels, we show the orbital energy E as a function of Lz. All left panels represent sample A, while the right panels sample B. The number of stars is indicated in each panel. Open symbols represent all stars in B2000, while highlighted (filled) symbols show those classified as RR Lyrae variables in B2000. For sample B, an almost vertical structure can be seen at L kpc km/s and orbital energy E (km/s)2. This structure is seen in the RR Lyrae population as well.

We divide now each metallicity sample into two groups: prograde (L) and retrograde (L) orbits. For each group we plot the orbit inclination as a function of orbital eccentricity . The middle panels of Fig. 3 show the prograde group, and the bottom panels the retrograde group. A higher density of stars, reproduced as well in the RR Lyrae population, can be seen clumping at and , for the retrograde group of the B sample of stars.
By selecting stars with high eccentricities, we safely discard the poorly known fraction of stars that have rotational support, be it halo or thick disk. Therefore, in each metallicity sample, one would expect the same number of highly eccentric stars in the prograde sample, as in the retrograde sample, in a completely pressure-supported halo. Selecting stars with we find 33 stars in the prograde sample A, and 37 in the retrograde sample A, while in sample B we find 45 stars in the prograde group and 70 in the retrograde group. The 2.3- excess of highly eccentric stars in the retrograde group of sample B resides at moderate to very low orbit inclinations. Interestingly enough, the RR Lyrae population in sample B follows the same pattern at : there are 15 stars in the prograde group, and 30 stars in the retrograde group.
We plot now all of the three integrals of motion, Lz, E, and total angular momentum L in Figure 4. In addition to the B2000 sample, we use the NS97 sample of stars with chemical abundance measurements, and the globular cluster sample (DGvA). Distances and absolute proper motions for the NS97 sample are from the catalog (ESA 1997), while the radial velocities are from the SIMBAD database. The highlighted (filled) symbols show objects of special interest. Among the globular clusters, Cen, NGC 362, and NGC 6779 are highlighted, as they are hypothesized to belong to the same parent galaxy (Section 2). One star in the NS97 sample, namely HD 106038, is particularly interesting, and it is highlighted in Fig. 4 with a filled triangle. HD 106038 is overabundant in Si ([Si/Fe] = 0.57), Ni ([Ni/Fe] = 0.18), and in s-process elements Y ([Y/Fe = 0.49) and Ba ([Ba/Fe] = 0.49), when compared to halo stars of similar metallicity (NS97, their Fig 4 and 5). At a metallicity of -1.26, HD 106038 displays canonical enhancement for metal-poor, halo stars produced in a type II supernovae-dominated environment (NS97). HD 106038’s abundance patterns, in particular the enhanced s-process elements are unusual among halo stars (NS97); however, they agree very well with the abundance patterns of Cen stars shown by Smith et al. (2000). HD 106038 is a main sequence star, with no radial-velocity evidence of a companion likely to pollute the star with AGB ejecta (NS97).
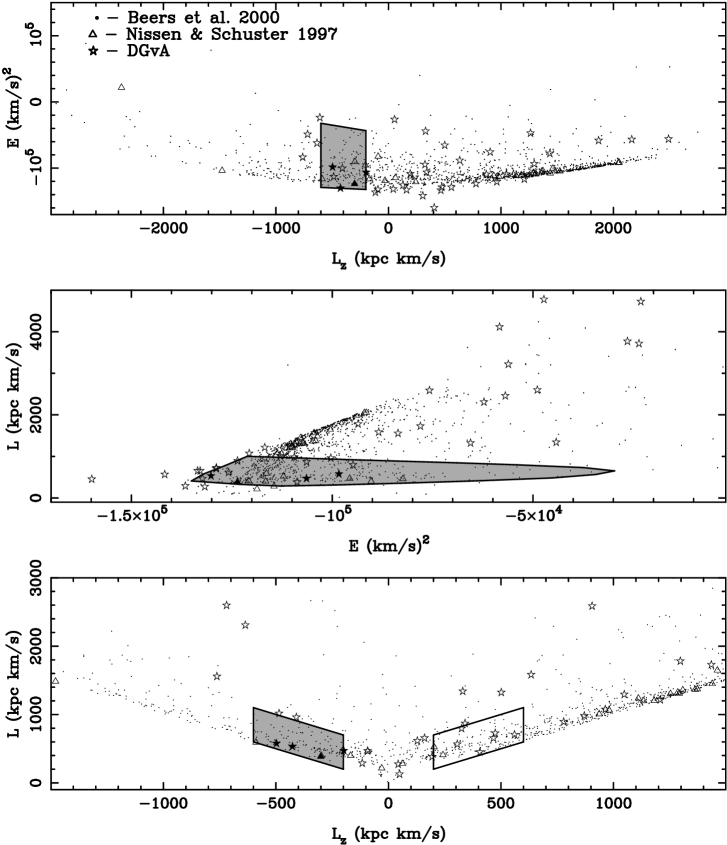
In the plot of E as a function of Lz, the clusters Cen, NGC 362, and NGC 6779 and HD 106038 lie in the retrograde region where the excess of stars was found in sample B of the B2000 catalog (Fig. 2, and 3). The plots of L versus E, and L versus Lz show that, indeed the three clusters and HD 106038 lie in the same volume of the phase space. Guided by the distribution of the three clusters, we define a box in the L-Lz plot (shaded area in Fig. 4) aimed at selecting candidate objects in the NS97 and B2000 data sets. The corresponding area is overplotted in the E-Lz and L-E plots. It is interesting to note that, although the box was defined by the L-Lz pair to cover a restricted region, in E, this region covers a large range of values. Figure 5 shows the orbit inclination as a function of eccentricity for stars and clusters in the L-Lz region defined above, and for stars in a symmetrically defined region at prograde orbits (shown by the contour in the bottom panel of Fig 4).
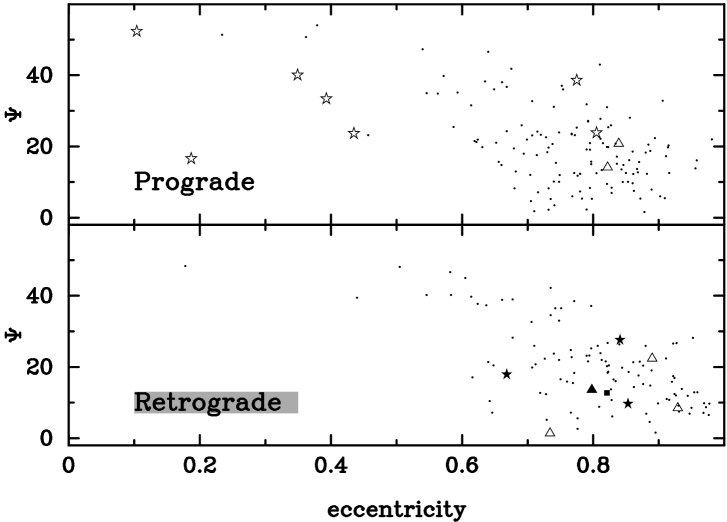
There is not a significantly larger number of stars at in the retrograde group (56 stars) than in the prograde group (50 stars) in this latter plot. This is because we have included all stars from B2000. However, selecting RR Lyrae with , we obtain 15 stars in the prograde box, and 29 in the retrograde box. Also, in the retrograde domain, a structure that starts from very high eccentricities () and very low inclinations () toward and is apparent. This structure is also seen in the RR Lyrae population (Fig. 3, bottom right panel). Although the region of is well populated in the prograde domain — one globular cluster, and two NS97 stars are found here — there is no structure apparent here, and there are very few stars at .
5. RR Lyrae in Beers et al. Catalog
We have seen that the excess population at L kpc km/s, , and is enhanced when one considers the RR Lyrae stars in B2000 (Section 4). In Figure 6 we show the periods as a function of metallicity for RRab and RRc stars in B2000, and in Cen, for comparison. The periods and the RR type were taken from the General Catalogue of Variable Stars 4th edition (Kholopov et al. 1998, hereafter GCVS) for the B2000 stars. For Cen, periods, RR type and metallicities (based on the hk index) were taken from Rey et al. (2000). The top panel shows the RRab (filled circles) and the RRc (open triangles) stars in the prograde box defined in Fig. 4. The middle panel shows those in the retrograde box, and the bottom panel those in Cen.

The presence of RRab variables with P days, and RRc variables with P days is characteristic of Cen (Fig. 6 with data from Rey et al. 2000, see also, Clement & Rowe 2000). These long period RR Lyrae stars are seen in a larger abundance than in Cen only in two metal rich, bulge clusters (NGC 6388 and NGC 6441, Pritzl et al. 2000). There are no such long period RR Lyrae stars in either the prograde or the retrograde sample.
The prograde sample shows a rather random distribution, with periods — on the mean — lower than those in Cen. The retrograde sample distinctly shows a high concentration of stars at P days and [Fe/H] , that is not seen in either the prograde sample or the Cen sample. It is predominantly these latter stars that comprise the excess of RR Lyrae stars in the retrograde sample, when compared to the prograde sample (Fig. 6 and Fig. 3, also Section 4). The information from Fig. 6 is however insufficient to either support or reject confidently the notion that part of the population of the RR Lyrae in the retrograde sample may resemble that in Cen.
Two stars that were classified as RR Lyrae in B2000, are in fact W Virginis variables of short periods (P = 1.1 and 1.3 days), also known as BL Herculis variables, according to GCVS. This type of variable is found in globular clusters. Cen is the Galactic cluster with the largest population of BL Her objects: it has 5 such stars according to Nemec, Linnell-Nemec, & Lutz (1994). More recently, Kaluzny et al. (1997) have found three new BL Her candidates in Cen. Interestingly, one of the two BL Her stars in B2000, namely V 716 Oph, resides in the retrograde region defined in Section 4, has an eccentricity , an inclination , and a metallicity [Fe/H] = -1.55. V 716 Oph is highlighted in the plot of Fig. 5 with a filled square symbol. The second BL Her star in B2000 is XX Vir. It has a metallicity value [Fe/H] = -2.4, that is much lower than the metal-poor limit of stars in Cen.
6. A Simple Disruption Model
The stars and globular clusters that have similar integrals of motion as Cen, tend to have larger eccentricities than Cen (Fig. 4, Section 4). Obviously, these candidates will have larger apocentric radii than Cen at a fixed pericenter radius, in other words, they reside on orbits that are slightly more energetic than Cen’s. Under the hypothesis that these candidates belong to Cen or the disrupted system that once contained Cen, they ought to lie on trailing streams if they are on orbits slightly more energetic than Cen’s (e. g., Johnston 1998). We have used the tidal disruption model developed by Johnston (1998) in order to see whether tidal debris from a system that now has the orbit of Cen can attain orbits such as those of our candidates. We note that the Johnston (1998) model was developed for the disruption of Galactic satellites that reside mostly in the outer Galaxy; therefore, quantitatively it may not be an accurate description of the event. However, here we will present only a qualitative inspection.
We start with a system of M = M⊙ that has the orbit of Cen. We integrate back in time for 1 Gyr; at each pericenter passage, the system is assumed to have lost of it’s mass. In Figure 7 we show the spatial distribution in the Galactic plane (left panel) and perpendicular to the Galactic plane (right panel) of the B2000 stars (dots), Cen’s orbit (continuous line), and two trailing streams (grey bands). The trailing streams correspond to pericenter passage np = -11 (light gray band; 918 Myr ago), and to pericenter passage np = -10 (dark gray band; 835 Myr ago).
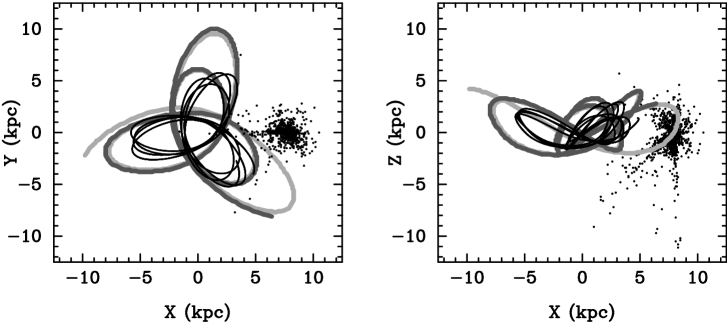
The pericenter passage np = 0 corresponds to the passage closest in time to present time. At np = -11, the system had a total mass of 3.6 108 M⊙. The spatial location of the trails shows that indeed, in the Solar neighborhood we can expect to find debris from this system. These tidal streams are distributed along orbits that have the shape of the orbits of our candidates: high eccentricity and low orbital inclination. We also note that all of the corresponding leading (lower energy) tidal streams are located in and close to the bulge.
A detailed N-body simulation of the disruption event has yet to be explored in order to better understand the process, and to be able to quantitatively describe it. For instance, the mass of tidal debris expected in the Solar neighborhood would be particularly useful in order to correlate with the excess of stars that we see in a given domain of phase space (Section 4). Similarly, the predicted kinematics of tidal debris, when compared to that of candidate stars, can help demonstrate how viable, and under what conditions, the accreted scenario for Cen is.
7. Summary
We have shown that a distinct population of stars with a metallicity range that inludes the mean metallicity of Cen, and with Cen-like phase-space characteristics emerges from the B2000 data. Choosing a metallicity and orbital-parameter range (Section 4) such that we maximize the “signal” of this population with respect to the “noise” of the halo, we obtain an excess population at 2.3- level. By considering the RR Lyrae stars in B2000, we also see this population. We find that the excess RR Lyrae population is predominantly of RRab type, with periods of 0.5 days, and [Fe/H] .
The candidates to have been torn from the system that once contained/was Cen have one main orbit property: they have a larger eccentricity () (i. e. orbital energy) than that of Cen (). Using the disruption model developed by Johnston (1998) for the orbit of Cen, we find that trailing tidal debris with orbit characteristics of those of the candidates are found in the Solar neighborhood.
We also find that HD 106038, a single, main sequence star with a chemical abundance pattern very similar to that in Cen stars, in particular enhanced s-process elements (NS97), has Cen-like orbital properties. Similarly, V716 Oph in B2000 (a BL Her-type variable found in globular clusters of which Cen is most abundant) has Cen-like orbital properties, and a metallicity close to the mean metallicity of Cen.
We identify two globular clusters as candidates for belonging to the system that once contained/was Cen, NGC 362 and NGC 6779. The more metal rich cluster, NGC 362 shows a deficiency in [Cu/Fe] when compared to globular clusters of similar metallicity, a deficiency seen so far only in Cen stars.
Acknowledgments. I am grateful to Márcio Catelan for his suggestions regarding the RR Lyrae stars, and to both Márcio Catelan and Terry Girard for numerous helpful discussions concerning this work. This research has made use of the SIMBAD database, operated at CDS, Strasbourg, France.
References
Beers, T. C., Chiba, M., Yoshii, Y., Platais, I., Hanson, B., Fuchs, B., & Rossi, S. 2000, AJ, 119, 2866
Castro, S., Porto de Mello, G. F., & da Silva, L. 1999, MNRAS, 305, 693
Chiba, M. & Beers, T. C. 2000, AJ, 119, 2843
Clement, C., & Rowe, J. 2000, AJ, 120, 2579
Cunha, K., Smith, V. V., & Suntzeff, N. B. 2001, this Conference Proceedings
Dinescu, D. I., Girard, T. M., & van Altena, W. F. 1999, AJ, 117, 1792
Dinescu, D. I., Majewski, S. R., Girard, T. M., & Cudworth, K. M. 2001, AJ, in press
ESA 1997, The Hipparcos and Tycho Catalogues (EAS SP-1200) (Noordwijk: ESA)
Frinchaboy, P. M., Majewski, S. R., Rhee, J., Ostheimer, J., Patterson, R. J., Kunkel, W. E., Johnson, W. Y., Dinescu, D. I., Palma, C., Westfall, K. B., & Smith, V. V. 2001, this conference proceedings
Harris, W. E. 1996, AJ, 112, 1487
Hilker, M., & Richtler, T. 2000, A&A, 362, 895
Hopwood, M. E. L., Evans, A., Roberts, T. P., Burleigh, M. R., Odenkirchen, M., Beardmore, A. P., O’Brien, T., Jeffries, R. D., Penny, A., & Eyres, S. P. S. 2000, MNRAS, 316, L5
Hughes, J., & Wallerstein, G. 2000, AJ, 119, 1225
Johnston, K. V. 1998, ApJ, 495, 297
Kaluzny, J., Kubiak, M., Szymański, A., Udalski, A., Krzemiński, & Mateo, M. 1997, A&AS, 125, 343
Kholopov, P. N., Samus, N. N., Frolov, M. S., Goranskij, V. P., Gorynya, N. A., Karitskaya, E. A., Kazarovets, E. V., Kireeva, N. N, Kukarkina, N. P. Kurochkin, N. E., Medvedeva, G. I., Pastukhova, E. N., Perova, N. B., Rastogruev, a. S., & Shugarov, S. Y. 1998, Combined General Catalog of Variable Stars, 4.1, Ed. II/214A
Kroupa, P. & Bastian, U. 1997, New Astronomy, 2, 77
Lee, Y. -W., Joo, J. -M., Sohn, Y. -J., Rey, S. -C., Lee, H. -C., & Walker, A. R. 1999, Nature, 402, 55
Majewski, S. R., Patterson, R. J., Dinescu, D. I., Johnson, W. Y., Ostheimer, J. C., Kunkel, W. E., & Palma, C. 2000, in Proceedings of the 35th Liege Colloquium “The Galactic Halo: from globular Clusters to Field Stars”, ed. A. Noels, P. Magain, D. Caro, E. Jehin, G. Parmentier & A. A. Thoul, p. 619
Matteucci, F., Raiteri, C. M., Busso, M., Gallino, R., & Gratton, R. G. 1993, A&A, 272, 421
Meylan, G., Mayor, M., Duquennoy, A., & Dubath, P. 1995, A&A, 303, 761
Nemec, J. M., Linnell-Nemec, A. F., & Lutz, T. E. 1994, AJ, 108, 222
Nissen, P. E., & Schuster, W. J. 1997, A&A, 326, 751
Odenkirchen, M., brosche, P., Geffert, M., & Tucholke, H. J. 1997, New Astronomy, 2, 477
Paczyński, B. 1990, ApJ, 348, 485
Pancino, E., Ferraro, F. R., Bellazzini, M., Piotto, G., & Zoccali, M. 2000, ApJ, 534, 83
Pritzl, B., Smith, H., A., Catelan, M., & Sweigart, A. 2000, ApJ, 530, L41
Rey, S -C., Lee, Y. -W., Joo, J. -M., Walker, A., & Baird, S. 2000, AJ, 119, 1824
Smith, V. V., Suntzeff, N. B., Cuhna, K., Gallino, R., Busso, M., Lambert, D. L., & Straniero, O. 2000, AJ, 119, 1239
Sneden, C, Gratton, R. G., & Crocker, J. H. 1991, A&A, 246, 354
Travaglio, C., Galli, D., Gallino, R., Busso, M., Ferrini, F., & Straniero, O. 1999, ApJ, 521, 691
Tucholke, H. J. 1992, A&AS, 93, 293
Vanture, A. D., Wallerstein, G. & Brown, J. A. 1994, PASP, 106, 835