SF2A 2001
ISO’s view of SS 433 Jet Interactions with the Interstellar Medium
Abstract
SS 433 is a jet emitting X-ray binary surrounded by the W50 radio nebula. The SS 433 / W50 system is an excellent laboratory for studying relativistic jet interaction with the surrounding interstellar medium. In this context, part of the W50 nebula has been mapped with ISOCAM at 15 m. I will show the results particularly on the W50 west lobe, and on 2 emitting zones detected with IRAS who have also been observed in millimetre wavelength (CO(1-0) transition), and for one of them by spectroscopy with ISOLWS and ISOSWS between 2 and 200 m.
1 Introduction
SS 433 is an X-ray binary probably composed of a high-mass star and a neutron star, with a 13 days binary period. The system emits relativistic (0.26 c) jets showing a 162.5 days precession observed at subarcsecond scale in radio till cm from SS 433. At large scale these jets are observed in X-ray begining at (14 pc) from SS 433, and they are responsible for the unusual elongated shape of W50 (), the possible supernova remnant radio nebula around SS 433. We mapped at 15 m with ISOCAM222The ISOCAM data presented in this paper was analysed using ”CIA”, a joint development by the ESA Astrophysics Division and the ISOCAM Consortium. The ISOCAM Consortium is led by the ISOCAM PI, C. Cesarsky., the infrared camera on board of the Infrared Space Observatory (ISO), a small part of the eastern lobe where an X-ray knot lies, the north-east quarter of the central circular part of W50, and nearly all the western lobe.
2 Eastern lobe observations
There is no particular 15 m emission in the observed east parts of W50, and no correlation was found between the IR images and the corresponding ones in X-ray (with ROSAT and ASCA) and radio (at 20 cm), both for the central field and for the X-ray knot area. This is not surprising as the central part of W50 must have been swept away from its material by the supernova explosion, and the eastern lobe is described as faint in radio and less dense than the western one by Dubner et al. (1998). The X-ray knot, the brightest knot seen by ROSAT at 0.1–2.4 keV and called “e2” by Safi-Harb and Ögelman (1997), is coincident with an optical filament and is probably due to shocks with the supernova remnant (Safi-Harb and Petre 1999), but it is not visible at 15 m with ISOCAM sensitivity.
3 Western lobe observations
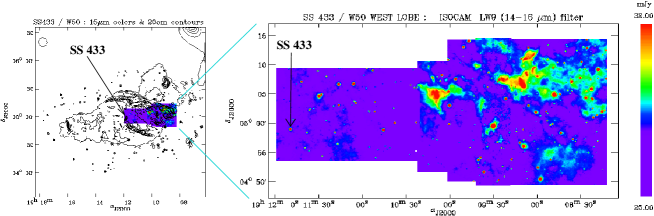
The western lobe map at 14–16 m (see Fig. 1) shows two
main emitting regions aligned with the relativistic jet direction
predicted by the kinematic model (Margon 1984 and references there
in) based on the radio compact jets observations, and seen at large
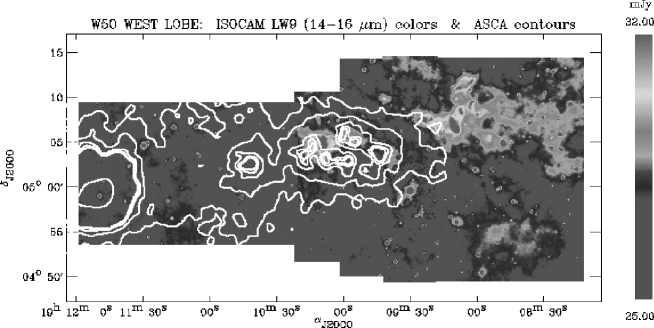
scale in X-ray (see Fig. 2). The western X-ray lobe was observed with ROSAT
(0.1–2.4 keV) by Brinkmann et al. (1996), and with ROSAT and ASCA
(0.5–9 keV) by Safi-Harb and Ögelman (1997) who could not
conclude if its emission is thermal or not. It is only partly
coincident with the nearest ISOCAM emission region from
SS 433 (see Fig. 2). Its soft X-ray emission fades and its hard X-ray one
disappears where the second emitting region begins. This farest IR
emitting region from SS 433 coincides with the radio
“ear” emission at the western edge of W50.
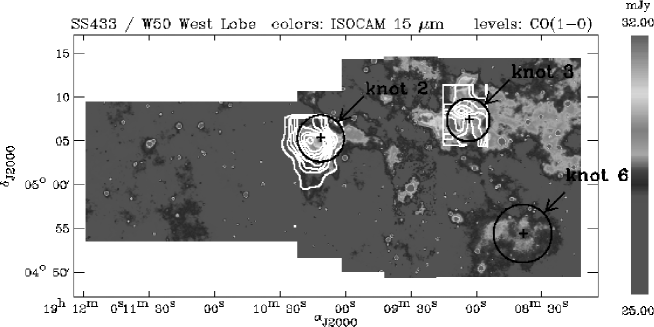
These two ISOCAM emitting regions correspond to IR knots observed
with IRAS at 12, 25, 60 and 100 m by Band (1987), and named
“knot 2” for the nearest region from SS 433 and “knot 3” for
the farest (see Fig. 3). The per pixel ISOCAM spatial
resolution enables to reveal their structure for the first
time. The 15 m knots emission is diffuse with punctual or not
“hot spots”.
No emission from the CO(1-0) transition line at 115 GHz is
observed between SS 433 and “knot 2”, as in IR at 15 m in
the ISOCAM image. Two CO(1-0) emitting regions are
coincident with the two IRAS knots as shown in Fig. 3 (data kindly
provided by Durouchoux, private communication). Their Doppler
velocity is km.s-1 which corresponds to the same
distance as W50. Their shapes are similar to the ISOCAM shapes, so the
IR and millimetre emissions are unlikely coincident by chance but
must be physically linked. So the observed ISOCAM emissions are due
to regions lying inside W50.
“Knot 3” was observed with ISOSWS and ISOLWS, respectively the
Short and Long-Wavelength Spectrometers on board of the ISO
satellite. SWS observation consists in several small
wavelength-range spectra between 2 and 40 m, which do not
reveal any emission lines when the flux is not under the detection
limit. The LWS continuum spectrum, between 40 and 200 m, is
consistent above 60 m with optically thin or optically thick
thermal emission from dust at K. Below 60 m, the
spectrum is flatter due to an additionnal component thermal or not.
Interpretation of the two knots emission is uncertain due to the
lack of observations in near and mid-infrared wavelengths where it could be
thermal or not. The oberved IR emission could be due to dust
regions heated by young stars still embedded in their molecular
birth clouds. These regions could be crossed by the relativistic
western jet, which then could heat the dust with collisions between
its energetic particles and the denser material of these
clouds. Otherwise, the mid-infrared emission could be of
synchrotron nature, coming from the very energetic particles of the
jet, reaccelerated by shocks with the western lobe denser
medium. These particles would lose their energy by synchrotron
radiation in X-ray, then in IR as they travel further from SS 433.
More multi-wavelength observations, are planed : in near-infrared in order to reveal shocked regions or young star regions, in millimetre in order to map the whole western lobe and to know the molecular clouds limits, in X-ray with XMM-Newton to distinguish between thermal and non thermal emission and thanks to the better spatial resolution to compare precisely the X-ray images with the other wavelengths ones. These new data will help to better understand the emission mecanisms from these large scale relativistic jets, and they could also help understanding extragalactic jets from AGN as there are larger scales replica.
References
- [1] Brinkmann W. et al. 1996, A&A, 312, 306.
- [2] Dubner, G.M. et al. 1998, ApJ, 116, 1842.
- [3] Band, D.L. 1987, PASP, 99, 1269.
- [4] Margon, B. 1984, ARAA 22, 507.
- [5] Safi-Harb, S. & Ögelman, H. 1997, ApJ, 483, 868.
- [6] Safi-Harb, S. & Petre, R. 1999, ApJ, 512, 784.