An Analysis of BeppoSAX LECS Observations of EUV Emission in Clusters of Galaxies
Abstract
Kaastra et al. (1999) have used the BeppoSAX LECS instrument to search for excess EUV emission in Abell 2199. They claim that the results obtained confirm an independent report of an excess EUV emission in this cluster (Lieu et al. 1999). Using an inflight derived procedure that is better suited to the analysis of extended sources and which avoids uncertainties related to ground-based calibrations for the overall detector sensitivity profile, we find no excess EUV emission in Abell 2199. We also used these procedures to search for an EUV excess in Abell 1795, but no excess was found.
Subject headings: galaxies: clusters: individual (Abell 1795, Abell 2199) — techniques: image processing — ultraviolet: general — X-rays: general
1 Introduction
The discovery of Extreme Ultraviolet (EUV) emission in clusters of galaxies with the Extreme Ultraviolet Explorer (EUVE) has provoked considerable controversy. While there is no doubt about the detection of the EUV emission in excess of that produced by the well-studied X-ray emitting cluster gas in Virgo (Berghöfer, Bowyer, & Korpela 2000a) and in Coma (Bowyer, Berghöfer, & Korpela 1999), many clusters do not exhibit an EUV excess at least at current sensitivity levels. In a series of publications (Bowyer, Berghöfer, & Korpela, 1999; Berghöfer, Bowyer, & Korpela 2000a,b; Bowyer, Korpela, & Berghöfer 2001) we have demonstrated that the EUVE results are strongly affected by the variation of the telescope sensitivity over the field of view and upon the details of the subtraction of the EUV emission from the X-ray contribution.
Kaastra et al. (1999) have analyzed BeppoSAX data obtained with the Low-Energy Concentrator Spectrometer (LECS) to search for EUV emission in the Abell 2199 cluster of galaxies. Unfortunately, the telescope sensitivity profile used in this work is likely to be incorrect. Quoting from their work, Kaastra et al. (1999) state, ”The vignetting correction for the LECS was derived from the SAXDAS/LEMAT ray-trace code, assuming azimuthal symmetry around the appropriate center. The correction for the support grid was also derived from that package.” We note that ground based simulations of the large scale sensitivity of EUV and X-ray instrumentation are extraordinarily difficult to construct and are notorious for being an inappropriate representation of the true sensitivity functions. In fact, a comparison of ground based calibration measurements with ray-tracing simulations for BeppoSAX clearly demonstrated a discrepancy by a factor of 1.5 at low energies (Parmar et al. 1997).
In order to test the claim of an EUV excess in Abell 2199 by Kaastra et al. (1999) we have reanalysed BeppoSAX LECS observations of this cluster of galaxies. We also searched for excess EUV emission in Abell 1795 using archival BeppoSAX data on this cluster. In Section 2 we describe the data and reduction applied to obtain the clusters’ EUV emission. Section 3 provides the results of our investigations, and a summary is presented in Section 4.
2 BeppoSAX LECS Data and Data Reduction
| Target | Exposure Date | Raw Exposure Time (s) |
|---|---|---|
| Abell 1795 | 29 Dec 1996 | 3528 |
| 12 Aug 1997 | 7832 | |
| 28 Jan 2000 | 38166 | |
| Abell 2199 | 23 Apr 1997 | 26860 |
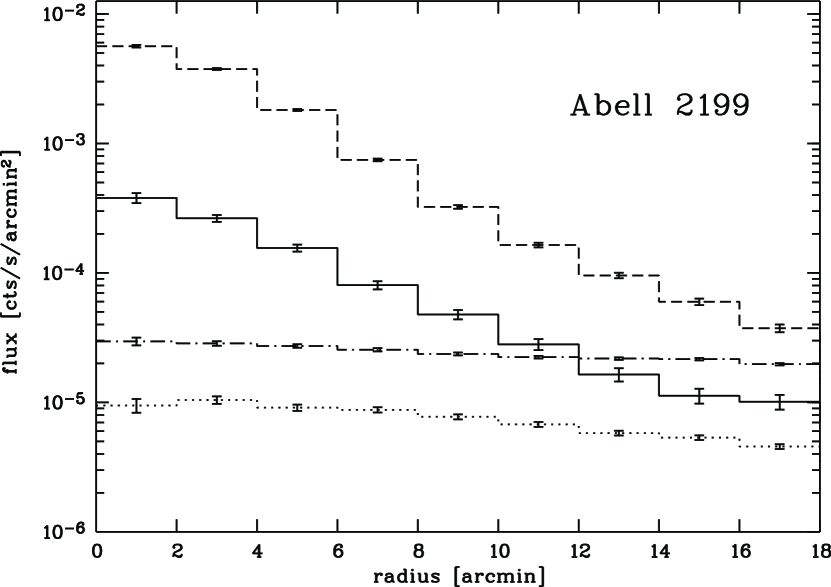
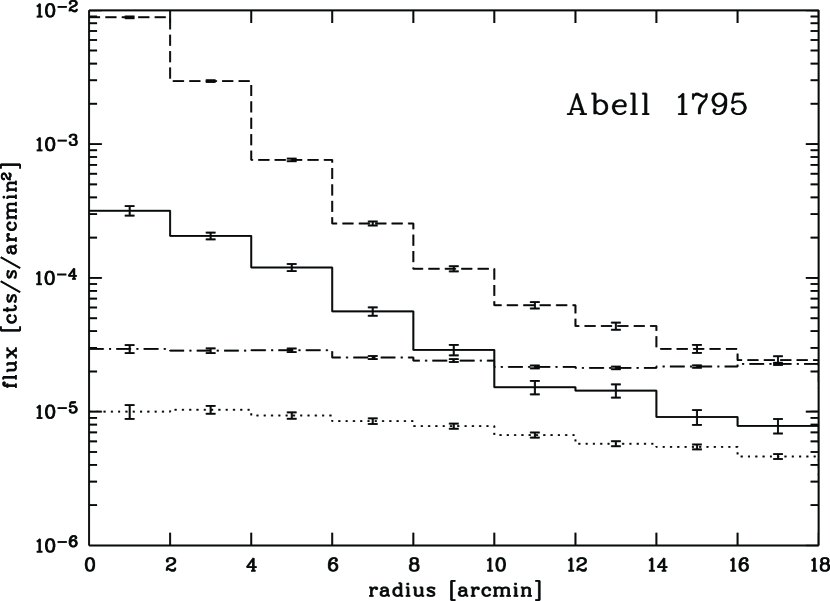
For our investigations we have employed BeppoSAX LECS archival data of the two clusters Abell 2199 and Abell 1795. Table 1 provides an observation log of the analysed data sets. The LECS instrument aboard of BeppoSAX is a gas scintillation proportional counter especially designed to perform low-energy X-ray spectroscopy. A detailed description of this detector can be found in Parmar et al. (1997). Here we summarize the performance of this detector relevant for the study of diffuse sources in the low energy regime. The LECS has at least some sensitivity in the energy range 0.1–10 keV. Its circular field of view with a radius of about 18′ is relatively small for cluster studies. At 3 keV the on-axis angular resolution is roughly 3′ (FWHM), which significantly drops to 9.7′ (FWHM) at 0.28 keV. At these low energies the resolution is dominated by the detector and is almost constant across the field of view. At low energies the LECS effective area peaks near 0.2 keV. For our investigations we have selected all events in the detector channels 10–30 (0.1–0.3 keV) and produced images of the clusters. The raw azimuthally averaged surface profiles of Abell 2199 and Abell 1795 and their statistical uncertainties are shown in Figures 1 and 2 (solid lines); in the case of Abell 1795 the plot is the combined profile of the three distinct LECS observations of this cluster.
In order to determine the contribution of the X-ray emitting cluster gas in the 0.1–0.3 keV band of the BeppoSAX LECS we also computed a radial surface brightness profile at detector channels 50–200 (0.5–2.2 keV). Events at higher energies have been ignored due to the substantial drop in effective area at energies E 2.5 keV and the increase in telescope vignetting at higher energies, which might affect the clusters’ X-ray profiles. In order to compensate for the substantially lower detector resolution at low energies, we convolved the source images in the 0.5–2.2 keV band with a 9.7′ wide Gaussian. The derived radial emission profiles of the two clusters in the 0.5-2.2 keV band and its statistical errors are shown as dashed lines in Figures 1 and 2.
For an appropriate background and sensitivity correction we obtained background files from the BeppoSAX data archive. In the case of the LECS detector the standard background data consist of an assemblage of blank field observations with a total integration of 568562.8 seconds. The dotted and dashed-dotted lines in Figures 1 and 2 provide the radial profiles obtained from the standard background data at the detector positions of Abell 2199 and Abell 1795, respectively, in the 0.1-0.3 keV and 0.5–2.2 keV band.
Using procedures similar to the background subtraction method developed for the EUVE Deep Survey instrument (cf. Bowyer, Berghöfer, & Korpela 1999), we adopted a two-parameter profile for the background. One profile is a flat background reflecting the time-dependent charged particle background. This has been determined from highly obscured regions at the outer most parts of the field of view. The count rates in units of cts s-1 arcmin2 are 3.5, 5.1, and 6.3, respectively, for the background field and the science exposures for Abell 2199 and Abell 1795. The other profile reflecting all sensitivity changes over the detector field and telescope vignetting has been constructed from the standard background field. We subtracted the appropriate flat background and convolved the data with a 9.7′ wide Gaussian corresponding to the instrument resolution; using the telescope point spread function from ground based calibration measurements instead of a Gaussian has no significant effect. Scaling factors of 4.4 and 3.9 have been applied to the derived sensitivity profile to subtract this part of the background from the science exposures of Abell 2199 and Abell 1795. Note that this part of the background is dominated by scattered solar X-ray radiation, which varies in time. Furthermore, the BeppoSAX observations used to construct the standard background data were taken at the beginning of the mission, whereas the cluster observations have been carried out closer to solar maximum. This explains the relatively large scaling factors. The given scaling factors and constant background rates result in the best representation of the background in the profiles. A large range of combinations of scaling factors and constant background rates were explored which were consistent with acceptable fits to the data, and even allowed for a possible contribution of an X-ray signal at larger radii. None of these variations changed our overall findings.
3 Results
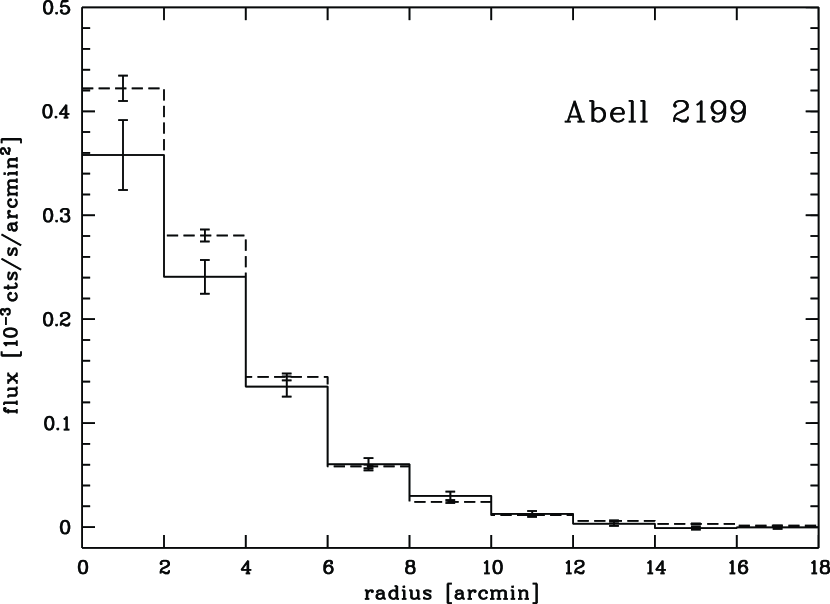
In Figure 3 we show the EUV emission in the Abell 2199 cluster of galaxies obtained from BeppoSAX LECS data using the correct sensitivity profile (solid line). The EUV emission produced by the diffuse X-ray emitting cluster gas is shown by a dashed line. To transform the 0.5–2.2 keV band profile to the 0.1–0.3 keV band we used XSPEC and the detector response matrix of the LECS to simulate conversion factors for these two energy bands of the BeppoSAX LECS. Adopting the set of parameters and models for the X-ray emitting plasma and the absorption by the intervening interstellar medium as described in Bowyer, Berghöfer, & Korpela (1999) we found conversion factors of 10.6 and 9.9, respectively, for the 4.08 keV and 2.9 keV gas components.
Figure 3 demonstrates that the BeppoSAX LECS does not detect an EUV excess in the cluster Abell 2199 when the data are analyzed correctly. We note that there is a deficit of EUV emission in the central core region (R 4′) of the cluster. However, with respect to the uncertainties in the cluster profiles, this is a small effect and may be a result of imperfect detector calibration. On the other hand, such deficits has been observed in other clusters of galaxies and have been attributed in the past to the effects of cooling flows; in light of current results from XMM-Newton and Chandra, this effect must now be ascribed to some other cause (e.g., Böhringer et al. 2001, Tamura et al. 2001).
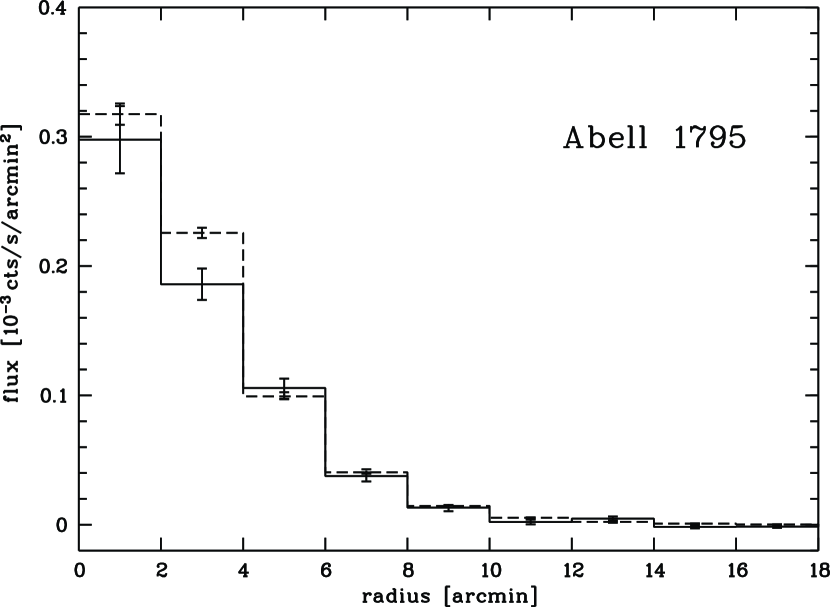
The BeppoSAX LECS results on Abell 1795 are shown in Figure 4. The solid line in this figure shows the background subtracted EUV emission profile of this cluster. The comparison with the expected contribution of the low energy tail of the X-ray emitting gas (dashed line in this figure) demonstrates that this cluster does not exhibit EUV excess emission at least at the BeppoSAX LECS level of sensitivity. Using appropriate model parameters for the X-ray emitting cluster gas and appropriate corrections for the interstellar absorption in the direction of Abell 1795 (see Bowyer, Bergöfer, & Korpela 1999), we applied conversion factors of 12.5 and 10.5, respectively, for the 6.7 keV and 2.9 keV gas components. Again, the cluster center shows a small deficit in EUV radiation in the 2–4′ radial bin when compared to the expected cluster X-ray emission in the 0.1–0.3 keV band.
4 Discussion and Conclusion
A search for excess EUV emission has been carried out in a substantial number of clusters observed with EUVE. Bowyer, Berghöfer & Korpela (1999) have shown that all but two of the reported detections were the product of the use of an incorrect detector sensitivity function. However, this conclusion has been questioned because Kaastra et al. (1999) claimed to have found an excess EUV emission in Abell 2199 using BeppoSAX LECS observations. These findings appeared to support the (incorrect) finding of an excess in this cluster using EUVE data. However, this result was based upon ground-based estimates of the LECS detector sensitivity function. Using a procedure better suited to the analysis of extended sources that avoids the known uncertainties in the telescope sensitivity function, we show that there is no excess in Abell 2199. We also searched for excess EUV emission in Abell 1795 using archival BeppoSAX observations. No EUV excess was found.
The results obtained here for Abell 2199 and Abell 1795 are fully consistent with the results obtained on these clusters using EUVE data (Bowyer, Berghöfer, & Korpela 1999). The only clusters of galaxies that have been found to exhibit an excess EUV emission are the Virgo and Coma clusters (Bowyer, Korpela, & Berghöfer 2001). It is possible that these are the only clusters that exhibit this effect, but it may be that both EUVE and BeppoSAX LECS are insufficiently sensitive to detect an EUV excess in other clusters of galaxies.
Since the only clusters with a confirmed EUV excess are Virgo and Coma, it is useful to reconsider candidates for the underlying source of the EUV excess. The original proposal was that this emission is thermal emission from a “warm” (106 K) gas (Lieu et al. 1996a,b; Bowyer et al. 1996). Claims of “proof” of this proposition have been advanced by Mittaz, Lieu, & Lockman (1998), Lieu, Bonamente, & Mittaz (1999a), Lieu et al. (1999b), Lieu, Bonamente, & Mittaz (2000), and Bonamente, Lieu, & Mittaz (2001a,b). Lieu et al. (2000) misinterpreted small scale detector structures in the EUVE data on Abell 2199 as cluster EUV emission absorbed by clumps of neutral hydrogen in the cluster. A difficulty with this interpretation which is independent of the data analysis problem is that the hydrogen required is ”… 43 times more massive than the hot ICM in this region … (and) … implies 3 times more missing baryons than expected”(op. cite).
The maintenance of a warm intracluster gas is quite difficult to understand since gas at this temperature is at the peak of its cooling curve and would cool in less than 0.5 Gyr, and on these grounds alone it was generally believed that a thermal source was untenable. Observational evidence relevant to this issue was obtained with the Hopkins Ultraviolet telescope (Dixon et al. 1996), and FUSE (Dixon et al. 2001a,b). No Far UV line emission from gas at 106 K was detected. More recently, observations of a large number of clusters with XMM have been carried out. Kaastra et al. (2001) found no gas at T 1 keV in Sersic 159-03, Peterson et al. (2001) found no gas at T 2.7 keV in Abell 1835, and Tamura et al. (2001) found no gas at T 4 keV in Abell 1795. All other clusters observed with XMM showed no evidence of a cooler EUV emitting gas (Steve Kahn, private communication). The sum of this evidence seems overwhelming: a thermal mechanism for the EUV excess can be ruled out.
Since the underlying source mechanism is not thermal, it must be the product of some non-thermal process. Inverse Compton scattering of cosmic rays with the 2.7 K background was suggested early-on as a possible source mechanism (Hwang 1997, Enßlin & Biermann 1998). Sarazin & Lieu (1998) suggested a model in which a population of cosmic rays produced several Gyr ago would have degraded over time and would now be unobservable as radio synchrotron emission even at very low frequencies. This population would produce an EUV flux by inverse Compton scattering. Sarazin & Lieu derived the ratio between the azimuthally averaged total EUV emission and the azimuthally averaged soft X-ray flux predicted by their model; this ratio increases with increasing distance from the center of the cluster. Berghöfer et al. (2000) derived this ratio for the Virgo cluster as a test of the Sarazin & Lieu model. They found this ratio was flat with increasing distance from the center of the cluster in contradiction to the prediction of the model.
Bowyer et al. (in progress) derived this ratio for the Coma cluster using data on the cluster that had been analyzed correctly. They found this ratio was flat with increasing distance from the center again contradicting the predictions of the Sarazin & Lieu model.
Despite the failure of the Sarazin & Lieu model, the inverse Compton mechanism remains as the only candidate for the source mechanism for the EUV excess. However, a new difficulty for this hypothesis has recently appeared. Virtually all models invoking the inverse Compton mechanism require the intracluster magnetic field to be 1G. However, recent results show that cluster magnetic fields are quite large. Clarke, Kronberg, & Böhringer (2001) studied 16 clusters with very high spatial resolution and have shown that all of these clusters have B fields of 4 to 7G. Unless this result is somehow incorrect, the vast majority of models proposed for the production of the EUV excess are incorrect. The only exceptions to the low field models (Enßlin, Lieu, & Biermann 1999; Atoyan & Völk 2000) are unlikely to be appropriate (Ming, Hwang, & Bowyer 2001).
It is not clear whether this is a fundamental obstacle for the inverse Compton scattering hypothesis or if it is simply a failure of existing models. Irrespective of how widespread the occurrence of EUV excess in clusters of galaxies may be, the underlying source mechanism for this emission remains a mystery.
References
- (1) Atoyan, A., & Völk, H. 2000, ApJ, 535, 45
- (2) Berghöfer, T., Bowyer, S., & Korpela, E. 2000a, ApJ, 535, 615
- (3) Berghöfer, T., Bowyer, S., & Korpela, E. 2000b, ApJ, 545, 695
- (4) Böhringer, H., Matsushita, K., Churazov, E., & et al. 2001, A&A, in press, astro-ph/011112
- (5) Bonamente, M., Lieu, R., & Mittaz, P. 2001a, ApJ, 546, 805
- (6) Bonamente, M., Lieu, R., & Mittaz, P. 2001b, ApJ, 547, L7
- (7) Bowyer, S., Lampton, M., & Lieu, R. 1996, Science, 274, 1338
- (8) Bowyer, S., Berghöfer, T., & Korpela, E. 1999, ApJ, 526, 592
- (9) Bowyer, S., Korpela, E., & Berghöfer, T. 2001, ApJ, 548, 135
- (10) Clarke, T. E., Kronberg, P. P., & Böhringer, H. 2001, ApJ, 547, 111
- (11) Dixon, W., Hurwitz, M., & Ferguson, H. C. 1996, ApJ, 469, L77
- (12) Dixon, W., Sallmen, S., Hurwitz, M., & Lieu, R. 2001a, ApJ, 550, L25
- (13) Dixon, W., Sallmen, S., Hurwitz, M. & Lieu, R. 2001b, ApJ, 552, L69
- (14) Enßlin, T. A., & Biermann, P. L. 1998, A&A330, 96
- (15) Enßlin, T. A., Lieu, R., & Biermann, P. L. 1998, A&A344, 409
- (16) Hwang, C.-Y. 1997, Science, 278, 1917
- (17) Lieu, R., Mittaz, J., Bowyer, S., Lockman, F., Hwang, C-Y., & Schmitt, J. H. M. M. 1996a, ApJ, 458, L5
- (18) Lieu, R., Mittaz, J., Bowyer, S., & et al. 1996b, Science, 274, 1335
- (19) Lieu, R., Bonamente, M., & Mittaz, J. P. D. 1999a, ApJ, 517, L91
- (20) Lieu, R., Bonamente, M., Mittaz, J. P. D., & et al. 1999b, ApJ, 527, L77
- (21) Lieu, R., Bonamente, M., & Mittaz, J. P. D. 2000, A&A, 364, 497
- (22) Kaastra, J., Lieu, R., Mittaz, J. P. D., & et al. 1999, ApJ, 519, 119
- (23) Kaastra, J., Ferrigno, C., Tamura, R., & et al. 2001, A&A, 365, L99
- (24) Parmar, A. N., Martin, D. D. E., Bavdaz, M., & et al. 1997, A&AS, 122, 309
- (25) Peterson, J. R., Paerels, F. B. S., Kaastra, J. S., & et al. 2001, A&A, 365, L104
- (26) Sarazin, C., & Lieu, R. 1998, ApJ, 494, 177
- (27) Tamura, T., Kaastra, J. S., Peterson, J. R. & et al. 2001, A&A, 365, L87