Search for Molecular Gas in the quasar SDSS 1044-0125 at z=5.73
Abstract
We report upper limits on CO J=2–1 and CO J=5–4 emission from the quasar SDSSp J104433.04-012502.2 at from observations made with the Berkeley-Illinois-Maryland-Association Array. Previously reported limits on CO J=6–5 emission (Iwata et al. 2001) were obtained at , which is now thought to be off by 1%, and the observations likely missed the relevant redshifts for molecular gas. The new upper limits on the line luminosities are K km s-1 pc2 and K km s-1 pc2, assuming 200 km s-1 linewidth. The CO J=5–4 observations place an upper limit on warm, dense molecular gas mass comparable to amounts derived for some other high redshift quasar systems from detections of this line. The limit on CO J=2–1 emission suggests that excitation bias does not affect this conclusion. In addition, no molecular gas rich companion galaxies are found in a Mpc field surrounding the quasar.
1 Introduction
The study of the star formation properties and gas content of galaxies at far cosmological distances is one important step toward understanding galaxy formation and evolution. The quasar SDSSp J104433.04-012502.2 at (hereafter SDSS 1044-0125), discovered by Fan et al. (2000) using the Sloan Digital Sky Survey, is among the highest redshift objects known. Recent observations of this quasar with SCUBA on the JCMT at 850 m detect thermal continuum emission (reported by Iwata et al. 2001), which suggests a large reservoir of dust and therefore also molecular gas. The presence of a substantial gas mass gains support from the apparent X-ray weakness of the quasar, which likely results from heavy intrinsic absorption (Brandt et al. 2001, Mathur 2001). Molecular gas has been detected from at least a dozen objects through CO lines at millimeter wavelengths, and these observations provide important clues to the formation history of galaxies and their relationship to supermassive black holes.
A recent search for CO J=6–5 emission from SDSS 1044-0125 by Iwata et al. (2001) reported an upper limit on the inferred molecular gas mass comparable to the detections for some high redshift quasars. Unfortunately, the search was centered at , the initial redshift estimated by Fan et al. (2000). Recent spectroscopic studies of SDSS 1044-0125 give a more accurate value of (Djorgovski et al. 2001, see also Goodrich et al. 2001), about 1% off from the initial estimate. Because of the narrow instantaneous bandwidth available to current millimeter interferometers, the revised redshift falls outside window that was searched for CO J=6–5 emission, and the observations likely missed the relevant redshifts for molecular gas in the quasar host. Since SDSS 1044-0125 has several properties in common with high redshift quasars where CO emission has been detected, (enumerated by Iwata et al. 2001), the revision of the optical redshift determination gives impetus to a new search for molecular gas.
A potentially important limitation of searching for emission from CO lines with high rotational quantum numbers, like the J=6–5 transition, is that prevailing physical conditions may be insufficiently extreme to excite these lines. The surprising detection of extended emission in the low excitation CO J=2–1 line towards the quasar APM 08279+5255 at (Papadopoulos et al. 2001) suggests that low excitation CO lines can reveal molecular mass reservoirs that are one or two orders of magnitude larger than suggested by observations of high excitation CO lines.
In this short paper, we present results of searches for CO J=2–1 and J=5–4 emission from SDSS 1044-0125 using the Berkeley-Illinois-Maryland Array (BIMA)111The BIMA array is operated by the Berkeley-Illinois-Maryland Association under funding from the National Science Foundation. (Welch et al. 1996) that provide new limits on the amount of molecular gas associated with this luminous high redshift quasar. The BIMA 1 cm band receiver system, which was developed primarily for observations of the Sunyaev-Zeldovich effect (Carlstrom, Joy & Grego 1996, Grego et al. 2000), provides a unique facility to search for highly redshifted low lying CO lines. For SDSS 1044-0125, the CO J=2–1 line is redshifted to 34 GHz, within the accessible tuning range. The standard digital correlator allows for several times larger velocity coverage than generally available at shorter wavelengths, sufficient to span the uncertainty in the quasar redshift determined from optical lines, as well as the typical kinematic offsets of molecular gas from the redshift derived optically. In addition, the small BIMA array antennas provide a large field of view, which enables imaging the quasar environs over Mpc scales at 34 GHz in a single pointing.
2 Observations
2.1 CO J=2–1 Line
Observations of the CO J=2–1 line (redshifted frequency GHz) were conducted in two parts, in September 2000 and September 2001. Both sets of observations used the 9 antennas of the BIMA array equipped with 1 cm band receivers. The pointing center was , . The 2000 observations, made with the correlator centered at the nominal redshift estimated by Fan et al. (2000), were obtained on 14 days, generally in short tracks of less than a few hours near source transit. The array antennas were in C configuration, giving resolution. The 2001 observations, made with the correlator centered at the revised redshift determined by Djorgovski et al. (2001), were obtained on 2 days in longer tracks. The array antennas were in B configuration, giving resolution. For both sets of observations, the hybrid correlator was configured with 8 individual windows, each with 32 channels spanning 100 MHz, in some cases overlapped to avoid gaps at the window edges. The system temperatures ranged from about 50 to 100 K (SSB). Short observations of the nearby calibrator J1058+015 were made every half hour to track the interferometer phase and also for bandpass calibration. The flux scale was determined through observations of Mars that were used to set (constant) a priori gains for the individual array antennas; the minimal amplitude drifts of the system at this low frequency suggest better than 10% accuracy.
All data calibration and imaging were performed using standard routines in the Miriad software package. The visibility data were imaged with both natural and system temperature weighting for maximum sensitivity. Since some frequencies were observed in both sets of observations, and some were observed in only one or the other, there are three regimes for the synthesized beam sizes and rms noise levels. The frequency coverage and parameters of the resulting images are as follows, where the rms is quoted for a 200 km s-1 velocity bin ( channels), a resolution appropriate for the linewidths of galactic potentials: (1) 33.82 to 34.23 GHz observed in both 2000 and 2001, beam p.a. 3∘, rms 0.86 mJy, (2) 33.48 to 33.82 GHz observed in 2000 only, beam p.a. 7∘, rms 1.00 mJy, and (3) 34.23 to 34.55 GHz observed in 2001 only, beam p.a. -15∘, rms 1.67 mJy. Note that the best sensitivity was achieved for the velocity range redshifted by up to a few thousand km s-1 from the (accurate) optical redshift– the range most likely to contain CO emission. The typical kinematic offset of molecular emission in high redshift quasar hosts from optical lines is km s-1, with the largest known offset about km s-1 (in APM 08279+5255, Downes et al. 1999).
2.2 CO J=5–4 Line
Observations of the CO J=5–4 line (redshifted frequency GHz) were conducted on two days in October 2001. These observations used 10 antennas in D configuration, giving resolution. As for the September 2001 observations with the 1 cm receiver system, the correlator was configured to span nearly 800 MHz centered near the revised redshift of . The system temperatures ranged from 150 to 600 K (SSB). Frequent observations of the nearby calibrator J1058+015 were used to track amplitude and phase, and bandpass calibration was checked with short observations of the strong source 3C273. The flux density scale was derived from observations of Mars and should be accurate to 20%. The frequency coverage and parameters of the resulting images are: 85.22 to 85.92 GHz, beam p.a. 20∘, rms 3.0 mJy, for 200 km s-1 resolution.
3 Results and Discussion
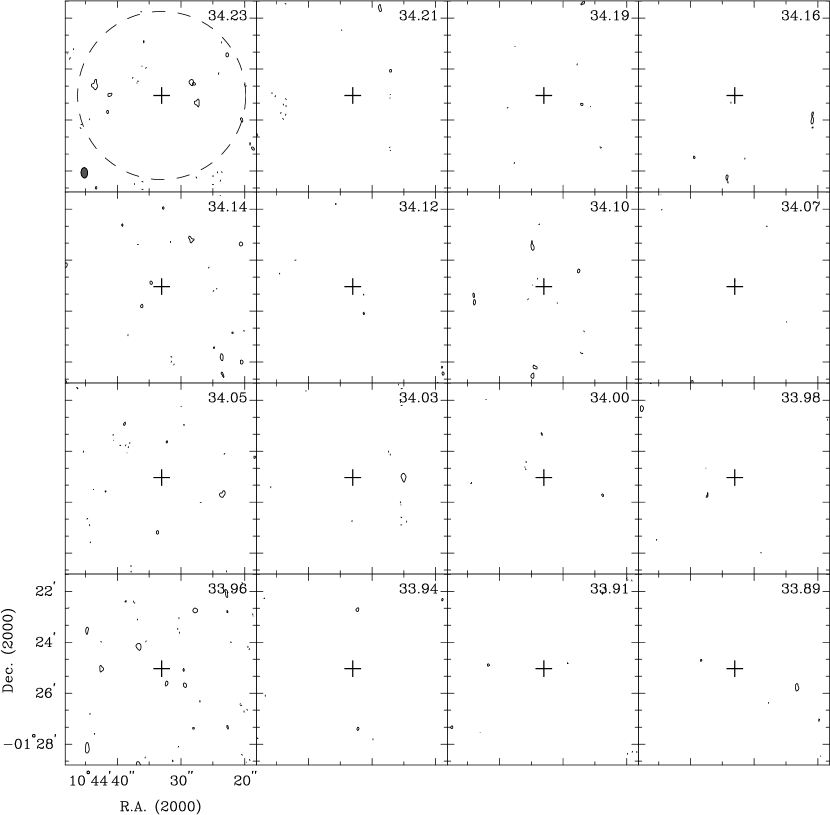
Figure 1 shows the CO J=2–1 and CO J=5–4 spectra obtained at quasar position. The velocity binnings for the two lines are 200 and 162 km s-1, respectively. The noise in the CO J=2–1 spectrum is not uniform, and empirical error bars derived from the rms noise measured from the images are shown for each velocity bin. There are some tantalizing hints of signal in adjacent channels close to the expected velocities, but features with similar (low) significance are present elsewhere in the data, and we do not consider any of these features to be reliable line detections. Figure 2 shows a series of maps with 200 km s-1 width that span the full half power field of view () for the J=2–1 line. Various attempts at smoothing in both space and frequency did not uncover any significant CO emission in either of the observed transitions.
Two mechanisms have been suggested for heating large masses of dust and gas in high redshift quasar systems: (1) high energy photons emitted from gases accreted onto a massive black hole and (2) bursts of star formation. If the dust is heated by the activity of a massive black hole, then bright emission may be expected from high excitation CO lines in a compact region close to the exciting source, from large amounts of warm, dense gas involved in fueling and accretion. The CO J=5–4 line, whose upper energy level lies 88 K above the ground state, requires warm gas () at high densities ( cm-3) to be populated significantly by H2 collisions. Consequently, the upper limits on CO emission from the J=5–4 line constrains primarily the amount of molecular gas with these conditions close to the massive black hole or other powerful heating sources. On the other hand, such extreme physical conditions are not necessarily appropriate for starbursts, which are likely to be distributed over larger spatial scales and involve cooler, more diffuse molecular gas. If the dust is heated by primarily by star formation, then emission in CO J=2–1 line may be a more appropriate tracer of molecular gas content, given that the upper energy level lies just 16 K above ground and the excitation requirements are significantly less stringent.
Following Solomon, Downes & Radford (1992), we calculate upper limits to CO line luminosities with the expression
| (1) |
where is the limit on the velocity integrated line flux in Jy km s-1, is the observing frequency in GHz, and is the luminosity distance in Mpc. The choice of cosmological parameters enters in , and we adopt km s-1, and for consistency with most work in this field. (An alternative cosmology with km s-1, and results in larger by a factor of 1.54 for this redshift.) The effective linewidth is not known, but it likely falls in the range 150 to 550 km s-1 found for a large sample of ultraluminous galaxies in the local universe (Solomon et al. 1997). For the flux limit obtained in the more sensitive part of the CO J=2–1 spectrum, assuming a linewidth of 200 km s-1, K km s-1 pc2. For the flux limit obtained for CO J=5–4, again assuming a linewidth of 200 km s-1, K km s-1 pc2. If the assumed linewidth were two times larger, then these luminosity limits would be times higher.
Conversion of these CO luminosity limits to molecular gas mass limits is fraught with uncertainties. But a simple conversion factor from CO luminosity to H2 mass is commonly taken to be (K km s-1 pc2)-1, the value determined for Milky Way molecular clouds (Sanders, Scoville & Soifer 1991). There is evidence from comparisons of luminosity based mass estimates with dynamical mass estimates that the conversion factor may be perhaps five times lower in ultraluminous objects (Downes & Solomon 1998). Additional corrections of order unity are also needed to account properly for excitation from the elevated cosmic background radiation at high redshift. Adopting the Galactic conversion factor for CO J=2–1 line luminosity gives a limit on the cold or diffuse molecular gas mass of in the SDSS 1044-0125 system. Using the same conversion factor for the CO J=5–4 line luminosity gives a limit on the warm and dense molecular gas mass of of in the SDSS 1044-0125 system.
These mass limits are comparable to the mass indicated from the detection of CO J=5–4 emission from some quasars, including at least two thought not to be amplified by gravitational lensing. In particular, observations of CO J=5–4 emission from BR1202-0725 at (Omont al. 1996, Ohta et al. 1996) and BRI1335-0417 at (Guilloteau et al. 1997) indicate molecular gas masses in excess of M⊙ (adjusted for the cosmology and CO to H2 conversion factor adopted here). There is no clear physical argument to explain why some quasar environments show CO emission at this sensitivity level while others do not (Guilloteau et al. 1999). In any case, the CO J=2–1 and J=5–4 luminosity limits suggest that the environment of SDSS 1044-0125 does not possess an enormous mass reservoir of either low excitation or high excitation molecular gas.
The CO J=2–1 limit is comparable to the amount of molecular gas detected toward the lensed quasar APM 08279+5255, where Papadopoulos et al. (2001) found several CO J=2–1 emission features with total luminosity K km s-1 pc2 attributed to (unlensed) molecular gas rich companion galaxies to the quasar host. For the SDSS 1044-0125 observations, such features would have been contained within one synthesized beam (together with any nuclear emission). The luminosity limit suggests that no comparable population of nearby massive companions is present. Moreover, no significant CO J=2–1 emission features are found within the entire field of view that spans Mpc, which suggests that such massive cold molecular gas concentrations are rare. Observations of SDSS 1044-0125 with better sensitivity are needed to explore whether smaller but still significant concentrations of low excitation molecular gas are present in the environment of this high redshift quasar.
References
- (1)
- (2) Brandt, W.N., Guainazzi, M., Kaspi, S., Fan, X., Schneider, D.P., Strauss, M.A., Clavel, J., Gunn, J.E. 2001, AJ, 121, 591
- (3)
- (4) Carlsrom, J.E., Joy M. & Grego, L. 1996, ApJ, 461, L59
- (5)
- (6) Djorgovski, S.G., Castro, S., Stern, D. & Mahabal, A.A. 2001, ApJ, 560, L5
- (7)
- (8) Downes, D., Neri, R., Wiklund, T., Wilner, D.J., Shaver, P. 1999, ApJ, 513, L1
- (9)
- (10) Downes, D. & Solomon, P.M. 1998, ApJ, 507, 615
- (11)
- (12) Fan, X. et al. 2000, AJ, 120, 1167
- (13)
- (14) Grego, L., Carlstrom, J.E., Joy, M.K., Reese, E.D., Holder, G.P., Patel, S., Cooray, A.R., Holzapfel, W.L. 2000, ApJ, 539, 39
- (15)
- (16) Goodrich, R.W., Campbell, R., Chaffee, F.H., Hill, G.M., Sprayberry, D., Brandt, W.N., Schneider, D.P., Kaspi, S., Fan, X., Gunn, J.E., Strauss, M.A. 2001, ApJ, in press (astro-ph/0109464)
- (17)
- (18) Guilloteau, S., Omont, A., McMahon, R.G., Cox, P., Petitjean, P. 1997, A&A, 328, L1
- (19)
- (20) Guilloteau, S., Omont, A., Cox, P., McMahon, R.G., Petitjean, P. 1999, A&A, 349, 363
- (21)
- (22) Iwata, I., Ohta, K., Nakanishi, K., Kohno, K., McMahon, R. 2001, PASJ, in press (astro-ph/0107369)
- (23)
- (24) Mathur, S. 2001, ApJ, 122, 1688
- (25)
- (26) Ohta, K., Yamada, T., Nakanishi, K., Kohno, K., Akiyama, M., Kawabe R., 1996, Nature 382, 426
- (27)
- (28) Omont, A., Petitjean, P., Guilloteau, S., McMahon, R.G., Solomon, P.M., Pecontal, E. 1996, Nature, 382, 428
- (29)
- (30) Papadopoulos, P., Ivison, R., Carilli, C., Lewis, G. 2001, Nature, 409, 58
- (31)
- (32) Sanders, D.B., Scoville, N.Z. & Soifer, B. T. 1991, ApJ, 370, 158
- (33)
- (34) Solomon, P.M., Downes, D. & Radford, S.J.E. 1992, ApJ, 398, L29
- (35)
- (36) Solomon, P.M., Downes, D., Radford, S.J.E. & Barrett, J.W. 1997, ApJ, 478, 144
- (37)
- (38) Welch, W. J., Thornton, D. D., Plambeck, R.L., Wright, M.C.H., Lugten, J., Urry, L., Fleming, M., Hoffman, W., Hudson, J., Lum, W.T., Forster, J.R., Thatte, N., Zhang, X., Zivanovic, S., Snyder, L., Crutcher, R., Lo, K.Y., Wakker, B., Stupar, M., Sault, R., Miao, Y., Rao, R., Wan, K., Dickel, H., R., Blitz, L., Vogel, S.N., Mundy, L., Erickson, W., Teuben, P.J., Morgan, J., Helfer, T., Looney, L., de Gues, E., Grossman, A., Howe, J.E., Pound, M., Regan, R. 1996, PASP, 108, 93
- (39)