Exploring the intergalactic medium with VLT/UVES 11institutetext: ST European Coordinating Facility, K.-Schwarzschild-Str. 2, D-85748 Garching 22institutetext: Osservatorio Astronomico di Trieste, via Tiepolo 11, I-34131 Trieste 33institutetext: European Southern Observatory, K.-Schwarzschild-Str. 2, D-85748 Garching
Exploring the intergalactic medium with VLT/UVES
Abstract
The remarkable efficiency of the UVES spectrograph at the VLT has made it possible to push high-resolution, high-S/N ground observations of the Ly- forest down to , gaining new insight into the physical conditions of the intergalactic medium and its evolution over more than 90% of the cosmic time. The universal expansion, the UV ionizing background and the gravitational condensation of structures are the driving factors shaping the number density and the column density distribution of the absorbers. A (limited) contribution of UV photons produced by galaxies is found to be important to reproduce the observed evolutionary pattern at very high and low redshift. The Lyman forest contains most of the baryons, at least at , and acts as a reservoir for galaxy formation. The typical Doppler parameter at a fixed column density is measured to slightly increase with decreasing redshift, but the inferred temperature at the mean density is increasing with redshift. The signatures of HeII reionization and feedback from the formation of galactic structures have possibly been detected in the Lyman forest.
1 The Observations
A sample of 8 QSOs with has been observed kim01 ; kim02 with VLT/UVES at a typical resolution and S/N . Thanks to the two-arm design of the spectrograph UVES , a high efficiency has been achieved in the whole optical range, from the atmospheric cutoff to , which translates immediately in the possibility of obtaining new results on the Lyman forest, especially at . The data have been reduced with the UVES pipeline UVESpip - an non-negligible factor in maximizing the scientific output per unit time - and analyzed with the VPFIT package VPFIT .
2 The number density and column density evolution of Ly- lines
The swift increase of the number of absorptions (and the average opacity) with increasing redshift is the most impressive property of the Ly- forest. Fig. 1 shows the number density evolution of the Ly- lines kim01 ; kim02 in the column density interval 111This range in has been chosen to allow a comparison with the HST Key-Programme sample at weymann98 for which a threshold in equivalent width of 0.24 Å was adopted. . The maximum-likelihood fit to the data at with the customary power-law parameterization provides . The UVES observations imply that the turn-off in the evolution does occur at , not at as previously suggested.

While the opacity is varying so fast, the column density distribution stays almost unchanged. The differential density distribution function measured by UVES kim01 ; kim02 , that is the number of lines per unit redshift path and per unit as a function of , basically follows a power-law extending over 10 orders of magnitude with little, but significant deviations: the slope of the power-law in the range goes from about at to at . Recent HST STIS data dave01 confirm that this trend continues at lower redshift, measuring a of at .
3 The evolution of the Ly- forest and the ionizing background
The evolution of the is governed by two main factors: the Hubble expansion and the metagalactic UV background (UVB). At high both the expansion, which decreases the density and tends to increase the ionization, and the UVB, which is increasing or non-decreasing with decreasing redshift, work in the same direction and cause a steep evolution of the number of lines. At low , the UVB starts to decrease with decreasing redshift, due to the reduced number and intensity of the ionizing sources, counteracting the Hubble expansion. As a result the evolution of the number of lines slows down.
Up to date numerical simulations theuns98 have been remarkably successful in qualitatively reproducing the observed evolution, however they predict the break in the power-law at a redshift that appears too high in the light of the new UVES results. This suggests that the UVB implemented in the simulations may not be the correct one: it was thought that at low redshift QSOs are the main source of ionizing photons, and, since their space density drops below , so does the UVB. However, galaxies can produce a conspicuous ionizing flux too, possibly more significant than it was thoughtsteidel01 . The galaxy contribution can keep the UVB relatively high until at the global star formation rate in the Universe quickly decreases, determining the qualitative change in the number density of lines.
Under relatively general assumptions, it is possible to relate the observed number of lines above a given threshold in column density or equivalent width to the expansion, the UVB, the distribution in column density of the absorbers and the cosmology dave99 :
| (1) |
where is the photoionization rate and the power-law index of the distribution.
To estimate we have investigated the contribution of galaxies to the UVBbianchi01 , exploring three values for the fraction of ionizing photons that can escape the galaxy interstellar medium, and (the latter value corresponds to the Lyman-continuum flux detected by steidel01 in the composite spectrum of 29 Lyman-break galaxies). Measurements of the UVB based on the proximity effect at high- and on the emission in high-latitude galactic clouds at low- provide an upper limit on , consistent with recent results on individual galaxies both at low- deharveng01 ; heckman01 and at giallongo01 . Introducing a contribution of galaxies to the UVB, the break in the Ly- can be better reproduced than with a pure QSO contribution bianchi01 . The agreement improves considerably also at . Besides, models with describe the flat evolution of the absorbers much better than .
A consistency check is provided by the evolution of the lower column density lines. For the distribution follows a flatter slope , and according to Eq. 1 this translates directly into a slower evolutionary rate, which is consistent with the UVES observationskim01 : dN/dz. Another diagnostic can be derived from the spectral shape of the UVB and its influence on the intensity ratios of metal lines savaglio97 ; songaila98 .
4 Mapping the column density distribution into the mass distribution of the gas
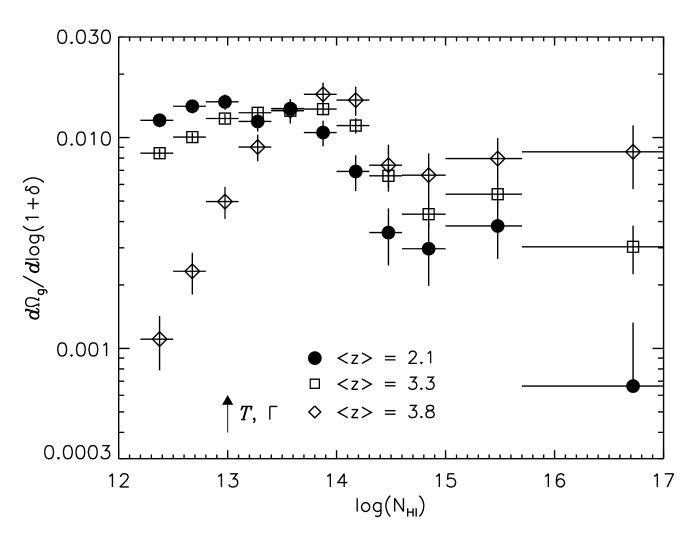
It is instructive to transform the observed column density distribution in the mass distribution of the photoionized gas (Fig. 2) and interpret it, following Schayeschaye01 , as a function of the matter density contrast: 1) the flattening at is partly due to line crowding and partly to the turnover of the density distribution below the mean density; 2) the steepening at , with a deficiency of lines that becomes more and more evident at lower z, reflects the fall-off in the density distribution due to the onset of rapid, non-linear collapse 3) the flattening at can be attributed to the flattening of the density distribution at density contrast due to the virialization of collapsed matter. The differential mass density distribution has a sort of universal form when plotted as a function of the density contrast. A given density contrast, however, corresponds to lower and lower column densities with decreasing redshift, and this causes a translation of the mass density distribution (Fig. 2) towards the left with decreasing redshift, which explains the steepening of the slope reported in Sect.2. Hydrodynamical simulations successfully reproduce this behaviour, indicating that the derived matter distribution is indeed consistent with what would be expected from gravitational instability.
5 The cosmic baryon density
The amount of baryons required in a given cosmological scenario to produce the observed opacity of the Lyman forest can be computed weinberg97 under general assumptions. A lower-bound to the cosmic baryon density can be derived from the mean Ly- flux decrement, ,oke82 and/or from the distribution of the Ly- optical depths. The limits derived from the effective optical depths measured in the UVES spectra at are reported in Tab. 1. They are consistent with the BBN value for a low D/H primordial abundance. Most of the baryons reside in the Lyman forest at with little change in the contribution to as a function of . Conversely, given the observed opacity, a higher UVB requires a higher . As pointed out by haehnelt01 , an escape fraction as large as 0.4, as measured by steidel01 , would result in an in conflict either with the primordial D/H abundance or in general with the BBN or with the Ly- opacity measurements.
| UVB | K | K |
|---|---|---|
| QSOs | 0.017 | 0.011 |
| QSOs + GALs | 0.028 | 0.018 |
| () |
6 The temperature of the IGM
If the Ly- forest is in thermal equilibrium with the metagalactic UV background, the line width of the absorption lines, described by the parameter of the Voigt profile, is directly related to the gas temperature of the absorbing medium determined by the balance between adiabatic cooling and photo-heating: . Additional sources of broadening exist, such as the differential Hubble flow across the absorbers, peculiar motions, Jeans smoothing. However, there is a lower limit to the line widths, set by the temperature of the gas, that is in principle measurable. In practice the situation is slightly more complex because for a photoionized gas there is a temperature-density relation, the so-called equation of state: , where is the gas temperature, is the gas temperature at the mean gas density, is the baryon over-density, and is a constant which depends on the ionization history. The equation of state translates into a lower cutoff in the – distribution.
The observed cut-off Doppler parameter at a fixed column density of , is measured to increase with decreasing redshift, while the slope of the cutoff does not change significantly. A typical value of 18 km s-1 at corresponds to a reference temperature of K. This does not mean that the temperature of the IGM increases with decreasing : on the contrary, taking into account the equation of state and the fact that a given column density corresponds to higher and higher over-densities with decreasing redshift, it turns out that the temperature at the mean density is actually decreasing with decreasing . Furthermore, evidence has been found theuns02 for a general increase of the temperature around the redshift , attributed to the reionization of HeII. Temperature and ionization fluctuations are also expected due to feedback processes from the formation of galactic structures theuns01 and might have been observed in correspondence of some voids in the Ly- forest kim01 .
References
- (1) Ballester P., Modigliani A., Boitquin O., Cristiani S., Hanuschik R., Kaufer A., Wolf S., 2000 ESO Mess. 101, 31
- (2) Bianchi S., Cristiani S., Kim. T.-S., 2001, A&A 376, 1
-
(3)
Carswell R.F., Webb J.K., Cooke A.J., Irwin M.J.,
http://www.ast.cam.ac.uk/ rfc/vpfit.html - (4) D’Odorico S., Cristiani S., Dekker H., Hill V., Kaufer A., Kim T.-S., Primas F., 2000, SPIE 4005, 121
- (5) Davé R., Hernquist L., Katz N., Weinberg D., 1999, ApJ 511, 521
- (6) Davé R., Tripp T.M., 2001, ApJ 553, 528
- (7) Deharveng J.-M., Buat V., Le Brun V., et al., 2001, A&A 375, 805
- (8) Giallongo E., Cristiani S., Fontana A., D’Odorico S., 2001, in preparation
- (9) Haehnelt M.G., Madau P., Kudritzki R., Haardt F., 2001, ApJ 549, L151
- (10) Heckman T.M., Sembach K.R., Meurer G.R. et al., 2001, ApJ 558, 81
- (11) Kim T.-S., Cristiani S., D’Odorico S., 2001, A&A 373, 757
- (12) Kim T.-S., Carswell R.F., Cristiani S., D’Odorico S., Giallongo E., 2001, MNRAS submitted
- (13) Oke J. B., Korcyansky D.G., 1982, ApJ 255, 11
- (14) Savaglio S., Cristiani S., D’Odorico S. et al., 1997, A&A 318, 347
- (15) Schaye J., astro-ph/0104272
- (16) Songaila A., 1998, AJ 115, 2184
- (17) Steidel C.C., Pettini M., Adelberger K.L., 2001, ApJ 546, 665
- (18) Theuns T., Leonard A., Efstathiou G., 1998, MNRAS 297, L49
- (19) Theuns T., Mo H. J., Schaye J., 2001, MNRAS, 321, 450
- (20) Theuns T., Zaroubi S., Kim T.-S., et al. astro-ph/0110600
- (21) Weinberg D.H., Miralda-Escudé J., Hernquist L., Katz N., 1997, ApJ 490, 564
- (22) Weymann R.J., Jannuzi B.T., Lu L. et al., 1998, ApJ 506, 1