Michigan State University, East Lansing, MI, USA Niels Bohr Institute and Theoretical Astrophysics Center, Copenhagen, DK
Solar Convection and Magneto-Convection Simulations
Abstract
Magneto-convection simulations with two scenarios have been performed: In one, horizontal magnetic field is advected into the computational domain by fluid entering at the bottom. In the other, an initially uniform vertical magnetic field is imposed on a snapshot of non-magnetic convection and allowed to evolve. In both cases, the field is swept into the intergranular lanes and the boundaries of the underlying mesogranules. The largest field concentrations at the surface reach pressure balance with the surrounding gas. They suppress both horizontal and vertical flows, which reduces the heat transport. They cool, become evacuated and their optical depth unity surface is depressed by several hundred kilometers. Micropores form, typically where a small granule disappears and surrounding flux tubes squeeze into its previous location.
We have been making realistic simulations of meso-granule scale convection near the solar surface. We begin with a summary of three basic properties of stratified convection. Next, we discuss our magneto-convection results. Finally, we present results on micropore structure and formation.
1 Convection: Basic Properties
First, convection is driven from a very thin surface thermal boundary layer where radiation cools the fluid and produces the low entropy fluid which is pulled down by gravity and forms the cores of the cool downdrafts where most of the buoyancy work that drives the convection occurs.
Second, convective flow is controlled by mass conservation. Fluid moving toward the surface in a stratified atmosphere, where density decreases upward, has to turn over and head back down in a distance the order of a scale height. Therefore upflows are diverging and fairly laminar, while downflows are converging and turbulent. As a result, only a small fraction of fluid at depth reaches the surface and there is little recycling of downflows into upflows. The horizontal scale of the upflows decreases toward the surface as the scale height decreases in proportion to the temperature.
Third, near the surface of the Sun hydrogen is partially ionized and most of the energy is transported as ionization energy which gets dumped at the surface when hydrogen becomes neutral. The downward kinetic energy flux is of order 10-15% of the enthalpy flux. The radiative flux is negligible below the surface. (In simulations with a large radiative flux in the interior. the temperature fluctuations are reduced and therefore larger velocities are required to carry a given flux. In such calculations there is a large downward kinetic energy flux.)
Detailed results and comparisons with observations are given in Stein and Nordlund (1998, 2000).
Figure 2: Image of vertical velocity with magnetic field contours. Magnetic field is confined to the intergranular downflow lanes, but does not entirely fill them. The domain is 12 12 Mm 3 Mm deep. Figure 3: Image of vertical velocity at depth 2.5 Mm with contours the surface magnetic field. The magnetic field collects in the mesogranular boundary downflows.
Figure 4: 3D image of magnetic field. Magnetic flux tubes have a filamentary structure. Figure 5: The surface magnetic field has an exponential distribution for the case of a horizontal field advected in from the bottom, and it has a long tail with a bump near the value for pressure equilibrium with its surroundings for the case of a uniform vertical field.
2 Magneto-Convection
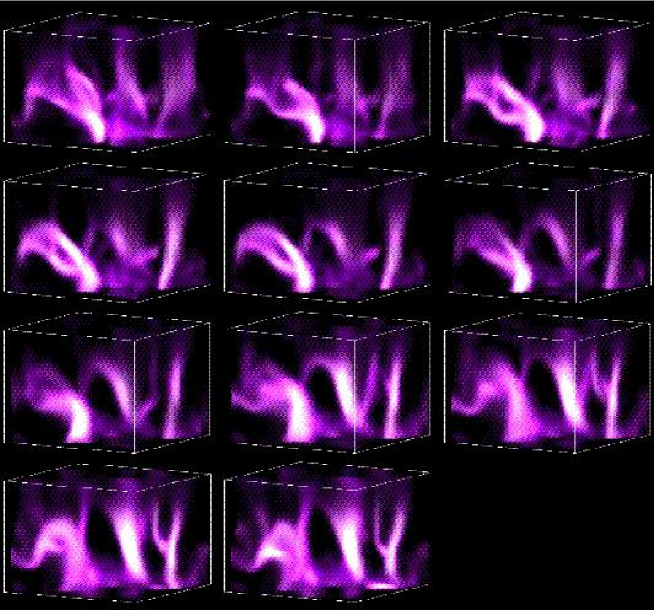
One of magneto-convection simulation looked at the emergence of magnetic flux through the solar surface. Horizontal magnetic field was advected into the computational domain by the fluid flowing in through the bottom boundary. The magnetic flux rises to the surface from a depth of 2.6 Mm in about one hour. A time sequence of images of the magnetic intensity is shown in Fig. 1 (view across then down). A flux loop emerges through the surface and then opens out (snapshots 5-11 center) and another loop opens up for a while and then closes in on itself and is pulled back down again below the surface (snapshots 8-11 left).
Another of magneto-convection simulation was started from a snapshot of the non-magnetic convection, on which we superimposed a uniform vertical field of 400G and let it evolve. (This is high even for a plage region, but we wanted enough flux to form pores.) As one would expect, the magnetic field gets swept into the intergranular lanes, and tends to concentrate above the boundary of the underlying mesogranule cells near the bottom of the domain (Figures 3 and 3). Even with this large an average field, the magnetic flux does not fill all the intergranular lanes. The magnetic flux tubes suppress both the vertical and horizontal fluid flow. As a result, the convective heat transport is suppressed and the flux tubes become cool and dark. They therefore become evacuated. Both because of their lower temperature and lower density, their optical depth unity surface gets depressed by several hundred kilometers. Above the surface the field spreads out because is smaller than one. Below the surface, the magnetic field is filamentary. A strong flux concentration at the surface separates into several individual flux tubes below the surface (Fig. 5).
The magnetic field at the surface has an exponential distribution for the case where horizontal field is advected into the domain from below (Fig. 5). For the case of an initial uniform vertical field, there is a very small exponential component and a large one sided tail with a peak at 1.7 kG, near the value for pressure equilibrium with its surroundings.
Figure 6: Left: Temperature (dark) and magnetic field (grey) contours in bright point (left) and micropore (right). Temperature is lower in the bright point and micropore. Heavy line is optical depth unity, which is depressed in the both the bright point and micropore. The level cuts the bright point at a higher temperature than the surroundings and cuts the micropore at a lower temperature than the surroundings. Right: Velocity vectors and magnetic field contours in bright point (left) and micropore (right). The flow is suppressed in the micropore, but not in the bright point.
3 Micropores
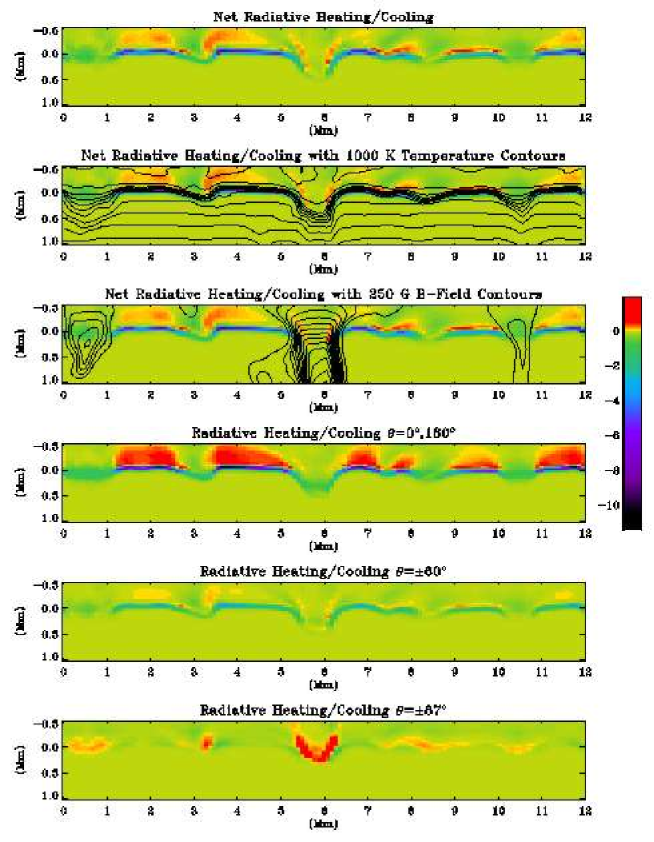
Micropores form in the simulation at the vertices of the intergranular lanes. They evolve on a granulation time scale, with only a few lasting several granule turnover times. Micropores form in strong magnetic field concentrations where both the optical depth unity surface and the temperature contours get depressed (Fig. 6). In a micropore the optical depth unity surface cuts the temperature contours at a lower temperature than the surroundings, which is why they look dark. The whole structure is depressed because it is cool, has a smaller scale height, and so becomes partially evacuated. Where the field concentration is small, in a downdraft, the velocity is still strong. But in the micropores the flow is confined to its edge (Fig. 6). In the center of the micropore where the field is strongest the velocity is severely suppressed, and therefore the convective energy transport is severely suppressed. The micropores are cooled by radiation in the vertical direction and heated by radiation from their hot sidewalls (Fig. 7). The vertical cooling is nearly balanced by the horizontal heating and the micropore structure is fairly stable.
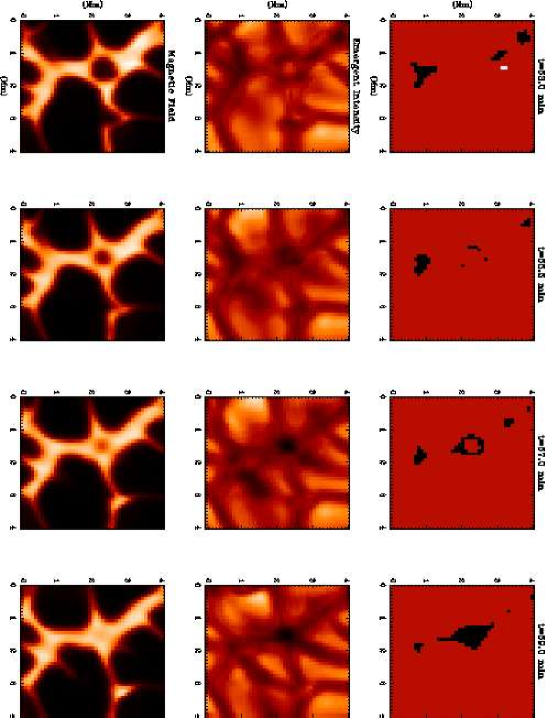
Micropores tend to form where a tiny granule disappears. The magnetic field initially consists of several flux tubes in a ring around the vanishing granule. When the granule disappears, the area becomes dark and the field converges into the area formerly occupied by the granule (Fig. 8). As the field moves inward, the intensity drops even further. The strong magnetic field eventually occupies the entire micropore area at the vertex of several intergranular lanes. Another way of looking at the same process is via the correlation of the emergent intensity with the magnetic field (Fig. 9). As the micropore forms the darkest region initially has low field strength. As time goes on, the magnetic field strength at the darkest points in the micropore increases, until it reaches the maximum field strength around 1.6 kG.
The strong field concentrations persist for hours in the same region, much longer than the micropores, which form and disappear.
We can also gain insight into micropore evolution by looking at how variables on a line through the center of the micropore evolve in time. Fig. 10 shows change with time of the vertical velocity on a line through the center of the micropore. Initially there is an upflow in the granule at the location of the future micropore. As the field concentrates this switches to a large downward velocity, which starts at the surface and propagates downward. Again as the magnetic field disperses there is a large downward velocity. The downflow as the micropore forms has higher than average density and evacuates the flux tube, which produces a low density region near the surface in the micropore (Fig. 10). As the micropore disappears, higher density material moves back toward the surface, bringing the density there back to average. Originally the granule is hot. As the micropore forms the region cools off (Fig. 10) because not as much energy is being transported to the surface and while cooling from the surface continues unabated. As the field disperses the fluid gets heated back up again and the micropore vanishes. Before the micropore forms the pressure in the granule is higher than the surroundings pushing the diverging flow (Fig. 10). As the magnetic field gets concentrated, of course, the gas pressure goes down so as to maintain approximate pressure balance in horizontal directions with its surroundings. As the field disperses the pressure comes back up again and produces a large downward pressure gradient in the micropore.
Acknowledgements.
This work was supported in part by NASA grant NAG 5-9563, NSF grant AST 9819799, and the Danish Research Foundation, through its establishment of the Theoretical Astrophysics Center. The calculations were performed at the National Center for Supercomputer Applications, which is supported by the National Science Foundation, at Michigan State University and at UNIC, Denmark.References
- [1] \BYStein R. F. \atqueNordlund Å. \INAstrophys. J.4991998914.
- [2] \BYStein R. F. \atqueNordlund Å. \INSolar Phys. 192200091.