The Structure of the Oxygen-rich Supernova Remnant G292.0+1.8 from Chandra X-ray Images: Shocked Ejecta and Circumstellar Medium
Abstract
We present results from the observation of the young Galactic supernova remnant (SNR) G292.0+1.8 with the Advanced CCD Imaging Spectrometer (ACIS) on board the Chandra X-ray Observatory. In the 0.3 8 keV band, the high resolution ACIS images reveal a complex morphology consisting of knots and filaments, as well as the blast wave around the periphery of the SNR. We present equivalent width (EW) maps for the elemental species O, Ne, Mg, and Si, which allow us to identify regions of enhanced metallicity in the SNR. G292.0+1.8 is bright in O, Ne, and Si; weaker in S and Ar; with little Fe. The EW and broad-band images indicate that the metal-rich ejecta are distributed primarily around the periphery of the SNR. The central belt-like structure has normal solar-type composition, strongly suggesting that it is primarily emission from shocked circumstellar medium rather than metal-rich ejecta. We propose that the belt traces its origin to enhanced mass loss in the star’s equatorial plane during the slow, red supergiant phase. We also identify thin filaments with normal composition, centered on and extending nearly continuously around the outer boundary of the SNR. These may originate in a shell caused by the stellar winds from the massive progenitor in the red/blue supergiant phases, over-run by the blast wave.
1 INTRODUCTION
G292.0+1.8 is a bright Galactic SNR, discovered in the radio surveys of the southern sky (Milne, 1969; Shaver & Goss, 1977). The radio morphology is centrally-peaked with an extended fainter plateau (Lockhart et al., 1977; Braun et al., 1986) and the radio spectral index is intermediate between shell and plerion type SNRs (Goss et al., 1979). The detection of strong O and Ne lines in the optical spectrum (Goss et al., 1979; Murdin & Clark, 1979) classified G292.0+1.8 as an O-rich SNR, of which there are only two other examples in the Galaxy: Cassiopeia A and Puppis A. G292.0+1.8 is a young SNR ( 1600 yr) (Murdin & Clark, 1979), making it useful for studying the processes by which SN ejecta mix with the ambient ISM.
G292.0+1.8 was first detected in X-rays with HEAO-1 (Share et al., 1978) and a central bar-like structure surrounded by an ellipsoidal disk was observed with Einstein (Tuohy et al., 1982). X-ray spectra taken with Einstein and EXOSAT revealed strong atomic emission lines from highly ionized Mg, Si, and S (Clark et al., 1980; Claas, 1988). Hughes and Singh (1994) performed a nonequilibrium ionization (NEI) analysis of the X-ray spectrum of G292.0+1.8, which determined that the SNR was significantly enhanced in O, Ne, and Mg and that the pattern of elemental abundances agreed well with the nucleosynthesis expected from a massive star (2025 ) core collapse supernova.
The superb high angular resolution of the Chandra X-ray Observatory (Weisskopf et al., 1996) allows us to study the complex structure of the ejecta and the surrounding medium. It also allowed us to discover a hard point-like source near the center of the remnant, as reported elsewhere (Hughes et al. 2001a, ) (H01a, hereafter). Here we report the first Chandra imaging results on the diffuse thermal emission from G292.0+1.8. A subsequent Letter describes our spectral analysis of the SNR (Hughes et al. 2001b, ) (H01b, hereafter).
2 OBSERVATION & DATA REDUCTION
G292.0+1.8 was observed with the Advanced CCD Imaging Spectrometer (ACIS) on board Chandra on 2000 March 11 as part of the Chandra Guaranteed Time Observation program. The angular size of G292.0+1.8 is slightly larger than the 8′ size of a single CCD chip; the ACIS-S3 chip was chosen because it has the best energy resolution over the entire CCD. The pointing was selected to place most of the SNR on the S3 chip.
We have utilized new data reduction techniques developed at Penn State for correcting the spatial and spectral degradation of ACIS data caused by radiation damage, known as Charge Transfer Inefficiency (CTI) (Townsley et al., 2000). The expected effects of the CTI correction include an increase in the number of detected events and improved event energies and energy resolution (Townsley et al., 2000, 2001). We screened the data with the flight timeline filter and then applied the CTI correction before further data screenings by status, grade, and the energy selections. “Flaring” pixels were removed and ASCA grades (02346) were selected. Events with inferred energies between 0.3 keV and 8.0 keV were extracted for further data analysis. The overall lightcurve was examined for possible contamination from time variable background and no significant variability was found. After data processing 43 ks of effective exposure was left.
3 X-ray Images & Equivalent Width Maps
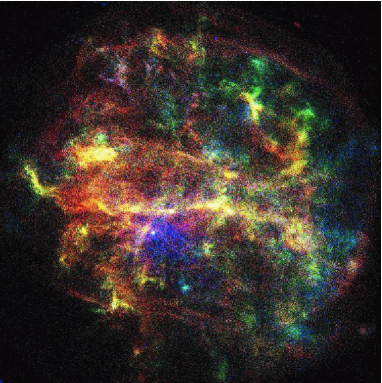
Figure 1 shows an X-ray “true-color” image of G292.0+1.8, with red indicating the lowest energies and blue for the highest. The deep blue region south of the central belt is the presumed pulsar wind nebula, dominating above 2 keV (H01a). Below 2 keV, the SNR is dominated by a complex network of knots and filaments (yellow and green) on angular scales down to the instrumental resolution. The striking color contrasts in this filamentary structure indicate spectral variations in this material, produced by varying line strengths. These knots and filaments are bounded by shell-like circumferential filaments surrounding most of the SNR, outside of which is faint diffuse emission. These features are soft, as indicated by the red colors.
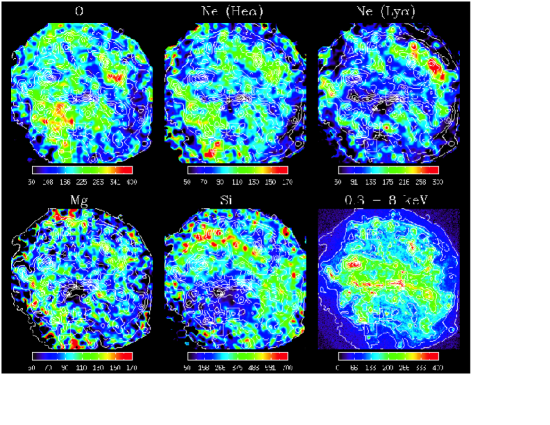
The overall ACIS spectrum (H01a) shows broad atomic emission line complexes from the elemental species O, Ne, Mg, Si, S, and Ar, while little emission from Fe is observed. In order to trace the elemental distribution across the SNR, we constructed equivalent width (EW) images by selecting photons around the broad line complexes (Table 1), using a technique pioneered by Hwang et al. (2000). Line and continuum bandpasses were selected for each spectral line of interest. Images in these bands were extracted with 2 pixels and smoothed with a Gaussian with = 7. The underlying continuum was calculated by logarithmically interpolating between images made from the higher and lower energy “shoulders” of each broad line. The estimated continuum flux was integrated over the selected line width and subtracted from the line emission. The continuum-subtracted line intensity was then divided by the estimated continuum on a pixel-by-pixel basis to generate the EW images for each element. In order to avoid noise in the EW maps caused by poor photon statistics near the edge of the remnant, we have set the EW values to zero where the estimated continuum flux is low. We also set the EW to zero where the integrated continuum flux is greater than the line flux.
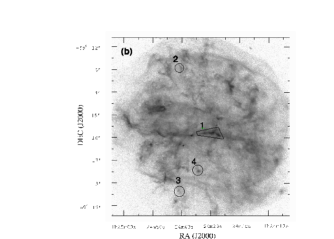
The EW maps for O, Ne, Mg, and Si are presented in Figure 2 with overlaid contours from the 0.3 8.0 keV band image for morphological comparison between the elemental distribution and the surface brightness. (The S and Ar EW maps are too noisy to be useful. High Mg EW values in the extreme north and south edges of the SNR are due to low continuum and are insignificant.) The overall spectrum exhibits two broad-line features for Ne (He at 0.93 keV and Ly at 1.05 keV) (H01a), and we separately present those two line components in the EW maps. The morphology of the EW maps depends on the species, and does not necessarily trace the overall broad-band morphology. To investigate the possibility that complex broad line features might have resulted in contamination of the estimated underlying continuum, we have compared the O EW map with the optical OII 3727 line data (Tuohy et al., 1982). The O EW enhancements in the southeast area of the SNR are in good spatial agreements with the optical data, supporting the reliability of the EW maps. We also extracted a few sample spectra from small regions across the SNR in order to make a more realistic test for the overall validity of the metallicity structure of the SNR implied by the EW maps. The metallicity distributions implied by the EW maps are in good agreement with the actual spectra (Figure 3). For example, the spectrum in Region 1 shows weaker Ne lines compared with those from Regions 3 and 4, in agreement with the EW maps. The spectrum of Region 2, which sits on a peak in the Si EW map, is dominated by bright Si and S lines. We thus conclude that our EW maps are reliable despite the inherent uncertainties in the continuum subtraction. Further quantitative support for the validity of our EW maps is given in H01b.
The EW maps reveal a variety of chemical structures and ionization states within the SNR, which vary with the species. The O EW map indicates strong O emission throughout the SNR, particularly in the southeastern quadrant, consistent with the previously-known O-rich nature. The Ne EW maps are particularly interesting. Both Ne maps are enhanced within the circumferential filaments, suggesting that the material interior to these filaments is dominated by ejecta. The bright, broad ridge of emission in the northwest corner of the Ne Ly map lies to the outside of the corresponding feature in the Ne He, indicating a progression in ionization state with distance from the shock boundary in this portion of the SNR. This may be attributed to the progressive ionization by the reverse shock as seen in SNR 1E0102.27219 (Gaetz et al., 2000; Flanagan et al., 2001). In the southeastern quadrant, O and Ne He are both strong, while Si and Ne Ly are relatively weak, again suggesting large-scale variations in ionization state and elemental abundance within the ejecta. The central bar that is prominent in the broad-band images is either a trough or completely absent in the EW maps, indicating that this feature is not related to the ejecta, but is a structure in the shocked circumstellar material (CSM). The thin circumferential filaments are also absent from the EW maps, indicating a CSM origin. Finally, the region of the pulsar wind nebula surrounding the bright point-like source is dominated by synchrotron emission (H01a), and is therefore dark in the EW maps.
4 DISCUSSION
The most interesting result from the EW and the surface brightness maps is the inferred CSM origin of the bright belt-like structure as observed in the broad-band image. Tuohy et al. (1982) suggested that the central “bar-like” enhancement results from the equatorial expulsion of O-rich ejecta from a rotating massive progenitor to form an expanding ring of such ejecta. Our results from this Chandra observation indicate that instead of being O-rich, the material associated with the belt is actually O-poor compared with the rest of the remnant. This equatorial belt is most likely emission from the normal composition material into which the blast wave is expanding, as suggested by the EW maps, and is strong evidence for the existence of a non-spherically symmetric CSM produced by the stellar winds from the massive progenitor (Blondin et al. 1996 and references therein). Such asymmetric wind structures have been invoked to explain complex biannular structure in some radio SNRs (Manchester, 1987), including G296.8-00.3 (Gaensler et al., 1998). The apparent belt-like morphology for G292.0+1.8 suggests that the presumed asymmetric CSM may be “ring-like”, reminiscent of the well-known optical ring of SN 1987A (Luo & McCray, 1991), but seen edge-on and on much larger spatial scales. Assuming that the apparent “length” of the equatorial belt represents the diameter of such a circumstellar ring, the current size of the belt is 3 pc in radius at the distance of 4.8 kpc. This is comparable with the observed sizes of the circumstellar nebulae from massive stars ( a few pc in radius depending on their masses and the evolution history; e.g., Chu 2001 and references therein).
Another interesting feature is the soft circumferential filaments that nearly enclose the ejecta-dominated portion of the SNR. Although the material just interior to these filaments shows strong lines of O, Ne, and Si, the circumferential filaments themselves are absent from the EW maps, indicating low line strength. This is consistent with an origin in the CSM, but several scenarios may be invoked to explain this large-scale feature. The low abundances and thin shell suggest the possibility that these filaments represent a relic structure in the CSM, perhaps a shell at the boundary of a red supergiant wind with a subsequent blue supergiant wind, that has been over-run by the blast wave. Numerical simulations of such CSM/blast wave interactions (e.g., Franco et al. 1991) have shown that the observed structure can be produced if the mass of the shell is low. Alternatively, it could represent the outer shock itself. This interpretation would require that the low surface-brightness emission exterior to these filaments, results from projection effects, which could happen if one hemisphere of the remnant was expanding into a lower density medium, producing a morphology similar to VRO 42.05.01 (Landecker et al., 1982; Pineault et al., 1987; Burrows & Guo, 1994), but seen face-on.
We note that H01a has attributed the 1′ offset of the pulsar position from the geometrical center of the SNR to either high transverse velocity of the pulsar or slower expansion of the SNR toward the southeast. Our results suggest advanced ionization state in the northwest and thus likely a higher ISM density there, which would support the high pulsar velocity interpretation.
5 SUMMARY
We have presented results from the Chandra/ACIS observation of the Galactic O-rich SNR, G292.0+1.8. The high resolution ACIS images resolve the complex filamentary structure in the soft band while revealing a pulsar and its wind nebula in the hard band. The EW maps indicate variable elemental abundance and ionization across the SNR. Based on the surface brightness images and the EW maps, we propose that the equatorial belt in the broad band images is emission from the shocked non-spherically symmetric CSM, produced by slow stellar winds from the massive progenitor in the red supergiant phase, rather than from metal-rich ejecta. We also suggest that the origin of the soft shell-like structure around the outer boundary of the SNR may be emission from the shell of the stellar winds over-run by the blast wave, or the shock front itself if the X-ray emission of larger radii comes from portions of the remnant seen in projection along the line of sight. The distribution of the ejecta implies a complex evolution for G292.0+1.8, such as an asymmetric SN explosion and highly clumped ejecta interacting with non-uniform ambient ISM (Braun et al., 1986).
We resolve the complex X-ray structure of G292.0+1.8: i.e., metal-rich ejecta, shocked dense asymmetric CSM, and the shocked stellar winds or ISM with the high resolution ACIS data. We should note, however, that EW depends not only on the abundance, but also on the temperature and ionization state, so that direct spectral analysis is needed to confirm the inferred metallicity distributions by the EW maps. Further progress on the origin of the equatorial belt and the soft shell-like structure at the SNR’s periphery will benefit from follow-up optical spectroscopy and detailed X-ray spectral analysis (H01b).
References
- Braun et al. (1986) Braun, R., Goss, W. M., Caswell, J. L., & Roger, R. S., 1986, A&A, 162, 259
- Blondin et al. (1996) Blondin, J. M., Lundqvist, P., & Chevalier, R. A. 1996, ApJ, 472, 257
- Burrows & Guo (1994) Burrows, D. N., & Guo, Z. 1994, ApJ, 421, L19
- Claas (1988) Claas, J. J. 1988, in Proc. of the Workshop on Supernova Shells and Their Birth Events, ed. W. Kundt (Berlin: Springer-Verlag), 146
- Chu (2001) Chu, Y. 2001, The 11th Astrophys Conf. of Maryland, “Young Supernova Remnants”, ed., S. Holt, & U. Hwang, AIP Conf Proc. # 565, 409
- Clark et al. (1980) Clark, D. H., Tuohy, I. R., & Becker, R. H., 1980, MNRAS, 193, 129
- Flanagan et al. (2001) Flanagan, K. A. et al. 2001, The 11th Astrophys Conf. of Maryland, “Young Supernova Remnants”, ed., S. Holt, & U. Hwang, AIP Conf Proc. # 565, 226
- Franco et al. (1991) Franco, J. et al. 1991, PASP, 103, 803
- Gaensler et al. (1998) Gaensler, B. M., Manchester, R. N., & Green, A. J. 1998, MNRAS, 296, 813
- Gaetz et al. (2000) Gaetz, T. J. et al. 2000, ApJ, 534, L47
- Goss et al. (1979) Goss, W. M., et al. 1979, MNRAS, 188, 357
- Hughes & Singh (1994) Hughes, J. P., & Singh, K. P. 1994, ApJ, 422, 126
- (13) Hughes, J. P., Slane, P. O., Burrows, D. N., Garmire, G. P., Nousek, J. A., Olbert, C. M., & Keohane, J. W. 2001, ApJ, 559, L153, H01a
- (14) Hughes, J. P., Park, S., Roming, P. W. A., Burrows, D. N., Garmire, G. P., Nousek, J. A., & Slane, P. O., ApJL, 2001, Submitted, H01b
- Hwang et al. (2000) Hwang, U., Holt, S. S., & Petre, R. 2000, ApJ, 537, L119
- Landecker et al. (1982) Landecker, T. L. et al. 1982, ApJ, 261, L41
- Lockhart et al. (1977) Lockhart, I. A. et al. 1977, MNRAS, 179, 147
- Luo & McCray (1991) Luo, D. & McCray, R. 1991, ApJ, 379, 659
- Manchester (1987) Manchester, R. N. 1987, A&A, 171, 205
- Milne (1969) Milne, D. K. 1969, Australian J. Phys., 22, 613
- Murdin & Clark (1979) Murdin, P., & Clark, D. H. 1979, MNRAS, 189, 501
- Pineault et al. (1987) Pineault, S., Landecker, T. L., & Routledge, D. 1987, ApJ, 315, 580
- Share et al. (1978) Share, G. et al. 1978, IAUC, No. 3169
- Shaver & Goss (1977) Shaver, P. A., & Goss, W. M. 1970, Australian J. Phys., Astr. Suppl., 14, 133
- Tuohy et al. (1982) Tuohy, I. R., Clark, D. H., & Burton, W. M. 1982, ApJ, 260, L65
- Townsley et al. (2000) Townsley, L. K. et al. 2000, ApJ, 534, L139
- Townsley et al. (2001) Townsley, L. K. et al. 2001, Nucl. Inst. & Meth. in Phys Res A, in press
- Weisskopf et al. (1996) Weisskopf, M. C. et al. 1996, Proc. SPIE, 2805, 2
| Elements | Line | Low††The high and low energy bands around the selected line energies used to estimate the underlying continuum. | High††The high and low energy bands around the selected line energies used to estimate the underlying continuum. |
|---|---|---|---|
| (eV) | (eV) | (eV) | |
| O | 510 740 | 300 510 | 740 870 |
| Ne He | 890 970 | 740 870 | 1120 1160 |
| Ne Ly | 1000 1100 | 740 870 | 1120 1160 |
| Mg | 1290 1420 | 1250 1290 | 1620 1700 |
| Si | 1750 1930 | 1620 1700 | 2020 2120 |