The Global Content, Distribution, and Kinematics of Interstellar O VI in the Large Magellanic Cloud
Abstract
We present Far Ultraviolet Spectroscopic Explorer (FUSE) observations of interstellar O VI absorption towards 12 early-type stars in the Large Magellanic Cloud (LMC). The observations have a velocity resolution of km s-1 (FWHM) and clearly show O VI 1031.926 Å absorption at LMC velocities towards all 12 stars. From these observations we derive column densities of interstellar O VI in this nearby galaxy; the observed columns are in the range to 14.6, with a mean of 14.37 and a standard deviation of ( dex). The observations probe several sight lines projected onto known superbubbles in the LMC, but these show relatively little (if any) enhancement in O VI column density compared to sight lines towards relatively quiescent regions of the LMC. The observed LMC O VI absorption is broad, with Gaussian dispersions to 50 km s-1. This implies temperatures K, indicating that much of the broadening is non-thermal because O VI has a very low abundance at such high temperatures. The O VI absorption is typically displaced km s-1 from the corresponding low-ionization absorption associated with the bulk of the LMC gas.
The general properties of the LMC O VI absorption are very similar to those of the Milky Way halo. The average column density of O VI and the dispersion of the individual measurements about the mean are identical to those measured for the halo of the Milky Way, even though the metallicity of the LMC is a factor of lower than the Milky Way. The velocity dispersion measured for the LMC material is also consistent with recent measurements of the Galactic halo. The striking similarities in these quantities suggest that much of the LMC O VI may arise in a vertically-extended distribution similar to the Galactic halo. We discuss the measurements in the context of a halo composed of radiatively cooling hot gas and/or turbulent mixing layers. If the observed O VI absorption is tracing a radiatively cooling galactic fountain flow, the mass flow rate from one side of the LMC disk is of the order M⊙ yr-1, with a mass flux per unit area of the disk M⊙ yr-1 kpc-2.
1 Introduction
Current theory suggests that the interstellar medium (ISM) in galaxies is strongly influenced by the input of energy and matter from stars. This is particularly true for spiral and irregular galaxies which are typically experiencing on-going star formation. The effects of the interactions of (multiple) stars and supernovae with the ISM in spiral and irregular galaxies is expected to produce pockets of super-heated gas (e.g., Heiles 1990; Norman & Ikeuchi 1989; Mac Low & McCray 1988), and the holes visible in the neutral hydrogen distributions of galaxies are often interpreted as the signature of such effects (Kim et al. 1999; Puche et al. 1992; Deul & den Hartog 1990; Brinks & Bajaja 1986). In regions with high densities of early-type stars, the energy input from the stars and supernovae can shape interstellar matter on kiloparsec scales. For disk galaxies, with larger pressure gradients in the vertical, , direction than the radial direction, the super-heated, high pressure gas is thought to flow away from the disk, feeding matter and energy into the thick disk or halo of the system (e.g., de Avillez 2000; Norman & Ikeuchi 1989; Bregman 1980).
The Large Magellanic Cloud (LMC) is the nearest disk galaxy to the Milky Way. Its proximity ( kpc) and low inclination angle () provide a relatively clear view of this system (see Westerlund 1997), with very little foreground or line-of-sight confusion. The LMC has long served as a laboratory for studies of the ISM. Excellent maps of the ISM within the LMC are available for the warm ( K) gas, both neutral (Kim et al. 1998) and ionized (e.g., Smith 1999; Kennicutt et al. 1995; Davies, Elliott, & Meaburn 1976), as well as the hot gas (Snowden & Petre 1994; Wang et al. 1991). The ability to resolve individual stars from each other and the ISM in this system provides a unique opportunity to determine the energy budget of the largest interstellar structures within the galaxy (e.g., Oey 1996).
Studies of the hot gaseous content of the LMC are of particular importance for understanding the energy input into the ISM from stars. One manner in which to study the hot gas content of a galaxy is through ultraviolet (UV) absorption line observations of the Li-like oxygen ion (O+5 or O VI), which has a doublet of transitions at 1031.926 and 1037.617 Å. The O VI ion principally arises in hot, collisionally-ionized gas in galactic environments since the ionization potential for its production (IP eV) is high enough to preclude a significant photoionized component. Such observations are currently plausible using the Far Ultraviolet Spectroscopic Explorer (FUSE), a dedicated spectroscopic observatory operating in the wavelength range Å at high resolution (). FUSE can easily observe stars in the Galactic halo, stars in the Magellanic Clouds, and distant extragalactic sources with sufficient signal to noise to produce reliable O VI column density and line profile measurements.
Here we present FUSE spectra of O VI absorption towards 12 early-type stars in the LMC, the properties of which are summarized in Table 1. In this work we show that the LMC contains a large amount of highly-ionized gas distributed in a patchy manner across its face. The O VI column densities in the LMC along the directions studied in this work are as high as those observed through the halo of the Milky Way (Savage et al. 2000). We show that the hot material traced through O VI is present at significantly different velocities than the bulk of the low-ionization material arising in the disk of the LMC, a phenomenon that was also seen in Hubble Space Telescope (HST) observations of C IV absorption (Wakker et al. 1998). We will argue that the available evidence suggests much of the observed LMC absorption arises in an extended halo or corona, perhaps very similar to that observed in the Milky Way. These results are important since the LMC is the only other disk galaxy beyond the Milky Way that can be studied in this manner.
In §2 we discuss the reduction of the FUSE data employed in this work, while §3 discusses the methods used in analyzing the data. We discuss the gross distribution of O VI column densities in the LMC in §4, and the rough kinematic properties of the hot material in §5. In §6 we discuss the implications of our observations, and we summarize our work in §7.
2 FUSE Observations and Data Reduction
The FUSE mission, its planning and in-orbit performance are discussed by Moos et al. (2000) and Sahnow et al. (2000). Briefly, the FUSE observatory consists of four co-aligned prime-focus telescopes and Rowland-circle spectrographs feeding two microchannel plate (MCP) detectors with helical double delay line anodes. Two of the telescope/spectrograph channels have SiC coatings providing reflectivity over the range Å, while the other two have Al:LiF coatings for sensitivity in the Å range. We make use of only the latter, the LiF channels, in this work. Light from each mirror passes through an aperture onto a holographically-ruled spherical grating. The resulting spectra are projected onto the MCP detectors, with spectra from one LiF and one SiC channel imaged in parallel onto each detector.
The data used in this work were all obtained with the source centered in the (LWRS) aperture of the LiF1 spectrograph channel.111The Sk–6705 data were obtained as part of in-orbit checkout activities that required multiple exposures with the object at different locations within the aperture. The processing of this observation required special care to ensure that the individual exposures were shifted and summed properly. The analysis of this sight line is discussed by Friedman et al. (2000). In many cases, the LiF2 channel was co-aligned well enough with the LiF1 channel that a second set of spectra covering the 1000–1187 Å wavelength range was obtained. Total exposure times ranged from 3.6 ksec to 33 ksec for the LMC stars used in this work. A log of the observations used for this investigation is given in Table 2.
The raw datasets consist of tables of time-tagged photon event locations within each detector array.222Bright targets make use of the spectral image mode wherein the photons arriving at each pixel are simply summed and read out at the end of the exposure. This mode does not preserve the time-tagged nature of the data. The individual exposures for a set of observations were merged into a single spectrum by concatenating the individual photon event lists. These combined time-tagged photon event lists were processed with version 1.8.6 or 1.8.7 of the standard FUSE calibration pipeline (CALFUSE) available at The Johns Hopkins University [see Oegerle et al. (2000) for a detailed description of the CALFUSE pipeline]. The differences between these two versions of the pipeline are inconsequential for our purposes. The photon lists were screened for valid data with constraints imposed for earth limb angle avoidance and passage through the South Atlantic Anomaly. Corrections for detector backgrounds, Doppler shifts caused by spacecraft orbital motions, and geometrical distortions were applied (Sahnow et al. 2000). No corrections were made for optical astigmatism aberrations, and no flatfield corrections are yet applied in the FUSE calibration process. Given the existence of significant fixed-pattern noise structure introduced by the FUSE detectors, the latter omission can be particularly important. We compared the LiF1 and LiF2 spectra whenever possible to determine the significance of the observed features.
The processed data have a nominal spectral resolution of km s-1 (FWHM), with a relative wavelength dispersion solution accuracy of km s-1 (). The zero point of the wavelength scale for each individual observation is poorly determined. In a few cases International Ultraviolet Explorer (IUE) or Space Telescope Imaging Spectrograph (STIS) data allowed us to constrain the velocity zero point of observations of LMC stars. These include the sight line toward Sk–7145 with STIS and Sk–67211 with IUE. We have also investigated the velocity offsets of several stars not presented in this work and find that a consistent shift of to km s-1 from the CALFUSE wavelength solution was often appropriate to bring the FUSE data into the LSR frame (with the exception of the Sk–6705 datasets; see Friedman et al. 2000). This is consistent with the average shift of km s-1 derived for FUSE LMC/SMC observations calibrated with STIS echelle-mode observations by Danforth et al. (2002). We note that this shift includes an implicit correction for the sign error in the application of the heliocentric velocity correction in all CALFUSE versions prior to v2.0, though the magnitude of this error is small for LMC sight lines (of order km s-1). In those cases where other data are not available, we have adopted a km s-1 shift to the FUSE velocity scale.
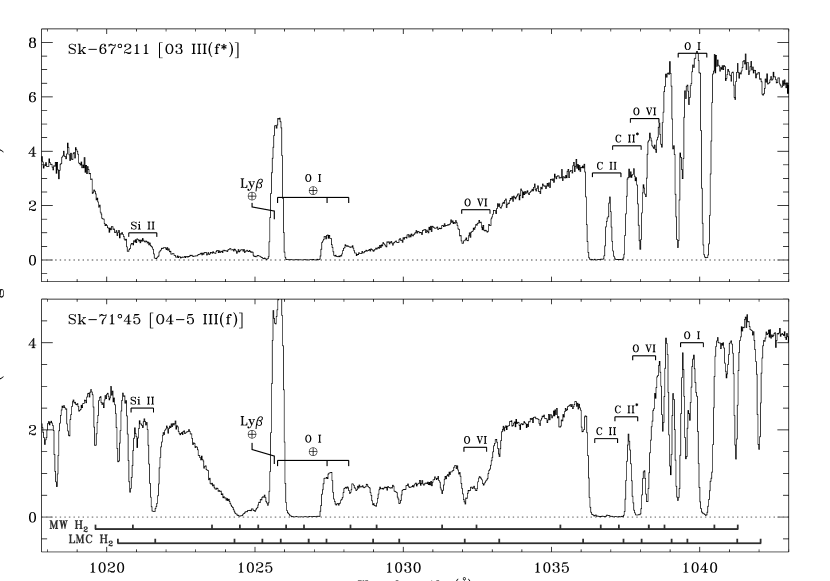
Figure 1 shows portions of the final FUSE spectra of two stars near the O VI doublet: Sk–67211 and Sk–7145. These spectra represent only data from the LiF1 channel for each star. Several prominent ionic absorption lines are marked, with ticks showing the location of the Milky Way and LMC absorption components. The positions of the Milky Way and LMC ticks are determined by the velocity of the Si II line at 1020.699 Å. We have not marked the position of interstellar Ly absorption. Telluric emission lines from Ly and O I can be seen to varying degrees in the data.
These two sight lines represent two extremes of molecular hydrogen absorption for our sample of stars. The sight line towards Sk–7145 shows a rich spectrum of H2 absorption from both Milky Way and LMC gas. The expected positions of the H2 lines (for Å and only) in both the Galaxy and LMC towards Sk–7145 are marked under the spectrum of that star. The sight line towards Sk–67211, however, shows only very weak H2 absorption (e.g., the Lyman (5-0) R(3) transition at 1041.16 Å). We discuss the importance of H2 contamination of the interstellar O VI profiles in §3.2. The properties of the H2 absorption within the LMC are discussed by Tumlinson et al. (2001).
It should be noted from Figure 1 that the absorption from the weaker O VI transition at 1037.617 Å is almost always heavily confused by absorption from C II∗ and H2 when studying the LMC. This is the case even for Sk–67211, which exhibits only very weak H2 absorption.
3 Analysis of Interstellar O VI Absorption
This section discusses the details of our analysis of the interstellar O VI absorption. Of particular importance is the estimation of the stellar continuum, which is determined by the specifics of the out-flowing stellar wind for the stars in the sample (see §3.1). The estimation of the strength of H2 contamination at the velocities of the interstellar O VI is more important for absorption at Milky Way velocities than for absorption at the velocities of the LMC, but in some cases it can be important for the latter as well (§3.2). Finally we discuss the details of our measurements of equivalent widths and column densities (§3.3).
3.1 Estimation of the Stellar Continuum
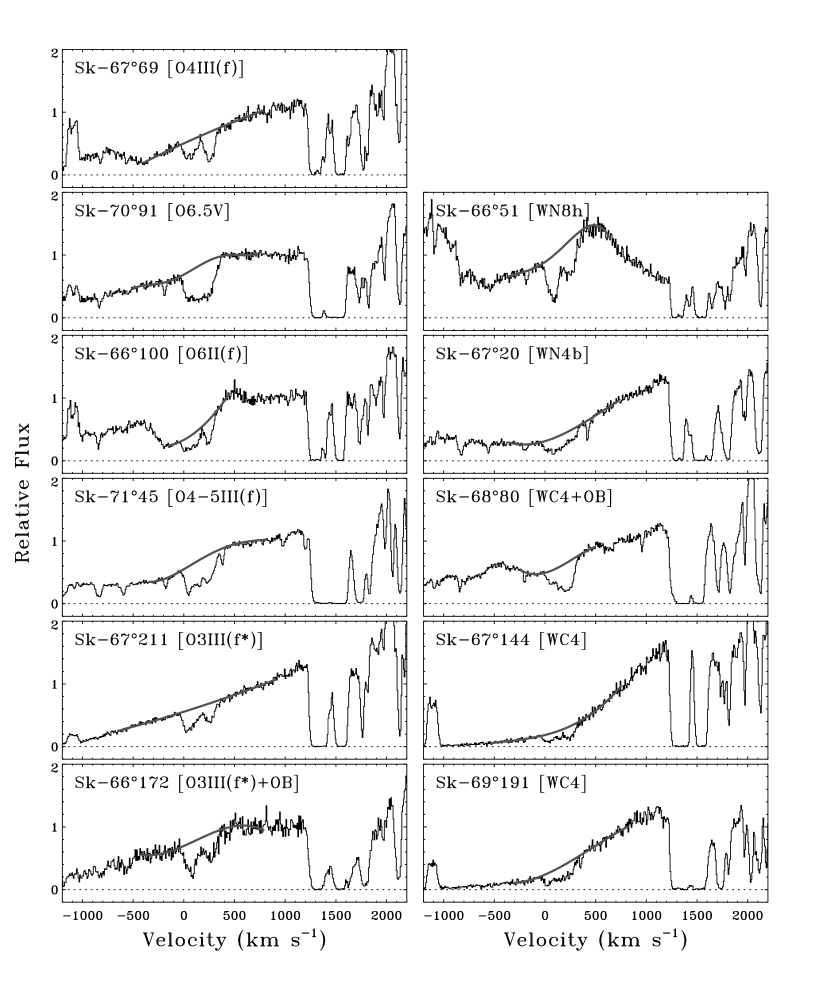
The single greatest uncertainty in an analysis of the interstellar O VI absorption from the LMC is the determination of the stellar continuum in the regions immediately surrounding the interstellar features. As discussed by Massa et al. (2002), the shape of the local stellar continuum in the O VI spectral region of early-type stars is dominated by resonance absorption (and scattering) of the stellar continuum emission by O VI ions in the out-flowing stellar wind. The principle source of O VI within the stellar winds of the O stars is likely ionization by X-rays produced in strong shocks propagating through the wind (Puls, Owocki, & Fullerton 1993). The radiative transfer of photons from the photosphere through the expanding wind yields a characteristic P Cygni-like profile (see Lamers & Cassinelli 1999). Because of the stochastic nature of the shock formation process, the shape of the O VI P Cygni profiles can be significantly different for individual OB and WR stars and can even be temporally variable (e.g., Lehner et al. 2001).
Our approach to studying the interstellar O VI in this first study of the LMC is to use only stars whose stellar continua are straightforward to approximate. Furthermore, we have compared our fits of the stellar continua with the Sobolev Exact Integration (SEI; see Massa, Prinja, & Fullerton 1995) modelling of the radiative transfer of photospheric photons through the out-flowing stellar wind from Massa et al. (2002). We have insured that there are no significant systematic inconsistencies between the the stellar continua determined when viewing the stellar wind on a relatively local scale (i.e., within a few hundred km s-1 of the ISM absorption) and the information derived from self-consistent radiative transfer models of the entire stellar wind profiles (with the provisos discussed by Massa et al. 2002).
We have limited our sample to WR stars and O stars with spectral types O7 and earlier. The use of only the earliest spectral types implies that we are using stars with large mass loss rates (and often large terminal velocities as well), which tend to show more fully developed (i.e., simpler) O VI P Cygni profiles and are less susceptible to difficulties caused by wind variations (see discussion below). To this end we have examined the existing FUSE PI team spectra of all stars meeting these spectral class requirements. From this sample we have chosen to study 12 sight lines: 11 new sight lines and 1 (Sk–6705) studied by Friedman et al. (2000). The properties of these 12 stars are summarized in Table 1.
Figure 2 shows the adopted stellar continua for the O stars (left column) and WR stars (right column) studied in this work. For each star we estimated the shape and level of the local stellar continuum near the interstellar O VI 1031.926 absorption by fitting low-order () Legendre polynomials to adjacent spectral regions free from interstellar lines. This fitting followed the techniques described by Sembach & Savage (1992), including the estimation of the uncertainties in the Legendre polynomial fitting coefficients. This allows us to include an estimate for continuum fitting uncertainties in our equivalent width and column density measurement error estimates (see below). In each case we adopted the lowest-order polynomial that could reasonably approximate the stellar continuum. Though we applied an -test to assess the significance of additional polynomial terms, the final decision on the order of the fit was subjective.
A few general comments regarding the placement of stellar continua for early-type stars are necessary. The separation of the two members of the O VI doublet is km s-1. Thus, for stars whose winds have terminal velocities, , in excess of this velocity, the absorption from the red member of the doublet will overlap that of the blue member. From the standpoint of understanding the stellar continuum in the region of interstellar O VI, stars with stellar wind terminal velocities within a few hundred km s-1 of the 1650 km s-1 separation of the O VI doublet are often problematic. Given that the terminal velocity is often manifested as a relatively sharp gradient in the absorption strength of the wind profile, stars with such terminal velocities can have relatively complex stellar continua in the region of interest for interstellar studies.
For terminal velocities km s-1 the absorption edge of the 1031.926 Å transition lies in the deep interstellar Lyman- trough or the 1037 Å transition overlaps the 1031.926 Å rest velocity. In both of these cases, the overlap with other transitions can make it very difficult to obtain a reliable SEI fit because the models typically try to simultaneously fit both lines of the doublet. With the exception of Sk–6705, the terminal velocities for the O stars in Table 1 are in excess of these values. The terminal velocities for the WR stars are all outside of this range (though we did not make use of SEI modelling of these stars). Our exclusion of lower terminal velocity O stars is not because of the difficulty of the SEI modelling, but rather because stars with lower terminal velocities often display more complex continua in the region of interstellar O VI absorption. However, studies of the ISM towards later spectral type stars will need to consider the difficulties in the SEI modelling when comparing such models to their data.
Another concern regarding the general shape of the stellar wind absorption in the region of the O VI ISM lines is the probable variability of the stellar wind O VI absorption profiles. Lehner et al. (2001) have discussed such variations and their effects on continuum placement for interstellar studies. Using multiple FUSE observations of the O VI spectral region in Galactic and LMC stars, these authors showed that, even in sparsely sampled time series of two to three spectra, a large fraction () exhibited some spectral variability over the time periods probed (days to months). In general the variability in the O VI P Cygni profiles happened at velocities much higher than those of the interstellar absorption towards these stars. Furthermore, the scale over which the O VI varies was typically several hundred km s-1, significantly broader than most of the interstellar absorption lines in the Galaxy. Lehner et al. (2001) found that even though the shape of the stellar continuum can vary significantly with time, the derived O VI column densities and equivalent widths for Galactic absorption were typically not significantly different.
The situation for absorption in the LMC is less encouraging. Because the full extent of the absorption from the Galactic halo and the LMC typically extends over km s-1, the expectation that changes in the P Cygni profiles should occur over scales larger than that of the ISM absorption profile is no longer valid. Because the Milky Way absorption in these directions occurs at velocities of a few hundred km s-1 with respect to the rest frame of the stars, it is also no longer the case that most of the variation should occur at velocities well beyond the interstellar absorption. Indeed, the column densities and equivalent widths estimated towards the one LMC star in the study by Lehner et al. were significantly different between the two times sampled.
At this point we are unable to quantitatively assess the affects of stellar wind variability on the column densities derived along the sight lines to the LMC stars discussed in this work (see below). We note, however, that our choice of the earliest spectral type stars may help in this regard. Hot stars with large mass loss rates are desirable as background probes since their O VI wind lines are usually saturated. Nearly all of the flux observed in a saturated wind line is due to scattered light from throughout the wind. Therefore, substantial changes in the line of sight wind optical depth cannot have much of an impact on the flux profile because the transmitted flux is a small fraction of the total flux. The stellar wind profiles of these stars are therefore less susceptible to variations. The LMC star studied by Lehner et al. (2001) has a significantly lower terminal velocity and is of a later spectral type than the stars studied in this work. The continuum placement for this star is much more difficult than for any star in the present sample. This is important insofar as the column densities and equivalent widths of interstellar O VI can be accurately determined along the sight line to that star, irrespective of whether or not any variation in the wind profile is present.
Given the above discussion of wind variability and its effects on the derivation of O VI column densities, the reader should bear in mind that the column densities reported in this work have not been corrected for any stellar wind absorption features that may reside at velocities similar to the ISM features. Future re-observations of some of these stars are planned and may reveal some such features. However, the presence of discrete stellar wind absorption features at interstellar velocities can never be ruled out since one can only identify their presence if they change.
We should also note that for this work we have chosen to consider targets having relatively unambiguous separation between the stellar and interstellar features and well-delineated stellar continua, with the exception of Sk–6705. The continuum placement and uncertainties for this star, which also falls outside the range of spectral types we have investigated, are discussed in detail by Friedman et al. (2000). In general the stellar continua are more complicated as one looks to later spectral types because the O VI P Cygni profiles of later type stars tend to be less well developed than those of the early O stars. As our understanding of the stellar winds of the later spectral-type stars improves, we may be able to make use of the larger sample of FUSE observations of late O and B stars in the LMC for studying interstellar O VI.
3.2 Assessing the Contamination from Molecular Hydrogen
Absorption from molecular hydrogen in both the Milky Way and the LMC can overlap the O VI absorption along the observed sight lines. Absorption from the (6-0) P(3) and R(4) transitions of H2 at 1031.19 and 1032.35 Å, respectively, can contaminate the O VI absorption from the Milky Way halo and in some cases the O VI absorption from the LMC (e.g., see Figure 1). These lines absorb at and km s-1 relative to the rest frame of O VI 1031.926. Rather than derive the detailed characteristics of the entire H2 absorption spectrum, we have taken a more pragmatic approach to estimating the contamination of the interstellar O VI profiles by molecular hydrogen.
To estimate the contribution to the O VI profiles from the (6-0) P(3) and R(4) lines of molecular hydrogen, we have fit Gaussian profiles to a number of and 4 transitions of H2 with line strengths, , very similar to the contaminating 6-0 band transitions. The H2 transitions used in this approach are given in Table 3. For comparison, the properties of the contaminating (6-0) P(3) and R(4) lines are also given (in bold). We have only used lines which appear in the LiF1 channel. This helps to minimize the effects of changes in the breadth and shape of the instrumental line spread function, which occur when comparing lines in different channels and detector segments. Because of blending with other species and varying line strengths, the transitions available from Table 3 varied for each sight line.
The fitting process yields a peak apparent optical depth, a breadth, and a central velocity for each of the transitions. We have scaled the peak apparent optical depth for each fitted transition by the ratio of the contaminating 6-0 band line to that of the line fitted. Typically we were able to measure several transitions and average the scaled peak optical depths, breadths, and velocities predicted for the contamination (6-0) P(3) and R(4) transitions. For the transitions we often measured both weaker and stronger transitions than the offending line. Where possible, we have fine-tuned the velocities using the Milky Way P(3) and LMC R(4) components on either side of the interstellar O VI profiles. A difficulty with this general approach is that saturation effects can be significant for unresolved spectral lines. We have attempted to circumvent such difficulties by judiciously choosing comparison transitions with line strengths close enough to those 6-0 band transitions that the factor by which the peak optical depths are scaled is small. In general we have found that the scaled peak optical depths for the comparison transitions show a smaller dispersion than the directly measured values.
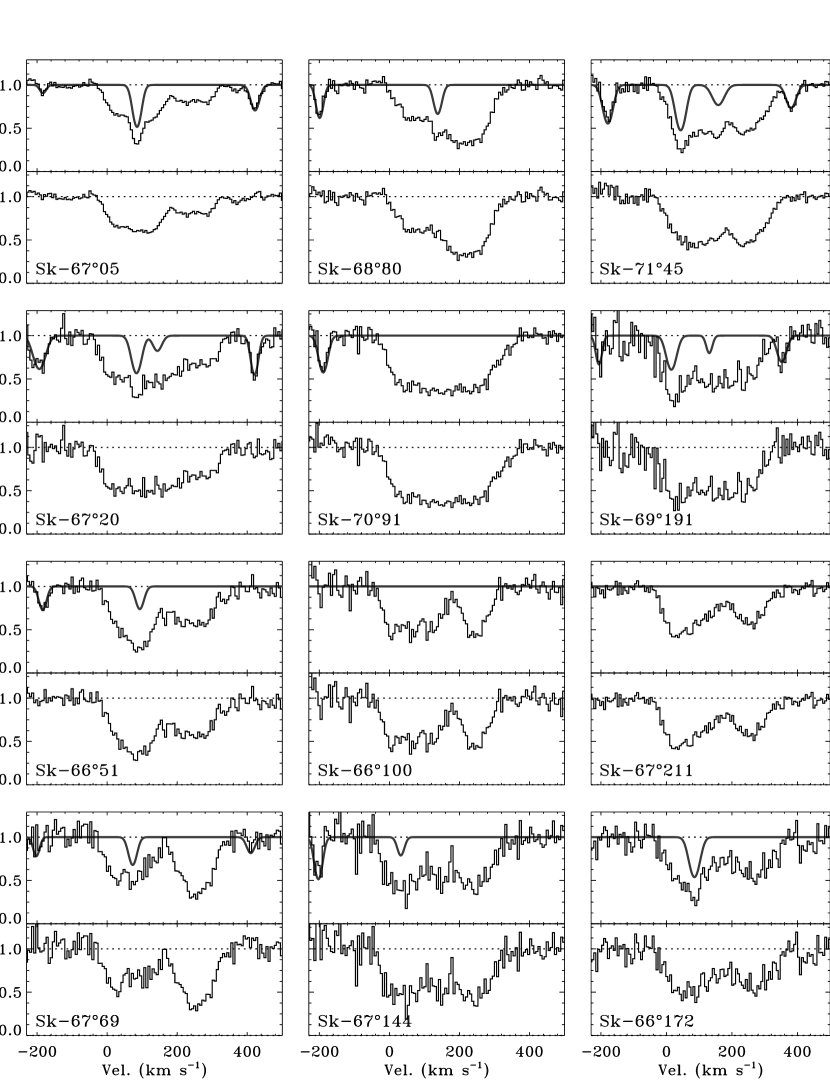
Figure 3 shows the continuum-normalized interstellar absorption profiles of O VI towards all of the target stars listed in Table 2. The top panel shows the profiles with the model H2 absorption spectrum over-plotted; the bottom panel shows the continuum-normalized profiles with the H2 model divided out. The models include the Milky Way P(3) and LMC R(4) components, which were estimated using the same approach as the contaminating LMC P(3) and Milky Way R(4) absorption. Though these outlying components do not overlap the O VI absorption in which we are interested, they demonstrate the quality of our procedure for estimating the H2 absorption strength.
For most of the sight lines studied in this work, the contamination of the O VI profile by molecular hydrogen absorption does not significantly affect the LMC absorption component. Notable exceptions include the sight lines towards Sk–6880, Sk–7145, and to lesser extents Sk–6720, and Sk–69191.
The (6-0) R(0) transition of the HD molecule at 1031.912 Å is almost coincident with the rest wavelength of the strong O VI transition. For the sight lines towards the LMC stars studied here, contamination of O VI by this line is unimportant because the H2 column densities, which are expected to be to times stronger, are low (see Tumlinson et al. 2001). Furthermore, several HD lines of similar strength to the 6-0 band transition exist in the FUSE bandpass (see Sembach 1999) but are not seen in the spectra. We have, therefore, made no correction for HD contamination of the O VI absorption.
3.3 Interstellar Absorption Line Measurements
We measured equivalent widths and column densities of the interstellar O VI 1031.926 following Sembach & Savage (1992). We estimated interstellar column densities using the apparent optical depth method (Savage & Sembach 1991). The apparent optical depth, , is an instrumentally-blurred version of the true optical depth of an absorption line, given by
| (1) |
where is the estimated continuum intensity and is the observed intensity of the line as a function of velocity. This is related to the apparent column density per unit velocity, [], by
| (2) |
where is the wavelength in Å, and is the atomic oscillator strength. In the absence of unresolved saturated structure the profile of a line is a valid, instrumentally-blurred representation of the true column density distribution as a function of velocity, . In the case of interstellar O VI absorption, the absorption profiles are typically broad enough to be fully-resolved by the FUSE spectrographs (e.g., see Savage et al. 2000). In the few cases where the weaker O VI 1037.617 Å line is clean enough to allow a comparison with the stronger line, no evidence for unresolved saturation has been found.
Table 4 lists the derived O VI the equivalent widths and column densities for the LMC material. The error estimates in Table 4 include contributions from statistical (photon) uncertainties and uncertainties in the continuum polynomial coefficients (see Sembach & Savage 1992). The effects of a flux zero-level uncertainty are dex.
Also given in Table 4 is the range of velocities over which the absorption profile was integrated to yield the measurements given for the LMC material. The separation between Milky Way and LMC absorption is not always clearly demarcated in the spectra (see Figure 3). The separation is quite clear for the sight lines towards Sk–6705, Sk–6769, Sk–66100, Sk–67211, and Sk–66172. For the remaining sight lines, the derived properties of the LMC O VI absorption are somewhat dependent on the limits of the velocity integration. For the cases where the separation between the Milky Way and LMC absorption is not clear, we have adopted a standard lower velocity of km s-1, which is roughly typical of the sight lines for which the separation is relatively clear. For all of our measurements of the LMC O VI column densities, we have also derived these column densities at velocities km s-1 from the assumed lower velocity limit. The difference between the columns derived with these limits and that derived using the limits quoted in Table 4 is then treated as a uncertainty and added in quadrature to the statistical and continuum placement uncertainties discussed above. The estimated uncertainties derived using these km s-1 integration limits were in the range 0.02 to 0.09 dex ( to ), with an average of dex ().
4 Content and Distribution of O VI within the LMC
In this section we discuss the total column densities and distribution of interstellar O VI within the LMC. The stars in this work were chosen to have early spectral types and well-behaved O VI P Cygni profiles. Many of the stars in the sample were observed in order to study their stellar properties. As such we have not selected these sight lines based solely upon the properties of the LMC ISM in these directions. Even so, these sight lines probe a variety of physical regions within the LMC. We discuss the physical environments of the individual sight lines and compare the general distribution of O VI absorption with that of the gas traced by H and X-ray emission.
4.1 Total Line-of-Sight O VI Column Densities
The integrated LMC O VI column densities span the range to 14.6 (in units of atoms cm-2), i.e., a factor of . We have detected O VI absorption along all of the sight lines presented in this work. This is suggestive of a high surface covering factor of O VI in the LMC. We are hesitant to place too much emphasis on this result given that we have selected only early O and WR stars as background probes. The effects of the high wind luminosities of these stars on their local environments could in principle provide some of the observed O VI column densities. Figure 4 shows the column density of LMC O VI as a function of the spectral type of the background star. While there is no evidence for a dependence on spectral type, we sample a limited range of spectral types.
The statistics of the O VI column densities along the sight lines presented in this work are summarized in Table 5, including the straight and weighted means, standard deviation, and median of the sample. We give these statistics for the full sample of 12 stars shown in Table 4 and for the sample without the star Sk–6705. The sight line to this star was discussed by Friedman et al. (2000). Because of its late spectral type (O9.7 Ib) and relatively complex stellar continuum, we would not have included it in our sample had it not been discussed in detail previously. The medians and unweighted means of the two samples are very similar. We will henceforth discuss the values from the entire sample, with the caveat that one of our twelve sight lines may suffer from different systematic effects than the others.
As shown in Table 5, the average of the LMC column density measurements is with a standard deviation of ( dex). The logarithm of the median of the measurements is 14.38. There is significant variation in the column densities between the individual sight lines. The separations of the background probes used here range from to ( to 4550 pc)333Throughout this work we adopt the canonical distance of 50 kpc to the LMC.. Over the four smallest separations probed (450 to 510 pc), the absolute differences in the logarithmic column densities are 0.15, 0.17, 0.20, and 0.37 dex, corresponding to linear ratios of 1.41, 1.48, 1.58, and 2.34. The last value is for the Sk–6705/Sk–6720 pair, which we point out because of the potential uncertainties associated with the former star. We will discuss the distribution of O VI column densities more fully in §4.2.
An obvious point of comparison for interpreting the column densities of O VI in the LMC is the Milky Way. Savage et al. (2000) reported the first FUSE observations of interstellar O VI absorption in the disk and halo of the Milky Way as seen in the spectra of 11 active galactic nuclei (AGNs). These authors report a patchy distribution of O VI within the Milky Way halo. Defining the column density of O VI projected onto the plane of the Galaxy by , the sample of column densities in the Savage et al. (2000) sample has a mean (std. dev.), with a median of 14.21 and a full range to 14.64 (a factor of range). In a plane-parallel exponentially-stratified layer the quantity is simply the product of the midplane density, , and the exponential scale height, , of the distribution. Adopting a midplane density of cm-3 based on Copernicus observations (Jenkins 1978), Savage et al. find implied exponential scale heights in the range to 7.0 kpc. Assuming an irregular distribution of absorbing clouds they derive a scale height for the clouds of kpc.
In order to compare the observed column densities in the LMC with those observed looking out from our position in the Galactic disk toward distant AGNs, it is useful to convert the LMC values to column densities projected perpendicular to the plane of the LMC, , similar to the treatment of Savage et al. (2000). In the case of the LMC, that requires correcting the observed column densities for the inclination of the LMC. The inclination of the LMC is typically defined in terms of the angle of the disk plane from the plane of the sky, with values in the literature typically near (e.g., Westerlund 1997). Hence, the correction factor is not the sine, but rather the cosine of the inclination from the plane of the sky. We find with the log of the median value being 14.30.
The average column density of O VI projected onto the plane of the LMC in our sample of 12 sight lines is identical to that projected onto the disk of the Milky Way, with the same degree of variation. We note that the same calculations excluding the sight line towards Sk–6705 yield an average column density higher by dex () with a lower standard deviation. We will discuss the implications of this comparison of the hot gas content of the Milky Way and LMC more fully in §6.
4.2 Comparison with Other Views of the LMC
The ISM of the LMC has been studied extensively over a range of wavebands. Given its proximity, these studies have provided a wealth of information on the warm ( K) ionized gas traced through its H emission and hot ( K) ionized material traced through its X-ray emission. Surveys of the former, in particular, have been used to identify large-scale structures in the ISM of the LMC that trace the feedback of energy from massive stars into the ISM (Henize 1956; Davies et al. 1976; etc.). H imaging observations have revealed the presence of ionized structures on almost all scales, including H II regions, supernova remnants (SNRs), superbubbles, and “super-giant shells” (SGSs). The latter two classes of H-emitting structures are the most prominent with projected diameters of to pc.
4.2.1 Comparison with H Distribution
Many of the stars in our FUSE sample are projected onto prominent H-emitting structures. Table 6 lists the identification of any nebulosity and describes the general interstellar environments for each sight line. The identifications and descriptions rely heavily on previous studies. Examining Table 6 one can see a range of the general interstellar environments probed, including sight lines that are projected onto very faint H emission associated with diffuse H II regions as well as objects that are projected onto prominent shells that have been identified as superbubbles. Several sight lines also probe the SGS LMC 4. Thus, while our sample of sight lines is small, it seems to probe a wide variety of physical regions.
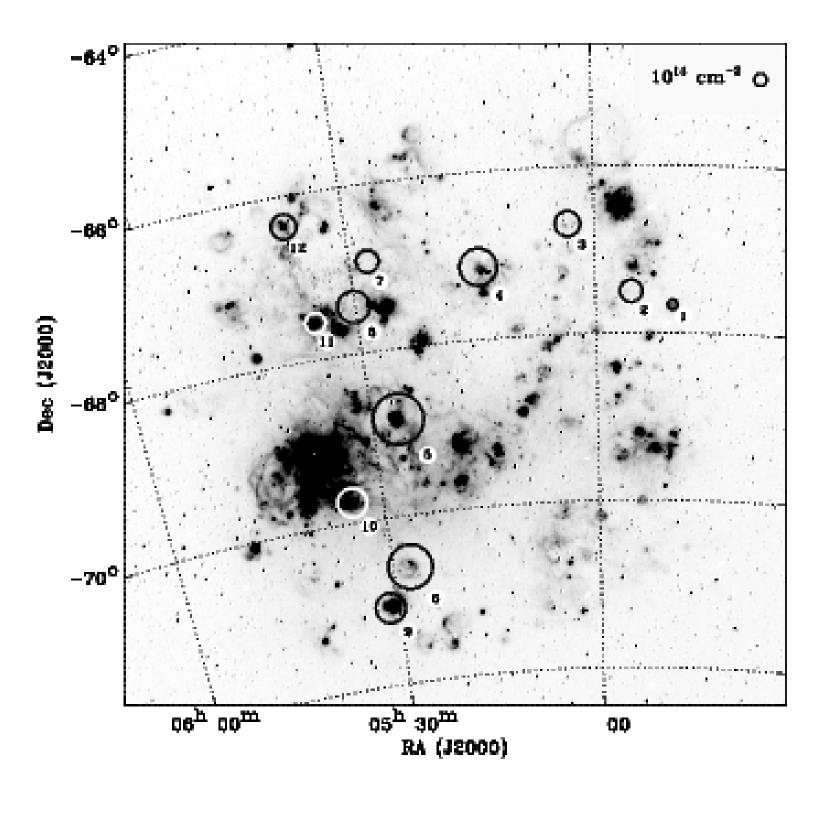
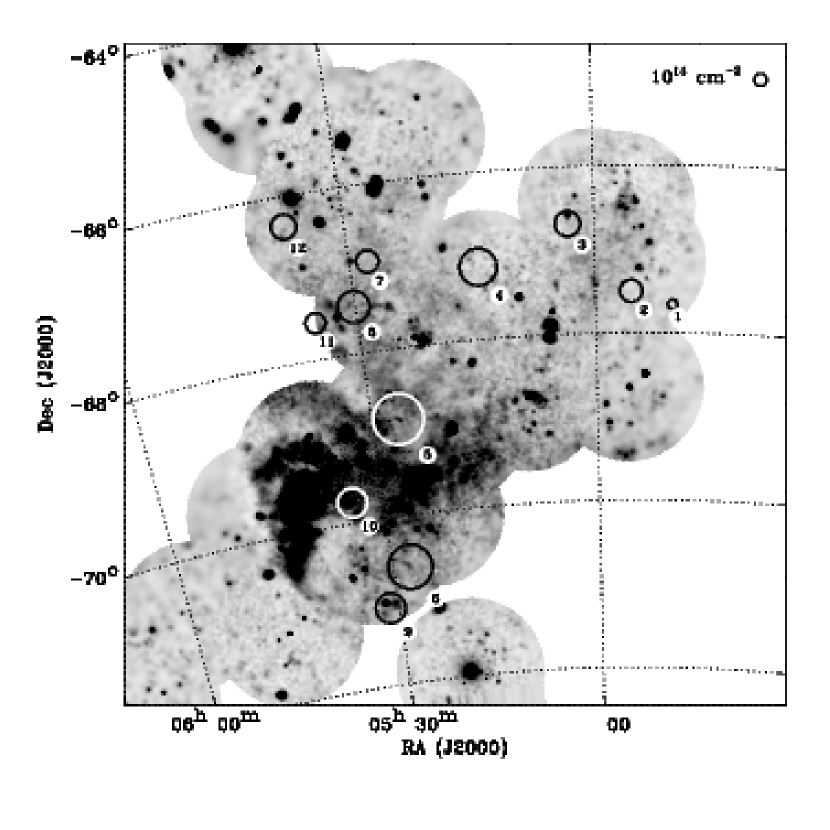
Figure 5 presents a representation of the interstellar O VI column densities as a function of position on the sky overlaid on an H image of the LMC (Gaustad et al. 2001). The directions probed by our O VI measurements are marked with circles whose radii are linearly proportional to the integrated LMC O VI column densities along these lines of sight. Hence, Figure 5 shows a “map” of the O VI column density across the face of the LMC. A number is given next to each circle that denotes each sight line with the ID given in Table 4, and the circle in the upper right of the figure gives the scale for cm-2. More detailed views of the H-emitting gas projected near these sight lines can be found in Danforth et al. (2002).
Figure 5 gives an interesting view of the O VI distribution within the LMC. This figure demonstrates that relatively strong O VI absorption is present in regions where the ISM traced by H is relatively quiescent. For example, the lines of sight to Sk–6720, Sk–6651, and Sk–6769 (numbers 2 through 4 in Figure 5) all probe regions of only relatively diffuse H emission in quiescent regions of the galaxy (the bright spot near the last of these is due to an incompletely-subtracted foreground star), though their O VI column densities exceed cm-2.
It can also be seen from Figure 5 that several stars (e.g., Sk–66100, Sk–67144, and Sk–66172 – numbers 7, 8, and 12) probe the periphery or interior of the SGS LMC 4, a 1400 pc diameter ring delineated by H II regions and encompassing an H I void (Kim et al. 1998) centered at ; . Furthermore, those lines of sight south of are all projected onto previously-identified “supershells” in H and X-ray studies (e.g., Dunne, Points, & Chu 2001). While two of these four sight lines exhibit the largest column densities in our sample (Sk–6880 and Sk–7145 – numbers 5 and 9, which probe N144 and N206, respectively), the other two have column densities consistent with the median of the sample.
The O VI column densities observed along our 12 sight lines seem to have little relation to the observed morphological structure of H emission (Gaustad et al. 2002) in these directions. Furthermore, there is no relationship between the observed O VI column densities and the local star formation rate as traced by the intensity of the H emission. Figure 6 shows the observed O VI column densities as a function of the relative H intensity integrated over (100x100 pc2) regions surrounding the target stars. The range in H surface brightness measurements is much larger than the range in O VI column densities.
The sight lines probing superbubbles and supergiant shells have O VI column densities quite similar to those projected onto more quiescent regions of the galaxy, and our derived O VI column densities have no observable relationship to the local H intensity within the LMC. Thus, there is no evidence for large enhancements in the O VI column densities associated with large-scale structures or high levels of local star formation. As discussed in §6, this is consistent with a scenario in which much of the observed O VI resides in an extended, but patchy, distribution such as a galactic “corona.”
4.2.2 Comparison with X-ray Distribution
Hot ionized material in galaxies can also be revealed through observations of its X-ray emission. The general distribution of X-ray emission in the LMC has been studied with several instruments including the Einstein Observatory (Wang et al. 1991) and ROSAT (Snowden & Petre 1994). These studies have discussed the observations in the context of the diffuse, hot ISM in the LMC. Many studies detailing various aspects of individual regions of the LMC have also been published. The most relevant for comparison with this work are recent summaries of X-ray emission from superbubbles (Dunne et al. 2001) and large-scale diffuse regions, including SGSs (Points et al. 2001). These works include discussions of diffuse X-ray emission from some of the structures (regions) probed by our absorption line measurements.
In general it is difficult to study the soft X-ray emission from the LMC given the relatively large foreground photoelectric opacity. Unfortunately, this is the waveband that is most likely to correspond to the material being traced by our O VI absorption line measurements. However, the harder X-ray emission traces gas at relatively high temperatures ( K) which will presumably cool through the temperatures ( K) at which O VI is expected to be most abundant. Therefore, one might expect at least a loose connection between these two tracers of hot ionized matter. Figure 7 shows the ROSAT PSPC mosaic of the LMC from Snowden & Petre (1994) with the O VI columns from this work displayed as in Figure 5. The X-ray mosaic makes use of the R4 to R7 filters of the PSPC, which are sensitive to to 2.0 keV photons, and has been adaptively smoothed, as discussed in Snowden & Petre. This energy range is non-uniformly affected by photoelectric absorption by LMC and Milky Way gas. Point sources (e.g., X-ray binaries and background AGNs) have not been removed.
The main purpose of presenting this mosaic in comparison with our O VI measurements is to demonstrate that the sight lines probed in this work do not, in fact, probe regions of the LMC that are unusually X-ray bright. Our sample includes observations of a star projected onto the superbubble N144 and three sight lines projected onto the SGS LMC 4. Recent work on archival ROSAT PSPC data have shown that these regions do not have excessively high X-ray surface brightnesses (Dunne et al. 2001; Points et al. 2001). Indeed, supernova remnants are the largest contributors to the interstellar X-ray emission of the LMC, while superbubbles and SGSs are collectively more than a factor of two lower (Points et al. 2001). In general our sight lines do not probe regions where the amount of hot gas is atypically large for the LMC.
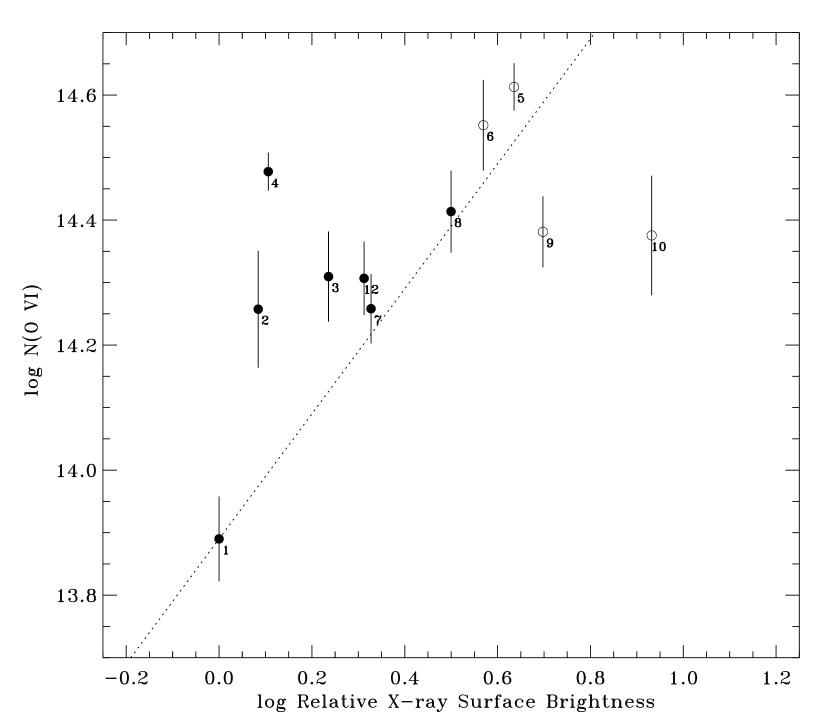
Figure 8 shows the observed O VI column densities compared with the relative X-ray surface brightness from ROSAT (Snowden & Petre 1994) for each sight line. The X-ray surface brightnesses were calculated for boxes (100 pc) on a side, centered on the star of interest. No correction for overlying photoelectric opacity has been made in deriving the X-ray brightnesses. A linear relationship of slope unity between the two datasets is shown with the dashed line in the plot. We note that if the lowest point is left out (representing the sight line towards Sk–6705), this diagram becomes a scatter plot with no discernible relationship between the O VI column density and X-ray surface brightness measurements. Indeed, a Spearman’s rank-order correlation test (Press et al. 1992) cannot rule out the null hypothesis that the O VI columns and X-ray surface brightnesses are uncorrelated at the level. The significance of any correlation between the quantities is small. Given the very different way in which these measurements are made, the differing systematics to which they are subject, and the different gas traced by each approach, it would be surprising to find a significant correlation.
The four sight lines in our sample probing superbubbles are denoted with open circles in Figure 8, while the other sight lines are marked with filled circles. The superbubble sight lines have the highest four X-ray surface brightnesses, though their O VI column densities are not so easily separated from the other measurements. This may suggest that local effects are more important for determining the hard X-ray brightness than they are for determining the O VI column densities. However, the ROSAT “beam” is much larger than that probed by our absorption line measurements, and we do not know that the stars used as background probes do indeed lie behind the gas associated with the superbubbles.
5 Gross Kinematic Properties of O VI within the LMC
Figure 3 demonstrates two items of note regarding the kinematics of the observed O VI absorption: 1) There is a large degree of variation in the observed kinematic profiles of the Milky Way/LMC absorption complex; and 2) Separating the Milky Way and LMC components is non-trivial in some cases. The identification of O VI absorption in the velocity range km s-1 with either of the two galaxies is particularly difficult. At lower velocities, profiles such as those seen towards Sk–66100, Sk–6769, and Sk–67211 strongly suggest a Milky Way (including high- and intermediate-velocity cloud) origin. However, there is not easily-identifiable separation between Milky Way and LMC absorption in profiles such as those towards Sk–7091 and Sk–6720. This ambiguity between the absorption from the two galaxies makes it difficult to definitively discuss the kinematics of the absorption from the LMC. In particular, some of the material in this intermediate range could be caused by outflows from the LMC with velocities of km s-1. If this is the case, it is an important aspect of the LMC O VI kinematics, although one that cannot be addressed by the current observations.
Even in the presence of such ambiguities, there is useful information on the kinematics of the LMC O VI within the observed absorption profiles. We discuss two particular aspects of the LMC O VI kinematics in this section: a comparison of the O VI velocity profiles with those of the lower-ionization material traced by Fe II; and the kinematic properties of the O VI in directions where there is a clear separation between the Milky Way and LMC absorption.
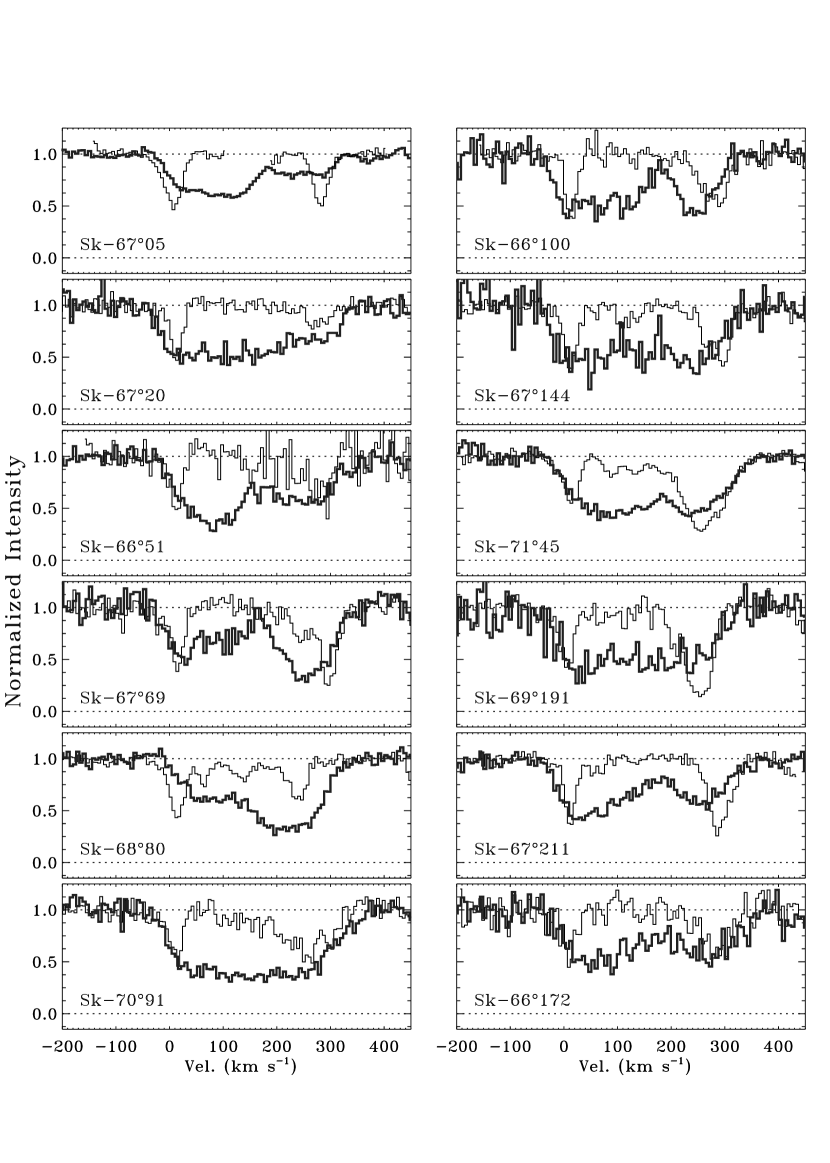
Figure 9 shows a comparison of the O VI 1031.926 absorption line profiles (cleaned of H2) with the Fe II 1125.448 profiles. The latter trace low-ionization gas associated with the relatively high column density warm neutral and warm ionized media in the Milky Way and LMC. Presumably most of the material in these cooler phases ( K gas) resides in or near the disk of each galaxy. Examining the Fe II profiles, one can see clear signatures of Milky Way, intermediate- and high-velocity clouds (IVCs and HVCs), and LMC absorption. All of the sight lines in our sample show evidence for either IVC and/or HVC absorption. Though these components are not always readily visible in the Fe II 1125.448 profiles, the stronger Fe II 1144.938 Å and O I 1039.230 Å transitions show this to be the case (see the profiles presented in Danforth et al. 2002). The LMC often exhibits multiple components or complex absorbing structure. The stronger Fe II 1144.938 Å transition often shows much lower column density components that are not visible in the Fe II 1125.448 profiles.
The individual Fe II components are more easily separated than those in the O VI profiles because the widths of typical Fe II absorption complexes is significantly lower than those seen in O VI absorption. Good examples of this effect are seen in the spectra of Sk–6769, Sk–6880, and Sk–67211. The differences between the Fe II and O VI absorption could be caused by larger thermal broadening within the hot ISM traced by the O VI absorption. While this is in part the case, we show below that the individual O VI absorbing complexes are much broader than expected from pure thermal broadening.
The O VI profiles almost always extend to lower velocities than the Fe II absorption. Furthermore, in cases where the LMC O VI absorption is well separated from the Milky Way, it tends to be somewhat symmetric and centered at velocities well below those of the Fe II absorption complexes. The Fe II absorption is often aligned with the high-velocity edge of the O VI absorption. Thus the O VI often appears to be kinematically decoupled from the Fe II, which traces material predominantly associated with the disk of the LMC.
A similar effect, but opposite in sign, can be seen when comparing the O VI and Fe II absorption from the Milky Way. The Fe II typically traces the low-velocity edge of the O VI absorption, the latter extending to much higher velocities. This may in part be caused by the stronger influence of the IVCs and HVCs on the O VI profile. However, because Galactic rotation Doppler shifts distant gas to positive velocities in this direction, much of this effect could also be caused by the larger vertical extent of O VI compared with Fe II.
Several sight lines show enough separation between the Milky Way and LMC O VI absorption that the detailed kinematic properties of the LMC absorption can be ascertained. We have fit Gaussian components to the apparent optical depth profiles for several lines of sight, deriving the average velocity, breadth, and peak optical depth for the LMC absorption seen towards these stars. We assume that the LMC absorption can be approximated by a single Gaussian component. In most cases this gives a reasonable approximation to the observed absorption profiles. In these cases we have also fit the Milky Way absorption to account for any minor blending with the LMC absorption. We do not report the Milky Way results here, particularly because there is a large degree of ambiguity when fitting the O VI profiles with multiple Gaussians.
The absorption profiles fit in this way include those towards the stars Sk–6769, Sk–66100, Sk–67211, and Sk–66172. Further decomposition of the profile towards Sk–7145 is discussed by Lauroesch et al. (2002). The most important aspect of these fits is the derived dispersion of the LMC O VI absorption. For the sight lines listed we derive , 30, 41, and 48 km s-1, respectively. The corresponding FWHM () values are , 71, 96, and 113 km s-1. This range of widths implies temperatures for the absorbing regions to K. If the observed gas is closer to the temperature at which the abundance of O+5 peaks in collisional ionization equilibrium ( K), most of the observed breadths of these profiles must be caused by non-thermal broadening mechanisms, including turbulence, multiple velocity components, and large-scale dynamical effects. Given the smoothness of the profiles observed at high signal-to-noise ratios, it seems likely that if this breadth is due to multiple absorbing components along the line of sight then several such components may be required.
Savage et al. (2002) have measured the apparent breadths of the absorption from the O VI within the halo (or thick disk) of the Milky Way as seen towards a large number () of extragalactic sources. These authors find to 65 km s-1 ( to 153 km s-1) with a median of km s-1. The observed breadths towards lower latitude sources may be affected by Galactic rotation, although many of their sight lines are at high enough Galactic latitudes that such effects are unimportant. The median breadth from these large number of measurements through the Galactic halo is essentially equivalent to that of the four LMC measurements (median km s-1). For comparison, Jenkins (1978) has discussed the breadths of nearby ( pc) disk O VI absorption as observed by Copernicus; he found an average dispersion of km s-1.
We have also fit Gaussian profiles to the observed Fe II absorption for the four sight lines listed above to determine the central velocities of the LMC Fe II. Of interest in these cases is the relative difference between the average velocities of the O VI and Fe II absorption. For this small sample of sight lines, we find that an average velocity difference, km s-1. The central velocity of the O VI is on average shifted by km s-1 relative to central velocity of the Fe II along these lines of sight. Because the O VI is significantly broader than the Fe II, much of the O VI absorption occurs at velocities significantly lower than the bulk of the Fe II absorption (which can be seen in Figure 9). This average velocity separation may not be typical of all of the sight lines since we have examined only those directions that show a clear separation between the Milky Way and LMC O VI absorption.
We note that our observations cannot be used to test the existence of high-velocity outflows from the disk of the LMC. Material separated from the LMC disk velocity by km s-1 is confused with Galactic ISM, IVC, and HVC absorption. In almost all of the sight lines there is O VI absorption at velocities shortward of the Fe II absorption associated with the LMC disk (but longward of the to km s-1 separation between LMC and HVC material). O VI absorption is usually not detected at positive velocities relative to the Fe II from the LMC disk. The two exceptions to this are Sk–6880 and perhaps Sk–7091. The Fe II profile towards the latter object shows several LMC components with similar strength, making the identification of the “disk” component somewhat ambiguous. Towards Sk–6880 O VI absorption extends to velocities km s-1 higher than the Fe II 1125.448 Å absorption. A very weak component can be seen in the Fe II 1144.938 Å line at km s-1, though the bulk of the Fe II absorption in this direction is centered at km s-1. The extended high positive-velocity absorption seen in the O VI profile towards Sk–6880 may be evidence for infalling material along this sight line. However, at least 10 of the 12 sight lines studied in this work reveal no such absorption, suggesting infalling highly-ionized material is rare in the LMC.
6 Discussion: the Hot Corona of the LMC
Our observations of interstellar O VI associated with the LMC reveal that this tracer of hot, collisionally-ionized gas is present in relatively large quantities across the whole face of the LMC, though with a large degree of patchiness. Lines of sight projected onto superbubbles and supergiant shells have much the same column densities as lines of sight projected onto quiescent regions (as indicated by H emission). The velocity distribution of the LMC O VI absorption is significantly different than that of lower-ionization gas (e.g., Fe II), being both much broader and present at lower absolute velocities.
The average column density projected onto the plane of the LMC () is equivalent to that projected onto the plane of the Milky Way, as determined by measurements of the Galactic halo towards extragalactic sources (Savage et al. 2000). The dispersion in the measurements of in the LMC and Milky Way is also the same. The kinematics of the highly-ionized gas traced by O VI in the LMC seems to be very similar to that seen through the halo of the Milky Way, although our ability to accurately measure the kinematic profiles of the LMC absorption is limited.
There are several possible interpretations of these salient aspects of the LMC O VI absorption observed towards our sample of 12 stars. However, given the striking similarities between the properties of the LMC O VI and the Galactic halo O VI, the relatively small impact of superbubbles on the total O VI column densities, the existence of significant quantities of O VI along sight lines with little evidence for local sources of highly-ionized material, and the general decoupling of the O VI kinematics from the disk material traced by Fe II, we favor an interpretation in which the LMC O VI absorption arises in a vertically-extended halo or corona similar to that seen about the Milky Way (see Savage et al. 2000).
6.1 Alternative Interpretations
Before exploring the O VI corona interpretation in more detail, it is worth mentioning alternatives to this scenario. Sembach et al. (2000) have presented observations of O VI in the HVC system surrounding the Galaxy. Most (if not all) sight lines that pass through known H I HVCs show O VI absorption, including the Magellanic Stream (MS), material tidally-expelled from the LMC/SMC system. If the MS has a component projected between the Sun and the LMC, the observed O VI at LMC velocities (or at the IVC and HVC velocities) could be associated with this tidal structure. For this to be true, however, the ionization state of the Stream in these direction would be significantly different than other directions probing this structure (and than most other HVCs). Given that the observed Fe II absorption can be associated with LMC disk material (see, e.g., Danforth & Chu 2000) and is typically centered well away from the center of the O VI absorption, relatively little low-ionization material could be associated with such a putative Stream component.
Another possibility is that the O VI absorption traces the interaction between the gaseous coronae of the LMC and Milky Way. The presence of O VI in the MS strongly suggests the Milky Way halo extends to the distance of that structure, which is roughly kpc from the Sun (see the discussion by Sembach et al. 2000). It is therefore reasonable to expect that the Galactic corona extends to the 50 kpc distance ( kpc) of the LMC. Interactions between the LMC corona (or other portions of this galaxy) with the low-density, highly-ionized medium associated with the extended distribution of hot gas of the Milky Way could, in principle, provide for instabilities that cool the gas through the transition temperatures at which O+5 is abundant. [de Boer et al. (1998) have similarly suggested that the motion of the LMC through the Galactic halo can trigger star formation through the compression of LMC material along the leading edge of the LMC by the low density Milky Way material.] Given the large number of unknowns regarding the structure of the ISM of the LMC and the extended Galactic halo, this model remains largely unconstrained. Unfortunately, at this point, it is difficult to falsify either of the previous models.
6.2 The Origins of O VI in the Corona of the LMC
The scenario we prefer is one in which the O VI within the LMC is distributed within the thin disk as well as in a more vertically-extended thick disk or halo of the LMC. Since our lines of sight probe large pathlengths through the halo component, this dominates over material associated with the disk, in a manner analogous to observations of extragalactic sources from within the disk of the Milky Way (Savage et al. 2000). The presence of a possible corona about the LMC has been discussed in the literature for several years. Early observations of C IV absorption towards LMC stars with the IUE observatory revealed highly-ionized material at velocities consistent with an LMC origin (Savage & de Boer 1979, 1981; de Boer, Koornneef, & Savage 1980; de Boer & Savage 1980). The early IUE measurements of LMC material were interpreted as absorption from an extended hot corona. That interpretation was subsequently called into question (Chu et al. 1994; Feitzinger & Schmidt-Kaler 1982) because of the strong possibility that the high ions observed were produced in the local environments of the observed stars. Wakker et al. (1998) used HST observations of C IV towards stars in quiescent regions of the LMC to argue that the LMC did indeed contain a highly-ionized corona. The data to date, however, have been too sparse to firmly detail the properties of the highly-ionized material in the LMC.
The O VI absorption in this coronal scenario traces material at relatively large distances from the disk that has been heated and ejected from the disk by some form of feedback between massive stars and the ISM. Most calculations suggest this requires the collective actions of multiple, correlated supernovae (particularly to raise the material far above the plane). There are several possible microphysical origins for the O VI within an extended corona about the LMC. Highly-ionized halo gas may trace material cooling from higher temperatures through the transition temperatures (a few K) at which O VI is abundant or material created in the interactions between cooler (e.g., K) and hotter (e.g., K) gases (e.g., in conductive interfaces or turbulent mixing layers). These two broad types of models have significantly different predictions for the O VI columns through a hot corona. As such, the interpretation of the observed O VI column density depends upon which microphysical situation is most applicable. We discuss the details of each of these models below.
6.2.1 Radiative Cooling Models
Edgar & Chevalier (1986) have calculated the column densities of highly-ionized species for gas cooling from temperatures K. They show that for cases where the cooling is dominated by metal line emission, the expected column density of O VI and the other high-ions is independent of metallicity. The expected column density of a metal ion, , in a column of cooling material is , where is the abundance of the element with respect to hydrogen, is the flux of cooling material (in ionized hydrogen atoms cm-2 s-1), and is the cooling time. The cooling time is inversely proportional to the abundance of metals, making independent of . This is important for the LMC because the abundance of oxygen is (Russell & Dopita 1992; see also Appendix of Welty et al. 1999), a factor of below the recently updated solar value of (Holweger 2001).
Because , where is the initial ionized hydrogen density of the cooling material, the column density of highly-ionized metals in the radiatively-cooling flows discussed by Edgar & Chevalier (1986) is proportional to , which, by conservation of mass is simply a velocity, . The Edgar & Chevalier calculations predict a column density of . This value is sensitive to the peak temperature from which the gas cools, which is assumed to be K. If the peak temperature is K, the column density is increased by a factor of . Using the mean value of from Table 5, the expected velocity associated with an Edgar & Chevalier-like flow is in the range to 60 km s-1. The lower portion of this range (which corresponds to higher initial cooling temperatures) is crudely consistent with the observed velocity separation between the O VI and Fe II absorption.
Since models of radiatively cooling gas predict the column density of O VI to be independent of metallicity, they provide a natural explanation for the similarities between the values of in the Milky Way and the LMC. For the Edgar & Chevalier models, so long as the ratio is similar in the two systems, the column densities of the observed O VI absorption should also be similar.
In the context of a cooling flow like that described by Edgar & Chevalier (1986), the column density of O VI is related to the mass flow rate out of the disk, :
| (3) |
In this expression is the mean mass per atom, and is the surface area of the flow region, which we take to be the disk of the LMC assuming a diameter of kpc, the diameter of the H I disk (Kim et al. 1998). For gas cooling under isobaric conditions from K, Edgar & Chevalier find . These values yield an estimate for the mass-flow rate from the near side of the plane of the LMC:
| (4) |
The initial density of the cooling gas, , is an unknown. Points et al. (2001) estimate electron densities of the X-ray emitting gas in the range cm-3 in their study of the X-ray emission from supergiant shells and diffuse gas in the LMC. Dunne et al. (2001) estimate electron densities of X-ray emitting gas in LMC superbubbles in the range cm-3. These estimates depend upon the estimated volume occupied by the X-ray emitting material, and a filling factor of unity for the material is assumed (the predicted densities increase as the assumed filling factor decreases). The O VI column densities themselves can also be used to crudely estimate density limits for the hot ionized material. If we assume that the pathlength through LMC material probed by our observations is no greater than the 7.3 kpc diameter of the LMC assumed above, the average density of O VI ions is cm-3. This corresponds to average ionized hydrogen densities of cm-3 assuming the fraction of oxygen in the form of O VI is at its maximum expected value of (Sutherland & Dopita 1992). The true density of ionized hydrogen in the O VI-bearing gas will likely be substantially larger since the fraction of space occupied by this material is likely to be small. We note, however, that the densities suggested by this crude treatment of the O VI column densities and the X-ray analyses (which are biased towards high density material that is more likely to be in the plane of the LMC) probably bound the physical ionized hydrogen density in the O VI-bearing gas.
The estimated mass-circulation rate from the LMC is a factor of lower than the values typically estimated for the Milky Way assuming the same initial densities. The main cause of this difference is the much different surface areas assumed for the disks of the two galaxies. The mass-flow rate per unit area of the disk for the LMC is
| (5) |
which should be closer to the Milky Way value for the same assumed densities.
6.2.2 Interface Models
Models in which the O VI ions occur in conductive interfaces or turbulent mixing layers (TMLs) make different predictions for the behavior of O VI column density with abundance. In the TML models, for example, the column density of O VI is related both to the specific properties of the mixing (e.g., the velocity shear and fraction of hotter material mixed into the turbulent layer) and the abundance of the oxygen in the material (Slavin et al. 1993). Therefore, in these models, the similarity in the Galactic and LMC values of may simply be a coincidence dictated by the lower abundance of the latter modified by a greater amount of transition temperature material in the LMC compared with the Milky Way.
Increased amounts of gas in the O VI-producing temperature range may be related to different energy input into the ISM by massive stars (and their corresponding supernovae), or to differences in the interaction between hot and cool gas between the two galaxies (determined by unknown mechanisms which may include the metallicity or differences in the magnetic fields). If we assume that the physics of the mixing between the galaxies is similar, the increased quantities of hot gas in the interface models requires a higher energy input into the ISM in the LMC compared with the Milky Way.
A larger local energy input from massive stars in the LMC has some observational support. Tumlinson et al. (2001) have studied the excitation and photodissociation of H2 in the LMC. Their models predict that the near-ultraviolet (NUV) flux per unit area of the LMC is a factor of higher than in the solar neighborhood of the Milky Way. If the NUV radiation field in the LMC is taken to be an indicator of the current density of massive stars, then this would argue for a correspondingly larger kinetic energy input into the ISM within the LMC through winds and supernovae.
Measures of the current star formation rate (SFR) and its surface density (which is more closely related to the energy input per unit area of the disk) also suggest the LMC should have a greater energy input into the ISM than the Milky Way. The SFR in the Milky Way is of order 2 to 5 M⊙ yr-1 (McKee & Williams 1997; McKee 1989; Mezger 1987), with average SFR per unit area of M⊙ yr-1 kpc-2, depending on the adopted SFR and area over which the average is determined. For the LMC, the SFR is estimated to lie between 0.25 and 1 M⊙ yr-1 (Kennicutt et al. 1995 and Klein et al. 1989, respectively). The former measurement is derived from H observations while the latter is from the thermal component of radio continuum measurements. Given the probable effects of dust on the former, the higher value is somewhat preferred. Kim et al. (1998) determine that the bulk of the H I column of the LMC (which should correspond to the bulk of the star formation) occurs within a disk of diameter kpc. This implies a current SFR per unit area of M⊙ yr-1 kpc-2 (with the higher value preferred). This also suggests a larger energy input per unit area in the LMC than in the local Milky Way, which would presumably lead to larger amounts of highly-ionized gas.
Distinguishing between the radiatively-cooling outflow and hot/cool gas interaction models as the origins of the observed O VI absorption will shed light on the structure and physics of a putative corona about the LMC and about the dependence of the feedback efficiency in galaxies on metallicity and stellar energy input. However, the current observations give little leverage for rejecting either class of models. The ratios of highly-ionized atoms in the gas can discriminate between pure radiatively cooling and TML-type models (see Spitzer 1996). Currently there are very few reliable observations of the other high-ion transitions (e.g., of C IV, Si IV, or N V) in the LMC. Bomans et al. (1996) have presented HST observations of C IV towards two stars projected within LMC 4, while Wakker et al. (1998) have presented HST observations of C IV absorption seen towards five stars within the “field.” None of these objects are included in the current sample of FUSE observations.
6.3 Kinematics of the LMC Corona
The kinematic profiles of Fe II and O VI along the sight lines in this work suggest that the O VI is kinematically decoupled from the thin interstellar disk of the LMC. The O VI is, on average, observed to be centered at velocities km s-1 from the Fe II centroids. There are two straightforward explanations for this kinematic offset of the O VI to more negative velocities: (1) rotation of a thickened disk or halo; and (2) outflow of highly-ionized material from the thin disk. Both of these explanations are compatible with our interpretation of the observed O VI properties of the LMC, i.e., that the O VI is indeed tracing a widely-distributed thick disk or halo of hot material.
A thickened disk of hot material that roughly rotates with the underlying thin interstellar disk of the LMC could produce the observed kinematic differences between the O VI and the Fe II. The ray from the Earth to a star in the disk of the LMC intersects the thin disk (traced by Fe II absorption) at essentially only the location of the star; however, because it is vertically-extended, the hot material (traced by O VI absorption) is sampled over a greater range of radial positions within the galaxy. Under the assumption of approximate corotation of disk and halo gas, this implies the O VI absorption will be observed over a greater range of velocities. In particular, assuming the H I velocity field (Kim et al. 1998) traces the rotation of the thin interstellar disk, the O VI is expected to occur at velocities generally lower than the Fe II in such a scenario. The maximum velocity of the O VI should be approximately equal to that expected of the thin disk at the position of the star, i.e., equal to the central velocity of the Fe II absorption. This is consistent with the velocity structure seen in Figure 9 (with a few exceptions).
A low-velocity outflow of highly-ionized material from the disk of the LMC could also explain the observed kinematic differences between the O VI and Fe II absorption profiles. If we assume that the outflow is purely perpendicular to the plane of the LMC, then the outflow velocity is , where is the observed outflow velocity and is the inclination of the LMC from the plane of the sky. Our observations then imply km s-1. The outflow of material from the disk is predicted in all models for the production of an interstellar galactic corona or thick disk. However, it is not clear whether one expects to observe O VI associated with the outflow or the subsequent infall of material in various models. Models that produce O VI in radiatively cooling material require that the material ejected from the disk cool sufficiently from the very high temperatures at which the gas originates to temperatures where O VI is expected to be abundant. The observation of O VI in the outflowing material of a fountain flow would imply that the cooling time of the material was less than or of the order the sound crossing time of the halo (Houck & Bregman 1990). If the cooling time is sufficiently long (e.g., for low densities or very high initial temperatures), cooling through the temperatures at which O VI is abundant will not occur until the material ejected from the disk reaches its highest point and begins to infall.
For all of the sight lines probed by our observations there is O VI absorption at velocities that could imply the outflow of highly-ionized (O VI-bearing) gas from the thin disk of the LMC. However, in only two cases (towards Sk–6880 and Sk–7091) is there O VI absorption at velocities that might imply the infall of highly-ionized material. If a large-scale circulation of material through a corona about the LMC is occurring the majority of the gas must cool in the outflow phase of the circulation. We note that the velocities of the observed O VI absorption are low enough relative to the disk of the LMC that the material will not escape the galaxy altogether.
7 Summary
We have presented observations of 12 early-type stars within the Large Magellanic Cloud obtained with the FUSE observatory. These observations reveal strong absorption from interstellar O VI within the LMC. The main conclusions of our work are as follows.
-
1.
Strong interstellar O VI at LMC velocities is present along all of the sight lines studied in this work. The observed stars probe a range of interstellar environments from stars within super-giant shells or superbubbles (e.g., Sk–7145, Sk–6880) to those in the field (e.g., Sk–6720, Sk–6705). A wide range of kinematic profiles for O VI within the LMC is also observed.
-
2.
The column density of interstellar O VI at LMC velocities ranges from to 14.6 in atoms cm-2, with a mean of (with a dispersion of ). The average column density projected perpendicular to the disk of the LMC is , which is identical to the value derived from observations of the Milky Way halo even though the metallicity of the LMC is times lower than that of the Milky Way. The dispersions of the individual measurements about the mean for each galaxy are also indistinguishable.
-
3.
While our observations probe several sight lines projected onto superbubbles or other large-scale structures, any enhancements in the O VI column densities over those observed for field stars are minor (). The column density variations over the smallest scales probed by our observations ( pc) are the same as those seen between sight lines towards and away from large-scale structures. Thus there is little evidence for enhanced O VI column densities towards superbubbles or other large-scale structures.
-
4.
The average velocities of the LMC O VI absorption are different than those of the Fe II absorption, which traces low-ionization material associated with the disk of the LMC. The O VI velocities are on average shifted by km s-1 from the peak low-ionization absorption. This systematic displacement of the O VI to lower velocities may be the signature of a low-velocity outflow from the disk or of a rotating thickened disk.
-
5.
Our measurements are not able to test for the existence of high negative velocity O VI in the LMC because of the overlap of Milky Way, IVC, HVC, and LMC absorption. The observations of all of the sight lines considered here are consistent with the presence of O VI outflowing from the LMC disk at relatively low velocities ( km s-1). Material at positive velocities relative to the LMC disk, which could trace infalling material, is only allowed along the sight lines towards Sk–6880 and possibly Sk–7091. The former sight line shows gas which may be infalling at velocities km s-1 relative to the LMC disk.
-
6.
The velocity dispersion of the O VI absorption is much greater than that of Fe II and other low-ionization species seen along the same lines of sight. The former is difficult to measure due to overlap between Milky Way and LMC absorption along many sight lines, but where measurable gives Gaussian dispersions of to 50 km s-1. These breadths are much broader than the expected thermal broadening ( km s-1 for K), suggesting the presence of several absorbing components within the LMC O VI profiles.
-
7.
We discuss the observed properties of interstellar LMC O VI in the context of a galactic “halo” or “corona” similar to that of the Milky Way. The striking similarity in the O VI columns and variations and in the observed velocity dispersions between the LMC absorption and that observed in the halo of the Milky Way motivate such a model. The observations are consistent with models of radiatively-cooling galactic fountain flows, although turbulent mixing layers and other types of interfaces are not ruled out. The radiatively-cooling fountain scenario is attractive since the predicted column density of O VI is not dependent on the metallicity of the cooling material.
-
8.
If the O VI is produced in a galactic fountain flow, then the mass flow from one side of the disk of the LMC is estimated to be M⊙ yr-1, or alternatively, the mass flow rate per unit area of the disk is estimated to be M⊙ yr-1 kpc-2. The cooling of this ejected material occurs before the gas begins to return to the disk. The average density of ionized hydrogen associated with the O VI-bearing gas likely exceeds cm-3; studies of X-ray emission in the LMC suggest cm-3, though this may sample denser gas than the O VI-bearing material. Better estimates of the physical state of the gas could be made with O VI emission line measurements towards the sight lines probed by our absorption line measurements.
References
- (1)
- (2) Bomans, D.J., de Boer, K.S., Koornneef, J., & Grebel, E.K. 1996, A&A, 313, 101
- (3)
- (4) Bregman, J.N. 1980, ApJ, 236, 577
- (5)
- (6) Brinks, E., & Bajaja, E. 1986, A&A, 169, 14
- (7)
- (8) Chu, Y.-H., Wakker, B.P., Mac Low, M.-M., & Garciía-Segura, G. 1994, ApJ, 108, 1696
- (9)
- (10) Conti, P.S., Garmany, C.D., & Massey, P. 1986, AJ, 92, 48
- (11)
- (12) Crowther, P.A. & Smith, L.J. 1997, A&A, 320, 500
- (13)
- (14) Danforth, C.W., & Chu, Y.-H. 2000, ApJ, 552, L155
- (15)
- (16) Danforth, C.W., Howk, J.C., Fullerton, A.W., Blair, W.P., & Sembach, K.R. 2002, in preparation.
- (17)
- (18) Davies, R.D., Elliott, K.H., & Meaburn, J. 1976, MmRAS, 81, 89
- (19)
- (20) de Avillez, M.A. 2000, MNRAS, 315, 479
- (21)
- (22) de Boer, K.S., Braun, J.M., Vallenari, A., & Mebold, U. 1998, A&A, 329, 49
- (23)
- (24) de Boer, K.S., Koornneef, J., & Savage, B.D. 1980, ApJ, 236
- (25)
- (26) de Boer, K.S., & Savage, B.D. 1980, ApJ, 238, 86
- (27)
- (28) Deul, E.R., & den Hartog, R.H. 1990, A&A, 229, 362
- (29)
- (30) Dunne, B.C., Points, S.D., & Chu, Y.-H. 2001, ApJS, 136, 119
- (31)
- (32) Edgar, R.J., & Chevalier, R.A. 1986, ApJ, 310, L27
- (33)
- (34) Feitzinger, J.V., & Schmidt-Kaler, Th. 1982, ApJ, 257, 587
- (35)
- (36) Friedman, S.D., et al. 2000, ApJ, 538, L39
- (37)
- (38) Garmany, C.D., & Walborn, N.R. 1987, PASP, 99, 240
- (39)
- (40) Gaustad, J.E., McCullough, P.R., Rosing, W., & Van Buren, D. 2001, PASP, in press (see astro-ph/0108518)
- (41)
- (42) Gräfener, G., Hamann, W.-R., Hillier, D.J., & Koesterke, L. 1998, A&A, 329, 190
- (43)
- (44) Heiles, C. 1990, ApJ, 345, 483
- (45)
- (46) Henize, K.G. 1956, ApJS, 2, 315
- (47)
- (48) Holweger, H. 2001, in “Solar and Galactic Composition,” Ed. R.F. Wimmer-Schweingruber, in press (astro-ph/0107426)
- (49)
- (50) Houck, J.C., & Bregman, J.N. 1990, ApJ, 352, 506
- (51)
- (52) Jenkins, E.B. 1978, ApJ, 220, 107
- (53)
- (54) Kennicutt, R.C., Bresolin, F., Bomans, D.J., Bothun, G.D., & Thompson, I.B. 1995, AJ, 109, 594
- (55)
- (56) Kim, S., Dopita, M.A., Stavely-Smith, L., & Bessell, M.S. 1999, AJ, 118, 2797
- (57)
- (58) Kim, S., Staveley-Smith, L., Dopita, M.A., Freeman, K.C., Sault, R.J., Kesteven, M.J., & McConnell, D. 1998, ApJ, 503, 674
- (59)
- (60) Klein, U., Wielebinski, R., Haynes, R.F., & Malin, D.F. 1989, A&A, 211, 280
- (61)
- (62) Koesterke, L., Hamann, W.-R., Schmutz, W., & Wessolowski, U. 1992, A&A, 248, 166
- (63)
- (64) Kuntz, K.D., & Snowden, S.L. 2000, ApJ, 543, 195
- (65)
- (66) Lamers, H.J.G.L.M., & Cassinelli, J.P. 1999, Introduction to Stellar Winds (Cambridge: Cambridge Univ. Press)
- (67)
- (68) Lauroesch, J.T., Meyer, D.M., Sembach, K.R., Howk, J.C., & Welty, D.E. 2002, in preparation.
- (69)
- (70) Lehner, N., Fullerton, A.W., Sembach, K.R., Massa, D.L., & Jenkins, E.B. 2001, ApJ, 556, L103
- (71)
- (72) Leitherer, C. 1988, ApJ, 334, 626
- (73)
- (74) Mac Low, M.-M., & McCray, R. 1988, ApJ, 324, 776
- (75)
- (76) Massa, D., Prinja, R.K., & Fullerton, A.W. 1995, ApJ, 452, 842
- (77)
- (78) Massa,D., Fullerton, A.W., Sonneborn, G.S., & Hutchings, J. 2002, in preparation.
- (79)
- (80) McKee, C.F. 1989, ApJ, 345, 782
- (81)
- (82) McKee, C.F., & Williams, J.P. 1997, ApJ, 476, 144
- (83)
- (84) Mezger, P.G. 1987, in Starbursts and Galaxy Evolution, ed. T.X. Thuan, T. Montmerle, and J. Tran Thanh Van (Paris: Editions Frontières), p.3
- (85)
- (86) Moos, H.W., et al. 2000, ApJ, 538, L1
- (87)
- (88) Norman, C.A., & Ikeuchi, S. 1989, ApJ, 345, 372
- (89)
- (90) Oegerle, W.R., Murphy, E.M., & Kriss, G.A. 2000, The FUSE Data Handbook
- (91)
- (92) Oey, M.S. 1996, ApJ, 467, 666
- (93)
- (94) Patriarchi, P., & Perinotto, M. 1992, A&A, 258, 285
- (95)
- (96) Points, S.D., Chu, Y.-H., Snowden, S.L., & Smith, R.C. 2001, ApJS, 136, 99
- (97)
- (98) Press, W.H., Teukolsky, S.A., Vetterling, W.T., & Flannery, B.P. 1992, “Numerical Recipes in C: The Art of Scientific Computing,” (Cambridge: Cambridge University Press)
- (99)
- (100) Prinja, R.K., & Crowther, P.A. 1998, MNRAS, 300, 828
- (101)
- (102) Puche, D., Westpfahl, D., Brinks, E., & Roy, J.-R. 1992, AJ, 103, 1841
- (103)
- (104) Puls, J., Owocki, S.P., & Fullerton, A.W. 1993, A&A, 279, 457
- (105)
- (106) Russell, S.C., & Dopita, M.A. 1992, ApJ, 384, 508
- (107)
- (108) Sahnow, D., et al. 2000, ApJ, 538, L7
- (109)
- (110) Savage, B.D., et al. 2000, ApJ, 538, L27
- (111)
- (112) Savage, B.D., et al. 2002, in preparation.
- (113)
- (114) Savage, B.D., & de Boer, K.S. 1979, ApJ, 230, L77
- (115)
- (116) Savage, B.D., & de Boer, K.S. 1981, ApJ, 243, 460
- (117)
- (118) Savage, B.D., & Massa, D. 1987, ApJ, 314, 380
- (119)
- (120) Savage, B.D. & Sembach, K.R. 1991, ApJ, 379, 245
- (121)
- (122) Savage, B.D. & Sembach, K.R. 1994, ApJ, 434, 145
- (123)
- (124) Sembach, K.R. 1999, ASP Conf. Ser. 166, Stromlo Workshop on High-Velocity Clouds, ed. B.K. Gibson & M.E. Putman (San Francisco: ASP), 243
- (125)
- (126) Sembach, K.R., et al. 2000, ApJ, 538, L31
- (127)
- (128) Sembach, K.R., & Savage, B.D. 1992, ApJS, 83, 147
- (129)
- (130) Shapiro, P.R., & Benjamin, R.A. 1991, PASP, 103, 923
- (131)
- (132) Slavin, J.D., Shull, J.M., & Begelman, M.C. 1993, ApJ, 407, 83
- (133)
- (134) Smith, L.F., Shara, M.M., & Moffat, A.F.J. 1990, ApJ, 358, 229
- (135)
- (136) Smith, L.F., Shara, M.M., & Moffat, A.F.J. 1996, MNRAS, 281, 163
- (137)
- (138) Smith, R.C. 1999, in New Views of the Magellanic Clouds, IAU Symp. #190, ed. Y.-H. Chu, N. Suntzeff, J. Hesser, & D. Bohlender, p.28
- (139)
- (140) Snowden, S.L., & Petre, R. 1994, ApJ, 436, 123
- (141)
- (142) Spitzer, L. 1996, ApJ, 458, L29
- (143)
- (144) Tumlinson, J., et al. 2001, ApJ, submitted.
- (145)
- (146) Wakker, B.P., Howk, J.C., Chu, Y.-H., Bomans, D., & Points, S.D. 1998, ApJ, 499, L87
- (147)
- (148) Walborn, N.R. 1977, ApJ, 215, 53
- (149)
- (150) Walborn, N.R. 1982, ApJ, 254, L15
- (151)
- (152) Walborn, N.R., Lennon, D.J., Haser, S.M., Kudritzki, R.-P., & Voels, S.A. 1995, PASP, 107, 104
- (153)
- (154) Wang, Q., Hamilton, T., Helfand, D.J., & Wu, X. 1991, ApJ, 374, 475
- (155)
- (156) Welty, D.E., Frisch, P.C., Sonneborn, G., & York, D.G. 1999, ApJ, 512, 636
- (157)
- (158) Westerlund, B.E. 1997, The Magellanic Clouds (Cambridge: Cambridge Univ. Press)
- (159)
- (160) Yan, Z.-C., Tambasco, M., & Drake, G.W.F. 1998, Phys. Rev. A, 57, 1652
- (161)
| Star | Alt. Name | (J2000) | (J2000) | V [mag] | Sp. Type | Ref.aaReference for the adopted spectral classification: (1) Walborn 1977; (2) Smith, Shara, & Moffat 1996; (3) Garmany & Walborn 1987; (4) Smith, Shara, & Moffat 1990; (5) Conti, Garmany, & Massey 1986; (6) Walborn et al. 1995; (7) Walborn et al. 2001. | [km/s]bbStellar wind terminal velocity. The terminal velocities for the WR stars often have larger uncertainties than those for the O stars. | Ref.ccReference for the adopted wind terminal velocities: (1) Patriarchi & Perinotto 1992; (2) Koesterke et al. 1991; (3) Crowther & Smith 1997; (4) Leitherer 1988; (5) Massa et al. 2001; (6) Prinja & Crowther 1998; (7) Gräfener et al. 1998; (8) Walborn et al. 1995. |
|---|---|---|---|---|---|---|---|---|
| Sk–6705ddThe Sk–6705 data used here are from the early-release observations of Friedman et al. 2000. | HD 268605 | – | 11.34 | O9.7 Ib | 1 | 1665 | 1 | |
| Sk–6720 | HD 32109 | 04 55 31.5 | –67 30 01.0 | 13.87 | WN4b | 2 | 2900 | 2 |
| Sk–6651 | HD 33133 | 05 03 10.2 | –66 40 54.0 | 12.69 | WN8h | 2 | 850 | 3 |
| Sk–6769 | 05 14 20.2 | –67 08 03.5 | 13.09 | O4 III(f) | 3 | 2600 | 4 | |
| Sk–6880 | HD 36521 | 05 26 30.4 | –68 50 26.6 | 12.40 | WC4+OB | 4 | ||
| Sk–7091 | LH 62-1 | 05 27 33.7 | –70 36 48.3 | 12.78 | O6.5 V | 5 | 3000 | 5 |
| Sk–66100 | 05 27 35.6 | –66 55 15.0 | 13.26 | O6 II(f) | 6 | 2075 | 6 | |
| Sk–67144 | HD 37026 | 05 30 12.2 | –67 26 08.4 | 14.30 | WC4 | 4 | 2600 | 7 |
| Sk–7145 | HD 269676 | 05 31 15.5 | –71 04 08.9 | 11.47 | O4-5 III(f) | 1 | 2500 | 5 |
| Sk–69191 | HD 37680 | 05 34 19.4 | –69 45 10.0 | 13.35 | WC4 | 4 | 2800 | 7 |
| Sk–67211 | HD 269810 | 05 35 13.9 | –67 33 27.0 | 12.26 | O2 III(f∗) | 7 | 3750 | 8 |
| Sk–66172 | 05 37 05.6 | –66 21 35.7 | 13.13 | O2 III(f∗)+OB | 7 | 3250 | 8 |
| Star | FUSE | Start | No. of | Exp. Time | S/N |
|---|---|---|---|---|---|
| IDaaArchival rootname of target for FUSE PI team observations. All data were processed with versions 1.8.6 or 1.8.7 of the CALFUSE pipeline. | DatebbStart date of the observations. For the data presented here, the data were all collected within a few days of the first exposures. | Exp.ccNumber of individual exposures. | [ksec] | ()ddApproximate signal-to-noise ratio per 20 km s-1 resolution element near the strong O VI transition at 1031.926 Å in the LiF1 channel. | |
| Sk–6705 | eeThe observations of this star have been described by Friedman et al. 2000. These data required special processing since the star was stepped across the LWRS aperture during the integrations. The data were acquired at various times between 08/20/1999 and 10/19/1999. | eeThe observations of this star have been described by Friedman et al. 2000. These data required special processing since the star was stepped across the LWRS aperture during the integrations. The data were acquired at various times between 08/20/1999 and 10/19/1999. | eeThe observations of this star have been described by Friedman et al. 2000. These data required special processing since the star was stepped across the LWRS aperture during the integrations. The data were acquired at various times between 08/20/1999 and 10/19/1999. | ||
| Sk–6720 | P11744 | 10/12/2000 | 6 | 16.3 | 20 |
| Sk–6651 | P11745 | 09/30/2000 | 4 | 4.6 | 18 |
| Sk–6769 | P11717 | 12/20/1999 | 4 | 7.8 | 15 |
| Sk–6880 | P10314 | 12/17/1999 | 4 | 9.7 | 24 |
| Sk–7091 | P11725 | 10/05/2000 | 1 | 5.5 | 18 |
| Sk–66100 | P11723 | 12/20/1999 | 2 | 7.1 | 17 |
| Sk–67144 | P11750 | 02/12/2000 | 3 | 8.1 | 10 |
| Sk–7145 | P10315 | 10/02/2000 | 4 | 18.9 | 25 |
| Sk–69191 | P11751 | 02/12/2000 | 3 | 7.0 | 11 |
| Sk–67211 | P11716 | 12/20/1999 | 5 | 8.2 | 21 |
| Sk–66172 | P11722 | 09/26/2000 | 1 | 3.6 | 13 |
| [Å] | ID | Notes | |
|---|---|---|---|
| 1031.191 | (6-0) P(3) | 1.059 | Contaminating line |
| 1006.411 | (8-0) R(3) | 1.199 | |
| 1019.500 | (7-0) P(3) | 1.029 | |
| 1028.985 | (6-0) R(3) | 1.253 | Blended: Ly |
| 1043.502 | (5-0) P(3) | 1.051 | Blended: MW R(4) |
| 1053.976 | (4-0) R(3) | 1.149 | |
| 1056.472 | (4-0) P(3) | 1.004 | Blended: MW R(4) |
| 1067.479 | (3-0) R(3) | 1.030 | |
| 1032.349 | (6-0) R(4) | 1.247 | Contaminating line |
| 999.268 | (9-0) R(4) | 1.219 | |
| 1023.434 | (7-0) P(4) | 1.031 | |
| 1035.181 | (6-0) P(4) | 1.067 | |
| 1044.542 | (5-0) R(4) | 1.209 | Blended: LMC P(3) |
| 1057.380 | (4-0) R(4) | 1.136 | Blended: LMC P(3) |
| 1060.581 | (4-0) P(4) | 1.017 | |
| ID | Star | [mÅ]aaEquivalent widths for the LMC material along the observed sight lines with error estimates. The error estimates include the effects of shifting the lower velocity integration limit by km s-1. | bbO VI column densities for LMC material along the observed sight lines with error estimates. In all cases these column densities have been derived using observations of the 1031.926 Å transition assuming no unresolved saturation is present. We adopt an -value of from the theoretical calculations of Yan, Tambasco, & Drake 1998. | ccVelocity range over which the LMC profile was integrated. |
|---|---|---|---|---|
| 1 | Sk–6705ddThe O VI column densities towards Sk–6705 are taken from Table 2 of Friedman et al. 2000 assuming their “upper” continuum placement. | |||
| 2 | Sk–6720 | |||
| 3 | Sk–6651 | |||
| 4 | Sk–6769 | |||
| 5 | Sk–6880 | |||
| 6 | Sk–7091 | |||
| 7 | Sk–66100 | |||
| 8 | Sk–67144 | |||
| 9 | Sk–7145 | |||
| 10 | Sk–69191 | |||
| 11 | Sk–67211 | |||
| 12 | Sk–66172 |
| Quantity | Linear | Logarithmic |
|---|---|---|
| Full Sample | ||
| Mean | 14.37 | |
| Weighted Mean | 14.25 | |
| Std. Deviation | ||
| Median | 14.38 | |
| New ObservationsbbStatistics for the sight lines excluding that towards Sk–6705. This star, described in detail by Friedman et al. 2000, has continuum placement uncertainties that likely exceed those of the rest of our sample. | ||
| Mean | 14.40 | |
| Weighted Mean | 14.35 | |
| Std. Deviation | ||
| Median | 14.38 | |
| IDaaIdentifications corresponding to the labels in Figures 5, 6, and 7. | Star | NebulositybbThe designations N and DEM refer to entries in the catalogs of Henize 1956 and Davies, Elliott, & Meaburn 1976, respectively. The designation KDSB GS refers to an entry in the Kim et al. 1999 catalog of “giant shells” identified in the Kim et al. 1998 H I mosaic of the LMC. | Description |
|---|---|---|---|
| 1 | Sk–6705 | N3/DEM7 | Diffuse, faint H II region |
| 2 | Sk–6720 | Field star | |
| 3 | Sk–6651 | DEM56 | Faint H II region |
| 4 | Sk–6769 | DEM107 | Faint H II region on periphery of KDSB GS 44 |
| 5 | Sk–6880 | N144/DEM199 | Superbubble projected onto LMC 3 |
| 6 | Sk–7091 | N204/DEM208 | Superbubble |
| 7 | Sk–66100 | Interior of LMC 4 | |
| 8 | Sk–67144 | Periphery of LMC 4 | |
| 9 | Sk–7145 | N206/DEM221/KDSB GS70 | Superbubble |
| 10 | Sk–69191 | N154/DEM246/KDSB GS72 | Superbubble |
| 11 | Sk–67211 | N59A/DEM241 | Bright H II region |
| 12 | Sk–66172 | N64B/DEM252 | Bright H II region on periphery of LMC 4 |