A submillimetre difference between radio galaxies and radio quasars: evidence for quasar-heated dust and synchronized submillimetre and radio source activity
Abstract
We present submillimetre photometry of 11 3CR and 6CE radio quasars of similar 151-MHz radio luminosity and redshifts to the radio galaxies studied at by Archibald et al. (2001). We detect all bar one quasar at 850 , and five quasars are confirmed as dusty hyperluminous objects by detections at shorter wavelengths. Our observations reveal a clear difference between the submillimetre luminosity distributions of the radio quasars and a matched sample of radio galaxies: the quasars are -times brighter than the radio galaxies and -times brighter accounting for possible synchrotron contamination. This difference is in quantitative agreement with a receding-torus unified scheme for radio sources in which the torus opening angle depends on quasar optical luminosity, provided that there is a close relationship between the optical and submillimetre luminosities. The implication is that quasar-heated dust dominates the submillimetre emission for powerful radio quasars at . We find a significant anti-correlation between submillimetre/far-infrared luminosity and radio source age in the sense that hyperluminous quasars tend to be associated with young ( yr) sources. This suggests that the processes controlling are synchronized with the jet-triggering event and that declines on a yr timescale. There is evidence for a small amount of obscuration in the hyperluminous quasars from reddening and associated or broad absorption lines. We speculate that shortly after jet triggering, dust is more widely distributed than at later times and is heated by the quasar nucleus and/or a short-lived synchronized starburst. Any such starburst would form only a few per cent of the total stellar mass in agreement with the evidence for dominant old stellar populations in radio galaxies. In contrast, high-redshift () radio galaxies with similar submillimetre luminosities could have longer star-formation timescales due to the greater availability of gas and could be forming the bulk of their stellar populations.
keywords:
galaxies: active – galaxies: evolution – quasars: individual: 3C 268.4, 3C 298, 3C 318, 6C 1045+35131 Introduction
Submillimetre observations provide an excellent method of detecting dusty star-forming galaxies at high redshifts: UV radiation from hot stars is absorbed by dust, re-radiated in the far-infrared and redshifted into the submillimetre. The steep submillimetre spectral index leads to large -corrections which, at high redshifts, compensates for increasing cosmological dimming so that an object with a given submillimetre luminosity has a similar observed flux-density at to a similarly-luminous one at (Blain & Longair 1993).
Powerful radio sources can be easily identified out to high redshifts and are thought to be associated with massive elliptical galaxies, or their progenitors. The existence of this close association is well known at low-to-intermediate redshifts (e.g. Owen & Laing 1989) and it is likely to be maintained to higher redshifts by scaling relations between radio luminosity, accretion luminosity, black hole mass and (dark matter) halo mass (e.g. Rawlings & Saunders 1991; Magorrian et al. 1998). At low-redshifts, radio galaxies appear to be kinematically-relaxed massive ellipticals (McLure et al. 1999; Dunlop et al. 2001; Bettoni et al. 2001) with old stellar populations (Nolan et al. 2001). These facts, together with the small scatter in the near-infrared Hubble diagram to (Jarvis et al. 2001a), suggest that most of the star formation in powerful radio galaxies occurred at early cosmic epochs.
In the first large study of the submillimetre emission of high-redshift radio galaxies, Archibald et al. (2001; hereafter A01) made sensitive (850 m sensitivity mJy rms) submillimetre observations of 47 radio galaxies with the SCUBA array on the JCMT. Their sample covered the redshift range and they detected dust emission in 14 objects. The main result of their study was a clear difference between the detection rate at of 15% and the detection rate at of 75%. This indicates that the submillimetre luminosity of radio galaxies increases systematically with redshift, suggesting that the bulk of star formation in radio galaxies, and by inference in all massive galaxies, occurred at epochs corresponding to high redshifts.
| Name | Class | Redshift | ||||||||
|---|---|---|---|---|---|---|---|---|---|---|
| W/Hz/sr | mJy | W | kpc | (mJy) | (mJy) | limit | limit | |||
| 3C 181 | Q | 1.382 | 28.11 | 6.0 | 37.37 | 48.0 | – | 15 | ||
| 3C 191 | Q | 1.952 | 28.52 | 38.3 | 37.21 | 41.1 | – | – | ||
| 3C 205 | Q | 1.534 | 28.19 | 24.6 | 37.00 | 152.4 | – | 27 | ||
| 3C 268.4 | Q | 1.400 | 27.97 | 42.9 | 37.25 | 91.9 | – | 35 | ||
| 3C 270.1 | Q | 1.519 | 28.24 | 60.0 | 36.51 | 101.6 | – | 38 | ||
| 3C 280.1 | Q | 1.659 | 28.36 | 36.0 | 36.72 | 39.8 | – | 48 | ||
| 3C 298 | Q | 1.439 | 28.57 | 515 | 37.26 | 12.7 | – | 47 | ||
| 3C 318 | Q | 1.574 | 28.11 | 22.0 | 37.18 | 6.8 | – | – | ||
| 3C 432 | Q | 1.785 | 28.31 | 7.5 | 36.68 | 109.8 | – | 45 | ||
| 6C 0955+3844 | Q | 1.405 | 27.45 | 4.3 | 36.58 | 181.3 | 2.22 | 25 | ||
| 6C 1045+3513 | Q | 1.594 | 27.22 | 10.0 | 35.94 | 1.7 | – | – | ||
| 4C 13.66 | G | 1.450 | 28.09 | 0.8 | 36.63 | 50.7 | – | 36 | ||
| 3C 239 | G | 1.781 | 28.42 | 0.5 | 36.38 | 94.6 | 2.83 | 37 | ||
| 3C 241 | G | 1.617 | 28.11 | 5.0 | 36.75 | 7.7 | 3.69 | 40 | ||
| 3C 294 | G | 1.786 | 28.39 | 0.5 | 36.97 | 126.7 | 1.75 | 32 | ||
| 3C 322 | G | 1.681 | 28.21 | 2.2 | 35.97 | 279.4 | 2.12 | 32 | ||
| 3C 437 | G | 1.480 | 28.11 | 0.1 | 36.38 | 291.0 | 1.96 | 37 | ||
| 3C 470 | G | 1.653 | 28.15 | 2.0 | 35.93 | 203.2 | – | 124 | ||
| 6C 0820+3642 | G | 1.860 | 27.55 | 1.0 | 36.00 | 193.8 | – | 50 | ||
| 6C 0901+3551 | G | 1.904 | 27.46 | 0.5 | 36.12 | 21.9 | 2.30 | 16 | ||
| 6C 0905+3955 | G | 1.882 | 27.71 | 1.1 | 35.76 | 934.5 | – | 64 | ||
| 6C 0919+3806 | G | 1.650 | 27.53 | 6.0 | 34.96 | 88.1 | 2.10 | 31 | ||
| 6C 1204+3708 | G | 1.779 | 27.61 | 1.0 | 36.45 | 435.2 | 2.66 | 98 |
Unified schemes for radio galaxies and radio quasars222 We will use the term ‘radio quasars’ to refer to lobe-dominated steep-spectrum radio sources associated with quasar nuclei. These are the dominant population of radio-loud quasars in low-frequency-selected samples such as 3CRR and 6CE, whereas compact flat-spectrum quasars dominate in high-frequency-selected samples. Flat-spectrum quasars often have high submillimetre fluxes simply by virtue of a continuation of their synchrotron spectra from radio to shorter wavelengths.propose they are the same objects viewed along different lines-of-sight, such that in radio galaxies the nuclear regions are obscured by a dusty torus or warped disc (Scheuer 1987; Barthel 1989). Such theories have proved remarkably successful (see Antonucci 1993 for a review), at least at high radio luminosities (Willott et al. 2000a). For objects at redshifts , the observed 850 m radiation was emitted at a rest-frame wavelength of m. At these wavelengths, dust is expected to be optically thin and its thermal emission isotropic (e.g. Granato & Danese 1994; Efstathiou & Rowan-Robinson 1995). Therefore, according to the simplest type of radio-loud AGN unification scheme, the submillimetre properties of radio galaxies and radio quasars, matched in terms of low-frequency radio luminosity and redshift, should be similar. In more realistic unified schemes, however, they may not be expected to be identical. Rawlings & Saunders (1991) and Simpson (1998) have argued that samples of radio galaxies and radio quasars, matched in one orientation-independent quantity (i.e. low-frequency radio luminosity), are expected to have different distributions in a second orientation-independent quantity (i.e. [O III] emission line luminosity) if the two quantities are linked by a scaling relation with intrinsic scatter. The first motivation behind the work described in this paper was to explore unified schemes further by looking for significant differences between the submillimetre properties of radio galaxies and radio quasars matched in 151-MHz luminosity and redshift.
The second motivation behind this paper was to explore further the suggestion of Blundell & Rawlings (1999) that some part of the evolution in the submillimetre properties of radio galaxies with redshift is a selection effect linked to the inevitable youth of the highest-redshift radio sources from flux-limited samples. A01 have already considered this suggestion, arguing that it is not a primary driver of the observed redshift dependencies. However, with a small dynamic range in source age, and somewhat uncertain selection effects, the high-redshift sample of Archibald et al. is not ideally suited to a test of the idea that submillimetre properties might be correlated with the time since the jet-triggering event.
At A01 have already obtained submillimetre data on an unbiased sample of 3CRR and 6CE galaxies, and we aimed to complement these with new observations of a matched sample of radio quasars. In Section 2 we describe the observations and results. In Section 3 we consider the likely contribution to the measured submillimetre fluxes from an extension of the radio synchrotron spectrum. In Section 4 we consider explanations for our results. We present our conclusions in Section 5. The convention for all spectral indices is that flux-density . We assume throughout that , and .
2 Observations
We have defined a sample of radio quasars in the redshift range selected from two complete radio samples (3CRR – Laing, Riley & Longair 1983; 6CE – Rawlings, Eales & Lacy 2001) to compare with the radio galaxies from the same samples in the same redshift range in the study of A01. Due to scheduling reasons only 3CRR quasars within the Right Ascension range are included in our sample. These were supplemented with two quasars from the revised 3C catalogue (3CR – Spinrad et al. 1985). These two quasars, 3C 298 and 3C 280.1, are not included in the 3CRR sample due to reasons of low declination and radio flux-density just below the 3CRR limit, respectively. They are the only high galactic latitude quasars in the target redshift range in the 3CR sample which are not included in the 3CRR sample. The total sample consists of 11 quasars and the comparison sample extracted from A01 contains 12 radio galaxies (Table 1).
The sample of radio quasars was observed in photometry mode with the SCUBA bolometer array at the JCMT in March, April, October 1999, November 2000, February and April 2001. Observations were made simultaneously at 850 m and 450 m and the sensitivities reached at 850 m are mJy rms. The atmospheric zenith opacity at 850 m ranged from 0.16 to 0.52 with a median of 0.22. The data were reduced using the SURF package, following the same method as in A01 for consistency. The resulting flux-densities are given in Table 1 along with the data for the matched radio galaxy sample. Ten out of eleven radio quasars were detected at 850 m at significance (eight at ), compared with only four detections out of the twelve radio galaxies. At the shorter wavelength of 450 m, three quasars have detections, compared to none of the radio galaxies (although the quasar observations are generally more sensitive at 450 m than those of the radio galaxies due to the introduction of new filters in October 1999). The mean quasar is mJy and the mean radio galaxy is mJy. Therefore the quasars are brighter than the radio galaxies in the submillimetre by a factor of 5.
Relating the observed submillimetre flux-density to a submillimetre/far-infrared luminosity is not a trivial matter, given the poor constraints on the shape of the dust spectra for most sources which have only been detected at one or two wavelengths. Therefore, we adopt a template dust spectrum as has been determined from observations of a sample of similarly luminous (submillimetre/far-infrared luminosities ) objects by Priddey & McMahon (2001). This template consists of isothermal optically-thin dust with temperature K and emissivity index . For our adopted cosmological model and dust template, the observed m flux-density of a source with a given does not change appreciably over the redshift range to . The conversion between and for our adopted dust spectrum is . However, for higher dust temperatures or multi-temperature models (which are required to fit the infra-red SEDs of most luminous AGN – e.g. Rowan-Robinson 2000), could be up to an order of magnitude greater than this, so these values of should be treated as lower limits. Therefore the radio quasars we have detected with SCUBA have lower limits on their far-infrared luminosities in the range to . It is likely that many of them would be classified as hyperluminous infrared sources () if their far- and mid-infrared fluxes were measured. Throughout most of this paper we will use the observed submillimetre flux-density in preference to the far-infrared luminosity and thereby avoid uncertainty in due to the unknown dust spectral shape.
Five of the radio quasars are also detected at wavelengths shorter than 850m. 3C 191, 3C 318 and 6C 1045+3513 are detected at 450m with SCUBA and 3C 268.4, 3C 298 and 3C 318 are detected in the far-infrared by ISO and/or IRAS. These objects are discussed in further detail here.
2.1 Notes on objects detected at m
3C 191
The submillimetre spectral index of 3C 191 determined from the 850m and 450m fluxes is , consistent within with the value of , expected for our assumed dust template. We find that . The optical spectral slope is (Barthel, Tytler & Thomson 1990), quite similar to the typical radio quasar value of (Brotherton et al. 2001). This indicates that there is little reddening of the quasar light along our line-of-sight. However, 3C 191 has very strong associated absorption lines with a C IV absorption equivalent width of 6.1 Å (Anderson et al. 1987). Hamann et al. (2001) studied these absorption systems with high-resolution spectroscopy and determined the distance of the absorbers from the nucleus to be kpc with a corresponding characteristic flow time of years. The distances of the radio hotspots from the nucleus are of a similar size-scale (projected linear size=41 kpc), corresponding to an approximate age of the radio source of years (see Sec. 4.2).
3C 268.4

3C 268.4 is detected at m ( mJy) but not at m. Recent detections at m and m with ISO and at 1.3 mm with IRAM ( mJy) indicate a high far-IR luminosity and some synchrotron contamination of the mm fluxes (Andreani et al. 2001). Estimating the millimetre contamination by synchrotron emission is not a trivial matter due to the lack of other data at frequencies higher than 15 GHz (Fig. 1). For reasons to be discussed in Sec. 3 we expect the extended radio lobe spectrum to steepen sharply at high frequencies and the main synchrotron component in the millimetre regime to be the compact core. It is also clear in Fig. 1 that the core spectrum also steepens between 15 GHz and 1.3 mm. To estimate the synchrotron contamination to the m flux-density we assume a millimetre core spectrum with which gives mJy. As we will show below, the properties of the dust spectrum require a contribution to the m flux-density from dust which is in approximate agreement with this contribution from the core.
We have fitted the far-IR and sub-mm data with a range of thermal dust spectra. Using only the ISO fluxes and the m upper limit, the strongly peaked spectrum at m (observed frame) provides strong constraints on the dust temperature and emissivity index (Fig. 1). The best fitting values are K and for dust which is optically-thin at m and this spectrum gives an expected m flux-density of 2.7 mJy. The far-IR luminosity of this dust spectrum is . This value for the emissivity index is larger than usually observed (Priddey & McMahon 2001; Dunne et al. 2000) but requiring to be no larger than 2.0 gives a similar far-IR luminosity and a higher expected m flux-density of 4.0 mJy. Therefore we conclude that the dust contribution to the m flux-density is significant and independent of its actual value, and the object is classified as hyperluminous. 3C 268.4 is not heavily reddened in the rest-frame UV but does show strong C IV associated absorption (equivalent width Å; Anderson et al. 1987).
3C 298

The source with the highest 850 m flux-density in our sample is 3C 298. This quasar is extremely bright at all wavelengths from the radio through to X-rays. It was detected by IRAS at 60 m and by ISO at five wavelengths ranging from 12.8 to 170 m (Meisenheimer et al. 2001). 3C 298 has a strong radio core (515 mJy at 5 GHz; Akujor et al. 1991) but is lobe-dominated at GHz frequencies. The measured 1.3 mm flux-density of 14.1 mJy (Meisenheimer et al. 2001) shows that the core is still strong at millimetre wavelengths and makes a substantial contribution to the observed 850 m flux-density. We have fitted the SED of 3C 298 to attempt to determine the relative contributions of dust and synchrotron emission (Figure 2). This procedure is not trivial because the core spectrum appears to be fairly flat up to a rest-frame frequency of 200 GHz and then steepens sharply to at higher frequencies. However, the flux-density measurements at these high frequencies have large errors and are only from being consistent with , as is more common above the break in the core spectra of lobe-dominated quasars (e.g. Antonucci, Barvainis & Alloin 1990; van Bemmel & Bertoldi 2001). Therefore we assume a core with over the observed 1300 to 850 m range. We conclude that mJy of the 850 m flux-density is due to synchrotron radiation and mJy is due to thermal dust emission. The reason why this quasar was not detected at 450 m was due to the poor sensitivity caused by the high airmass of the observation. The submillimetre and far-infrared data can be equally well fit by thermal spectra with temperatures K (typical of starbursts) and K. The total IR luminosity of 3C 298 is .
3C 298 is a small radio source with projected linear size of 12.7 kpc. It shows very strong CIV associated absorption with equivalent width 4.5 Å (Anderson et al. 1987). The optical spectral slope is , which is redder than typical quasars. This reddening is most likely due to dust associated with the absorbing gas.
3C 318
In Willott, Rawlings & Jarvis (2000b) we have already studied the spectral energy distribution (SED) of 3C 318 and determined a total IR luminosity of (corrected for the cosmology used in this paper). The quasar optical spectrum is found to be reddened, indicating the presence of dust in the quasar environment. 3C 318 is a small (6.8 kpc) radio source.
6C 1045+3513
6C 1045+3513 is detected at both 850 and 450 m, with a submillimetre spectral index of . On the basis of the 850 m observations we find . In the Appendix we present new optical spectroscopy of this object, showing it to be a reddened quasar, similar to 3C 318. The spectrum also shows a CIV broad absorption feature. 6C 1045+3513 is the smallest radio source of the entire sample of quasars and radio galaxies with a projected linear size of just 1.7 kpc.
2.2 Comparison of radio quasars and radio galaxies
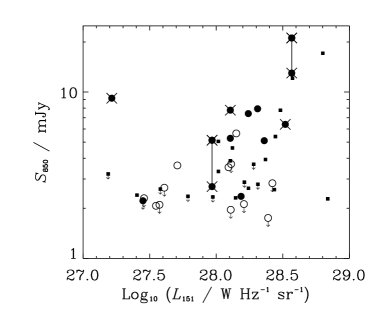
Fig. 3 plots the observed 850 m flux-density against low-frequency (151 MHz) radio luminosity for the matched quasar and radio galaxy samples. The main point to note from Fig. 3 is that there is a clear difference in the flux-density distributions of the quasar and radio galaxy samples, with the mean quasar submillimetre flux brighter by a factor of 5.333A second point to note from Fig. 3 is that there is only marginal evidence for a correlation between and . The survival analysis probability for a correlation being present is %. Removing the outlying point of 6C 1045+3513 increases the correlation probability to %. This matter has been discussed by Archibald et al. (2001), and we defer any further discussion to a wider investigation of the dependences of submillimetre luminosity on radio luminosity and redshift which will use new SCUBA data on radio sources from fainter samples than the 3CR and 6CE samples used here (Rawlings et al., in prep.).
Due to the large number of 850 m upper limits for the radio galaxies, we use survival analysis statistical tests which can account for these limits (Feigelson & Nelson 1985; Isobe, Feigelson & Nelson 1986). Using a variety of tests to compare the 850 m flux distributions of the quasars and radio galaxies (the Gehan, logrank and Peto-Prentice tests), the flux-density distributions are found to be different at % significance. Given the high fraction of upper limits for the radio galaxies, we cannot unequivocally determine the factor by which the quasars are brighter than the radio galaxies in the submillimetre. Using the above tests we find that the quasars are brighter than the radio galaxies by a factor at the 95% confidence level.
3 The synchrotron contribution to submillimetre fluxes
We have found the robust result that radio quasars have -times higher submillimetre fluxes than radio galaxies of the same radio luminosity and redshift. If this emission is due to optically-thin dust, then this is inconsistent with the notion of radio quasars and radio galaxies being identical apart from some orientation dependence. Given that the radio sources we are discussing are some of the most powerful known, it is essential that we consider whether the observed submillimetre fluxes could be affected by an extrapolation of the nonthermal radio synchrotron emission. Radio lobes and hotspots generally have a very steep spectrum at millimetre wavelengths and are unlikely to contribute significantly for many sources. This issue is discussed in detail in A01 where they find that extended synchrotron components very rarely contribute more than 1 mJy to the 850 m flux-density. However, A01 note that it is possible that two of the radio galaxy detections in our sample (3C 470 and 6C 0820+3642) become non-detections after correcting for synchrotron emission. We do not attempt to make any corrections for this in this paper, due to the large uncertainties involved in extrapolating the spectrum from radio frequencies. In Sec. 4.2 we will discuss this in terms of the angular extent of the radio sources with respect to the size of the SCUBA beam. Of course, radio quasars and radio galaxies would suffer equally from lobe or hotspot emission, so it cannot explain the difference in submillimetre properties between the two types of object.
The emission from radio cores and jets is beamed and Doppler boosting makes it highly orientation dependent. In the standard unification scheme, radio quasars have their jet axes closer to our line-of-sight and the enhanced Doppler boosting means that quasars have brighter cores than radio galaxies. Note that because the 3C and 6C radio samples were selected at low frequencies, where extended emission dominates, the quasars in our sample are lobe-dominated and not like the core-dominated blazars which are known to have fairly flat () spectra extending into the submillimetre regime (e.g. Gear et al. 1994). There have been few investigations of the radio–millimetre spectral indices of lobe-dominated quasar cores. This is due largely to the fact that their 5 GHz flux-densities are typically in the range mJy and, given that their core spectra are not flat, most have been below the sensitivity limit of many millimetre and submillimetre telescopes. In a study of six lobe-dominated quasars, Antonucci, Barvainis & Alloin (1990) find that the typical spectral index between 22 GHz and 230 GHz is . Van Bemmel & Bertoldi (2001) found the 5–250 GHz spectral indices of three radio quasars to all be . Athreya et al. (1997) compare radio galaxy, lobe-dominated and core-dominated quasar cores and predict that most lobe-dominated quasar cores are flat at GHz frequencies, but steepen at GHz (rest-frame). In Sec. 2 we showed that the core spectra of 3C 268.4 and 3C 298 are also likely to have . Another one of our quasar sample, 3C 280.1, has an IRAM 1.25mm flux-density of (Andreani et al. 2001). This suggests its core spectral index from 5 GHz to 1.25 mm is , again indicating that the m emission must contain a significant contribution from dust. The one example of a flat () millimetre spectral index for a lobe-dominated radio source is the unusual radio galaxy 6C 0902+34 (as discussed by A01). The radio properties of this object suggest its jet axis is at a small angle to our line-of-sight and dust obscuration prevents us from observing the nuclear source and classifying it as a quasar (Carilli 1995). Therefore, the available evidence suggests that the core millimetre spectral indices of (lobe-dominated) radio quasars are mostly steep (), but with a significant scatter such that some sources will have flatter core spectra.
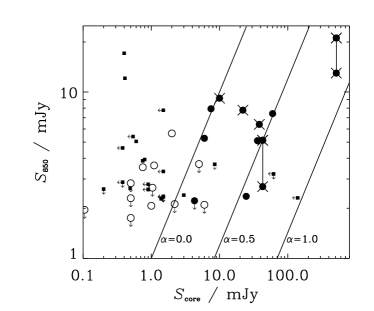
In Fig. 4 we plot against the radio core flux-densities at 5 GHz given in Table 1. As expected, the radio quasars have cores which are brighter than those of the radio galaxies by a factor . In Fig. 4 we also plot lines corresponding to the expected sub-mm flux-density of the core as a function of core flux-density for a range of spectral indices between 5 GHz and 850 m. 3C 298 has a core flux a factor of ten greater than any of the other quasars in our study. As we saw in the previous section, its core almost certainly makes a significant contribution to its 850 m flux of mJy. If the five quasars on the line all have spectra with then the synchrotron contribution to their 850 m fluxes is mJy, well below their detected fluxes with the exception of 3C 205. Flatter spectral indices of would be necessary for the cores to be responsible for the detections of all these quasars. In reality, it is likely that there is a spread in the GHz to millimetre spectral indices of the quasar cores such that a few of these quasar submillimetre detections might well be influenced by synchrotron emission.
Five of the radio quasars (3C 191, 3C 268.4, 3C 298, 3C 318 and 6C 1045+3513) are detected at shorter far-infrared wavelengths and from their SEDs we are confident that they are dusty hyperluminous objects (Sec. 2). For the other quasars, none of the 450 m non-detections are sensitive enough for us to be able to exclude the presence of a thermal dust spectrum being responsible for the observed 850 m emission. 3C 181 and 3C 432 have very weak cores, which are steep () at GHz frequencies and therefore their cores cannot be significant at 850 m, so we consider these as further secure detections of dust. The IRAM 1.25mm flux of 3C 280.1 suggests that its core component cannot account for all the observed 850 m flux. The remaining two submillimetre bright quasars (3C 205 and 3C 270.1) lie close to the line in Fig. 4 and we cannot yet be certain that we have detected dust in these objects. Given the available evidence of the likely range of core spectra, we suspect that one or two of these submillimetre detections will be dominated by synchrotron emission. Sensitive millimetre observations of these sources are needed to differentiate between synchrotron and dust. We thus repeated the statistical tests performed in Section 2, now assuming, conservatively, that the submillimetre detections of both of these quasars are due solely to synchrotron emission: the detections were replaced with non-detections of mJy. The mean quasar is now , still a factor of 4 greater than the mean radio galaxy of The survival analysis tests confirm that a statistical difference between the submillimetre fluxes of radio galaxies and quasars remains at 95% significance.
4 Why do some radio quasars have high submillimetre luminosities?
We have shown that core synchrotron emission may make a small contribution to the m fluxes of 3C radio quasars, but cannot explain all the submillimetre difference between quasars and radio galaxies. In Fig. 3 we showed that there is no systematic difference in the radio luminosities of the two types of object. In this section we consider whether there are any other differences between radio galaxies and quasars which may help to explain the difference in their submillimetre luminosities. The key to following our arguments is that we feel that in any realistic unified scheme we must go beyond the simplest model in which the probability of viewing a quasar nucleus is unity for a viewing angle , with constant, and zero at .
4.1 The effect of the intrinsic luminosity of the quasar
As discussed in Sec. 1 the idea that radio galaxies and radio quasars with similar low-frequency radio luminosities should have similar distributions in a second orientation-independent quantity is not quite true. For example, Simpson (1998) has quantified the factor by which quasars should have higher [O III] line strengths than radio galaxies, matched in radio luminosity, in the context of the receding-torus model for AGN (Lawrence 1991). Considering a population of quasars with a spread in optical luminosity, those quasars with higher optical luminosities have a larger torus opening angle due to the radius at which dust is sublimated being larger. Taking into account the scatter in the correlation between radio and optical luminosity, this means that sources with higher optical luminosities can be viewed within a larger opening angle and are thus more likely to be classified as quasars. An additional effect is that the larger opening angles allow a greater fraction of the ionizing continuum to escape, however this is not the dominant effect in this case. Simpson (1998) showed that this leads to a sample of radio quasars having a mean optical luminosity, as probed by their [O III] line luminosity, approximately twice that of a sample of radio galaxies of the same radio luminosity.

In Fig. 5 we plot against the [O III] emission line luminosity , which is emitted isotropically, believed to be produced outside any obscuring torus, and which is a good indicator of the ionizing luminosity (Simpson 1998). Correlation tests show that and for the radio quasars and radio galaxies are positively correlated at 95% significance. It is also apparent that the quasars do typically have higher than the radio galaxies. For the quasars the mean is and for the radio galaxies it is . Thus there is a factor of five difference in the mean [O III] luminosities of the two types of object in our sample. A similar difference between for the highest radio luminosity quasars and radio galaxies is also evident from Fig. 5 of Jackson & Rawlings (1997). In that study, all the objects have [O III] line observations made with the same wide slit, thereby eliminating uncertainties due to inhomogeneous datasets. This difference in emission line luminosity (and consequently ionizing luminosity) could explain the difference of a factor a few in the average luminosities of quasars and radio galaxies in the mid- and far-infrared in studies with IRAS and ISO (Heckman et al. 1994; Hes et al. 1995; van Bemmel, Barthel & de Graauw 2000; Meisenheimer et al. 2001), since this radiation is certainly dominated by nuclear emission reprocessed by the dust torus.
Could such an effect also be responsible for the similar factor difference in the submillimetre luminosities of radio quasars and radio galaxies? This would require a tight correlation between the submillimetre and optical continuum emission from quasars. The analysis of Simpson (1998), predicting a factor of two difference in the [O III] luminosities of radio quasars and radio galaxies, used the known scatter of 0.6 dex in the radio–optical correlation (Serjeant et al. 1998; Willott 2000). Therefore, we would expect the scatter exhibited in the radio–submillimetre correlation to be of the same order if the submillimetre and optical continua are tightly correlated. A power law fit to the marginal correlation between and in Fig.2 gives a linear slope with a scatter of 0.3 dex. The scatter may be slightly larger than this because of the large number (40%) of non-detections (in the above analysis non-detections were set to their 1 upper limits). However, within the limited range in available in our study, we find the scatter in the radio–submillimetre correlation to be no larger than that of the radio–optical correlation.
A tight correlation between submillimetre and optical luminosities could probably only come about by direct heating of the dust responsible for the submillimetre emission by the AGN (as is known to be the case for the mid-infrared emission, and has been discussed previously by Willott et al. 2000b). In this case the scatter could be as small as that seen in the correlation between optical and mid-infrared luminosities of optically-bright, low-redshift quasars, i.e. 0.2 dex from the study of Rowan-Robinson (1995). If the far-infrared emission is due to dust heated by an intense starburst rather than by the quasar, a larger scatter is predicted; indeed the larger scatter, of 0.4 dex, in the far-infrared versus optical luminosity plot from Rowan-Robinson (1995) was used as an argument that: (i) the far-infrared emission from the low-redshift quasars is dominated by starburst-heated dust; and (ii) the scaling relation between optical and far-infrared luminosities arises from both quantities being correlated with a third variable, i.e. the black hole and/or galaxy mass. However, in the quasar-heating hypothesis, the far-infrared luminosity is strongly dependent upon the extended dust distribution (e.g. Granato & Danese 1994) and would indeed be expected to show a larger scatter than the mid-infrared–optical ratio. It may seem surprising that objects with such large quantities of dust have such a small scatter in these ratios because of the effects of dust-reddening of the optical emission. However, in both the Rowan-Robinson sample and the radio-loud sample discussed in this paper, objects would not be classified as quasars if they were heavily reddened ().
Finally in this section, we note that despite the quantitative agreement between the predictions of the receding-torus model and the submillimetre difference between radio quasars and radio galaxies, other physical effects seem likely to be important. Note, for example, that the high submillimetre luminosity of 6C 1045+3513 is an anomaly in the receding-torus model, since it has a value of below that of all the 3C radio galaxies.
4.2 The effect of the radio source age
Fig. 6 plots against the projected linear sizes of the radio sources. According to unified schemes, quasars will typically have projected linear sizes a factor of smaller than those of radio galaxies, due to the smaller angles between their jet axes and our line-of-sight. (assuming from Willott et al. 2000a). Taking account of this effect, the distributions in for the quasars and radio galaxies are fairly similar. However, a striking feature of this plot is that the quasars appear to show an anti-correlation between and . The correlation tests performed (Kendal’s Tau and Cox’s) show these quantities to be anti-correlated with significances of 95 and 99%, respectively. Including the radio galaxies as well, and accounting for projection effects, the significance of this correlation is only marginal (92% and 50%), largely because of the introduction of a large number of submillimetre upper limits.
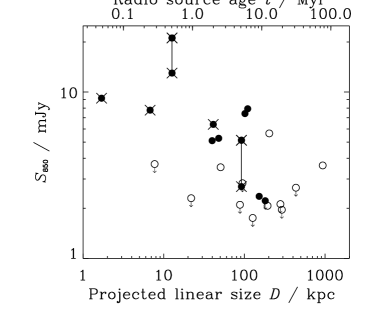
An important point to consider here is whether this anti-correlation could be due to contamination of the sub-millimetre emission by synchrotron from the lobes or hotspots. This is because the SCUBA beam at 850 m has a 13 arcsec FWHM, corresponding to a physical size at these redshifts of 110 kpc. Hence sources with less than this value will have their hotspots within the SCUBA beam. However, one should note that the five radio quasars with detections at shorter wavelengths indicated by the crosses are also mostly the smallest quasars. In these objects we have evidence for a thermal dust spectrum and high far-IR luminosities. It can also be seen that five radio galaxies have kpc and these have significantly smaller sub-millimetre fluxes than the quasars. In the orientation-based unified scheme there is no reason why quasars should have brighter extended synchrotron emission than radio galaxies. Therefore, although we cannot rule out some lobe/hotspot contamination in the smallest sources it cannot be the driving force behind the observed correlation.
3C 298, 3C 318, 6C 1045+3513, and more marginally 3C 191, are all compact steep-spectrum (CSS) radio sources, which are believed to be small due to their jets being triggered relatively recently ( years; Fanti et al. 1995). Previous studies of the far-infrared properties of CSS sources have shown them to be indistinguishable from larger, presumably older, radio sources (Heckman et al. 1994; Fanti et al. 2000). However our study is quite different from these which were limited to low redshifts (and hence luminosities) due to the sensitivity limitations of IRAS and ISO, and it is plausible that the differences only occur at higher luminosities, higher redshifts and/or longer wavelengths (e.g. because the emission is dominated by starburst-heated cold-dust emission rather than AGN-heated hot-dust torus emission).
It is also interesting to note that 3C 298, 3C 318 and 6C 1045+3513 are reddened quasars, indicating significant quantities of dust in their host galaxies. Also, 3C 191, 3C 268.4 and 3C 298, show very strong CIV associated absorption and 6C 1045+3513 has a CIV broad absorption system. Baker et al. (2001) show that there is an anti-correlation between the strength of associated absorption systems and radio linear size and also that the redder quasars tend to have the strongest line absorption. It has also been noticed that, amongst radio-loud quasars, broad absorption lines are more commonly observed in the smallest radio sources (Becker et al. 2000). These observations indicate an evolutionary picture where the absorbing material is cleared as the radio sources get older (Baker et al. 2001). This is similar to the evolutionary scheme of Sanders et al. (1988) where quasars begin their lives in a dust-enshrouded phase.
The projected linear size of a radio quasar or radio galaxy can be related approximately to the time since the jets were triggered , since the relationship between these variables is only weakly dependent upon the radio luminosity, and the objects under consideration span only 1.5 dex in this quantity. Using the simple model of radio source evolution in Willott et al. (1999) we can, at least approximately, transform the linear size axis in Fig. 6 to the time since the quasars were triggered (the radio galaxies have ages on average a factor of 1.6 smaller at a given than shown here, due to projection effects). Fig. 6, and the anti-correlation it exhibits, shows that the most submillimetre-luminous quasars had their radio sources triggered years ago. This means that the processes controlling the submillimetre/far-infrared luminosity are synchronized with the jet-triggering event and that declines on a yr timescale.
Although high values of for an AGN are generally interpreted as evidence for high rates of star formation, it is possible that, as explored in Sec. 4.1 (see also Willott et al. 2000b; Rowan-Robinson 2000), even the cool dust is directly heated by the AGN. Any evidence for star formation is indirect, being based on the large gas masses observed in CO in a handful of cases, but mostly deduced from the large dust masses required by any submillimetre-detected thermal source (e.g. Hughes, Dunlop, & Rawlings 1997). With a standard dusty disc model (e.g. Efstathiou & Rowan-Robinson 1995) there are difficulties in heating the cool dust at large distances from the nucleus, due to the fact the disc is optically thick and shields the distant dust from the ionizing radiation. A more efficient way of heating large amounts of cool dust by an AGN, come from models where the dust has a more isotropic distribution with a very high covering factor (e.g. Granato, Danese & Franceschini 1996). This may occur preferentially in recently-triggered AGN if the dusty gas fueling the nucleus is not in a regular torus distribution. In addition, models for shocks caused by advancing radio components suggest that dust grains cannot survive for much longer than in such environments (De Young 1998). Jarvis et al. (2001b) summarise other evidence that expanding radio sources modify the physical conditions of their gaseous environments as the radio-emitting components expand outward after jet triggering. There are therefore two reasons why in a scenario in which quasar-heated dust dominates, one expects to decline on a timescale. Note that the fact that the brightest submillimetre sources are reddened quasars with line absorption is consistent with this picture, since with this dust distribution there is a high probability of our line-of-sight to the nucleus intercepting a dust cloud. It is of course possible that the dust distribution could be influenced by previous episodes of star-formation.
It is also possible that the submillimetre emission in the hyperluminous sources is dominated by starburst-heated dust, in which case the implication is that the jet-triggering process is accurately synchronized with an intense burst of star formation. The timescale for such star formation events would have to be years for the far-infrared (300 m) luminosity to peak yr after the onset of the starburst (Efstathiou, Rowan-Robinson & Siebenmorgen 2000). Line ratios from mid-infrared spectroscopy of nearby starburst galaxies suggest that the duration of the bursts in such galaxies are yr (Thornley et al. 2000) and for ultraluminous infrared galaxies yr (Genzel et al. 1998). Thus the starburst timescales are quite consistent with the hypothesis that a starburst and a jet-producing AGN were triggered synchronously, and the anti-correlation seen in Fig. 6.
A starburst of such a brief duration, forming stars at yr-1 as implied by the submillimetre luminosity, would form of stars over its lifetime. The total stellar mass of a powerful radio galaxy with a luminosity of (Jarvis et al. 2001a) is . Therefore such a star formation episode would form only a few per cent of the total stellar mass in a massive elliptical galaxy and therefore this phase is not a major event in the star-formation histories of the quasar host galaxy. This is consistent with other evidence, such as the small scatter in the relation (Jarvis et al. 2001a) and the existence of very red radio galaxies at (Dunlop et al. 1996; Dunlop 1999; Willott, Rawlings & Blundell 2001), that the bulk of the stars in powerful radio galaxies were formed at higher redshifts of .
Regardless of whether the dust is heated by a quasar or a starburst or a mixture of the two, it seems that Fig. 6 provides some support for the Blundell & Rawlings (1999) conjecture that radio source youth may be an important factor in explaining the high submillimetre luminosities of distant radio galaxies. An important question is how this finding relates to the properties of the more distant () systems studied by A01. We again defer a more detailed discussion to a future paper (Rawlings et al. in prep.) but note here that the fact that the submillimetre luminosities of the radio quasars are similar to the radio galaxies at is not, by itself, a strong argument that their host galaxies are in similar evolutionary states. It is certainly plausible that the higher-redshift objects are forming significant fractions of the stellar mass of a giant elliptical galaxy, requiring simply that the duration of the starburst is yr. Direct measurements of gas mass, e.g. by CO observations, would be very important for determining the evolutionary states and the main heating source of the cool dust for the objects studied here. It is hard with submillimetre continuum measurements alone to determine the relationship between these objects and the high-redshift radio galaxies studied by A01. The discovery of huge reservoirs of molecular gas in some very high-redshift radio galaxies (Papadopoulos et al. 2000; Alloin, Barvainis & Guilloteau 2000) supports a starburst-heating model for the bulk of the submillimetre continuum in these objects, and the lack of such reservoirs at , if observed, would suggest that quasar-heating might become more prevalent at lower redshifts.
5 Concluding remarks
We have performed a submillimetre survey of radio quasars in the redshift range and detect ten out of eleven quasars, implying submillimetre/far-infrared luminosities . We argue that only one or two of these detections are dominated by core synchrotron emission. For five quasars, detections at shorter wavelengths confirm the presence of a thermal continuum and a large mass () of cool dust.
We find the radio quasars have higher submillimetre luminosities by a factor of than radio galaxies of the same radio luminosity and redshift, a factor which cannot be reduced below by accounting for possible synchrotron contamination. At radio quasars are intrinsically brighter than radio galaxies at submillimetre wavelengths. This argues against the simplest unified scheme for radio sources in which the probability of viewing a quasar nucleus is unity for a viewing angle , with constant, and zero at . It is, however, in quantitative agreement with a receding-torus model in which depends on quasar optical luminosity, but only if there is a close relationship between optical luminosity and . The implication is that quasar-heated dust dominates for powerful radio quasars at .
There is a significant anti-correlation between and radio source age in the sense that hyperluminous quasars tend to be associated with young ( yr) sources at . This means that the processes controlling are synchronized with the jet-triggering event and that declines on a yr timescale. There is evidence for a small amount of obscuration in the most submillimetre-luminous quasars from reddening (3C 298, 3C 318 and 6C 1045+3513) and/or prominent associated absorption (3C 191, 3C 268.4, 3C 298) or broad absorption lines (6C 1045+3513). We speculate that shortly after jet triggering, dust is more widely distributed than at later times. This distributed dust could be heated by the quasar nucleus and/or a short-lived synchronized starburst and may be destroyed by shocks associated with the expanding radio source. Any such starburst would form only a few per cent of the total stellar mass in agreement with the evidence for dominant old stellar populations in radio galaxies.
Acknowledgements
We thank the anonymous referee for some very useful suggestions. We are very grateful to the staff at the Joint Astronomy Centre for their help with the observations. The JCMT is operated by the Joint Astronomy Centre on behalf of the U.K. Particle Physics and Astronomy Research Council. The William Herschel Telescope is operated on the island of La Palma by the Isaac Newton Group in the Spanish Observatorio del Roque de los Muchachos of the Instituto de Astrofisica de Canarias. This research has made use of the NASA/IPAC Extra-galactic Database, which is operated by the Jet Propulsion Laboratory, Caltech, under contract with the National Aeronautics and Space Administration. CJW thanks PPARC for support.
References
- [1] Akujor C.E., Spencer R.E., Zhang F.J., Davis R.J., Browne I.W.A., Fanti C., 1991, MNRAS, 250, 215
- [2] Alloin D., Barvainis R., Guilloteau S., 2000, ApJ, 528L, 81
- [3] Anderson S.F., Weymann R.J., Foltz C.B., Chaffee F.H., 1987, AJ, 94, 278
- [4] Andreani P., Fosbury R.A.E., van Bemmel I., Freudling W., 2001, A&A, in press, astro-ph/0111064
- [5] Antonucci R.R.J., 1993, ARA&A, 31, 473
- [6] Antonucci R.R.J., Barvainis R., Alloin D., 1990, ApJ, 353, 416
- [7] Archibald E.N., Dunlop J.S., Hughes D.H., Rawlings S., Eales S.A., Ivison R.J., 2001, MNRAS, 323, 417 (A01)
- [8] Athreya R.M., Kapahi V.K., McCarthy P.J., van Breugel W., 1997, MNRAS 289, 525
- [9] Baker J.C., Hunstead R.W., Athreya R.M., Barthel P.D., De Silva E., Lehnert M.D., Saunders R.D.E., 2001, ApJ, submitted
- [10] Barthel P.D., 1989, ApJ, 336, 606
- [11] Barthel P.D., Tytler D.R., Thomson B., 1990, A&AS, 82, 339
- [12] Becker R.H., White R.L., Gregg M.D., Brotherton M.S., Laurent-Muehleisen S.A., Arav N., 2000, ApJ, 538, 72
- [13] Bettoni D., Falomo R., Fasano G., Govoni F., Salvo M., Scarpa R., 2001, A&A, 380, 471
- [14] Blain A.W., Longair M.S., 1993, MNRAS, 264, 509
- [15] Blundell K.M., Rawlings S., 1999, Nature, 339, 330
- [16] Brotherton M.S., Tran H.D., Becker R.H., Gregg M.D., Laurent-Muehleisen S.A., White R.L., 2001, ApJ, 546, 775
- [17] Carilli C.L., 1995, A&A, 298, 77
- [18] De Young D.S., 1998, ApJ, 507, 161
- [19] Dunlop J.S., 1999, in The Most Distant Radio Galaxies, ed. P.N. Best, H.J.A. Röttgering, M.D. Lehnert, (KNAW Colloq.; Dordrecht: Kluwer), 14
- [20] Dunlop J.S., Peacock J.A., Spinrad H., Dey A., Jimenez R., Stern D., Windhorst R., 1996, Nature, 381, 581
- [21] Dunlop J.S., McLure R.J., Kukula M.J., Baum S.A., O’Dea C.P., Hughes D.H., 2001, MNRAS, submitted, astro-ph/0108397
- [22] Dunne L., Eales S.A., Edmunds M., Ivison R., Alexander P., Clements D.L., 2000, MNRAS, 315, 115
- [23] Efstathiou A., Rowan-Robinson M., 1995, MNRAS, 273, 649
- [24] Efstathiou A., Rowan-Robinson M., Siebenmorgen R., 2000, MNRAS, 313, 734
- [25] Espey B.R., Carswell R.F., Bailey J.A., Smith M.G., Ward M.J., 1989, ApJ, 342, 666
- [26] Fanti C., Fanti R., Dallacasa D., Schilizzi R.T., Spencer R.E., Stanghellini C., 1995, A&A, 302, 317
- [27] Fanti C., et al., 2000, A&A, 358, 499
- [28] Feigelson E.D., Nelson P.I., 1985, ApJ, 293, 192
- [29] Gear W.K., et al., 1994, MNRAS, 267, 167
- [30] Genzel R., et al., 1998, ApJ, 498, 579
- [31] Granato G.L., Danese L., 1994, MNRAS, 268, 235
- [32] Granato G.L., Danese L., Franceschini A., 1996, ApJL, 460, 11
- [33] Gregg M.D., Becker R.H., Brotherton M.S., Laurent-Meuleisen S.A., Lacy M., White R.L., 2000, ApJ, 544, 142
- [34] Hamann F.W., Barlow T.A., Chaffee F.C., Foltz C.B., Weymann R.J., 2001, ApJ, 550, 142
- [35] Heckman T.M., O’Dea C.P., Baum S.A., Laurikainen E., 1994, ApJ, 428, 65
- [36] Hes R., Barthel P.D., Hoekstra H., 1995, A&A, 303, 8
- [37] Hirst P., Jackson N., Rawlings S., 2002, MNRAS, submitted
- [38] Hughes D.H., Dunlop J.S., Rawlings S., 1997, MNRAS, 289, 766
- [39] Isobe T., Feigelson E.D., Nelson P.I., 1986, ApJ, 306, 490
- [40] Jackson N., Rawlings S., 1997, MNRAS, 286, 241
- [41] Jarvis M.J., Rawlings S., Eales S.A., Blundell K.M., Bunker A.J., Croft S., McLure R.J., Willott C.J., 2001a, MNRAS, 326, 1585
- [42] Jarvis M.J., et al., 2001b, MNRAS, 326, 1563
- [43] Laing R.A., Riley J.M., Longair M.S., 1983, MNRAS, 204, 151
- [44] Lawrence A., 1991, MNRAS, 252, 586
- [45] Magorrian J., et al., 1998, AJ, 115, 2285
- [46] McCarthy P.J., 1993, ARA&A, 31, 639
- [47] McLure R.J., Kukula M.J., Dunlop J.S., Baum S.A., O’Dea C.P., Hughes D.H., 1999, 308, 377
- [48] Meisenheimer K., Haas M., Muller S.A.H., Chini R., Klaas U., Lemke D., 2001, A&A, 372, 719
- [49] Miller P., Rawlings S., Saunders R., Eales S.A., 1992, MNRAS, 254, 93
- [50] Nolan L.A., Dunlop J.S., Kukula M.J., Hughes D.H., Boroson T., Jimenez R., 2001, MNRAS, 323, 308
- [51] Owen F.N., Laing R.A., 1989, MNRAS, 238, 357
- [52] Papadopoulos P.P., Röttgering H.J.A., van der Werf P.P., Guilloteau S., Omont A., van Breugel W.J.M., Tilanus R.P.J., 2000, ApJ, 528, 626
- [53] Priddey R.S., McMahon R.G., 2001, MNRAS, 324L, 17
- [54] Rawlings S., Saunders R., 1991, Nature, 349, 138
- [55] Rawlings S., Eales S.A., Lacy M., 2001, MNRAS, 322, 523
- [56] Rowan-Robinson M., 1995, MNRAS, 272, 737
- [57] Rowan-Robinson M., 2000, MNRAS, 316, 885
- [58] Sanders D.B., Soifer B.T., Elias J.H., Madore B.F., Matthews K., Neugebauer G., Scoville N.Z., 1988, ApJ, 325, 74
- [59] Scheuer P.A.G., 1987, in Superluminal Radio Sources, edited by J.A. Zensus and T.J. Pearson, p.331, Cambridge University Press
- [60] Serjeant S., Rawlings S., Maddox S.J., Baker J.C., Clements D., Lacy M., Lilje P.B., 1998, MNRAS, 294, 494
- [61] Simpson C., 1998, MNRAS, 297, L39
- [62] Spinrad H., Marr J., Aguilar L., Djorgovski S., 1985, PASP, 97, 932
- [63] Thornley M.D., Schreiber N.M.F., Lutz D., Genzel R., Spoon H.W.W., Kunze D., Sternberg A., 2000, ApJ, 539, 641
- [64] van Bemmel I.M., Bertoldi F., 2001, A&A, 368, 414
- [65] van Bemmel I.M., Barthel P.D., de Graauw T., 2000, A&A, 359, 523
- [66] Willott C.J., 2000, to appear in Proc. ”AGN in their Cosmic Environment”, eds. B. Rocca-Volmerange, H. Sol, EDPS Conf. Series in Astron. & Astrophysics, astro-ph/0007467
- [67] Willott C.J., Rawlings S., Blundell K.M., Lacy M., 1998, MNRAS, 300, 625
- [68] Willott C.J., Rawlings S., Blundell K.M., Lacy M., 1999, MNRAS, 309, 1017
- [69] Willott C.J., Rawlings S., Blundell K.M., Lacy M., 2000a, MNRAS, 316, 449
- [70] Willott C.J., Rawlings S., Jarvis M.J., 2000b, MNRAS, 313, 237
- [71] Willott C.J., Rawlings S., Blundell K.M., 2001, MNRAS, 324, 1
Appendix A 6C 1045+3513 - A submillimetre-luminous reddened BAL quasar
In this appendix we present a new optical spectrum of 6C 1045+3513, which is one of the brightest radio quasars at submillimetre wavelengths found in this paper ( mJy). It is also detected at the level with the short wavelength array ( mJy).
6C 1045+3513 was observed with the ISIS double-beam spectrograph on the William Herschel Telescope on April 16 2001. Conditions were photometric with 1.0 arcsec seeing and a 1.0 arcsec slit was used giving a dispersion resolution of 8 Å. The telescope was pointed at the position of the compact radio source (10:48:34.25 +34:57:25.0 - J2000.0). The total integration time of the observation was 1200 seconds. The data were reduced in the IRAF package using the same method as in Willott et al. (1998). The red and blue arm spectra were joined together, averaging over 35 Å where the signal-to-noise ratio of the spectra were approximately equal (6200 Å).
The target is clearly identified in the two dimensional spectrum and appears to be spatially unresolved. In Figure 7 we show the optical spectrum extracted in a 1 arcsec aperture. The object has a red continuum and several strong emission lines (see Table A1). The red continuum has a spectral index of 2.3 and is well fit by a quasar spectrum reddened by (assuming a Milky-Way extinction curve). The positions of the emission lines are consistent with a redshift for 6C 1045+3513 of , extremely close to the tentative value reported by Rawlings et al. (2001). The C IV and He II emission lines are both narrow (FWHM ). The Mg II and C III] emission lines appear to have narrow central profiles with broad wings, which together with the weak or absent broad wings in C IV and He II, are consistent with broad-line region reddening of the same amount as the continuum fitting suggests.
There is very high equivalent width C IV absorption on the blue wing of the emission line. This feature is very broad with a width of at least . There is no corresponding broad absorption of Mg II, so 6C 1045+3513 is classified as a high-ionization broad absorption line (BAL) quasar. Unfortunately, our data are not sensitive enough or with sufficient spectral resolution to determine the structure of the absorption trough. 6C 1045+3513 is one of the most radio-luminous quasars to show the BAL phenomenon, with a radio luminosity similar to that of the BAL QSO FIRST J101614.3+520916 (Gregg et al. 2000) .

6C 1045+3513 is thus remarkably similar to 3C 318 (Willott et al. 2000b). Both objects have a small degree of reddening which suppresses the rest-frame UV broad line strengths to below those of the narrow lines. Both are also very luminous submillimetre sources (with detections at both 850 m and 450 m) and both are compact ( kpc) radio sources with similar estimated source ages. A possible reason for these similarities is discussed in Sec. 4.2.
| Line | FWHM | Flux/ | ||
|---|---|---|---|---|
| (Å) | (km s-1) | (W m-2) | ||
| C IV | 4029 4 | 1.601 | 2000 | 18 4 |
| He II | 4263 6 | 1.599 | 2400 | 3.6 1.3 |
| C III] | 4906 6 | 1.597 | 4300 | 8.2 1.0 |
| Mg II | 7291 2 | 1.605 | 2900 | 9 4 |
| 8920 3 | 1.604 | 1300 | 4.6 1.6 |