Breaking the “Redshift Deadlock” - I: Constraining the star formation history of galaxies with sub-millimetre photometric redshifts
Abstract
Future extragalactic sub-millimetre and millimetre surveys have the potential to provide a sensitive census of the level of obscured star formation in galaxies at all redshifts. While in general there is good agreement between the source counts from existing SCUBA (850m) and MAMBO (1.25 mm) surveys of different depths and areas, it remains difficult to determine the redshift distribution and bolometric luminosities of the sub-millimetre and millimetre galaxy population. This is principally due to the ambiguity in identifying an individual sub-millimetre source with its optical, IR or radio counterpart which, in turn, prevents a confident measurement of the spectroscopic redshift. Additionally, the lack of data measuring the rest-frame FIR spectral peak of the sub-millimetre galaxies gives rise to poor constraints on their rest-frame FIR luminosities and star formation rates. In this paper we describe Monte-Carlo simulations of ground-based, balloon-borne and satellite sub-mm surveys that demonstrate how the rest-frame FIR–sub-mm spectral energy distributions (250–850m) can be used to derive photometric redshifts with an r.m.s accuracy of over the range . This opportunity to break the redshift deadlock will provide an estimate of the global star formation history for luminous optically-obscured galaxies () with an accuracy of per cent.
keywords:
submillimetre — surveys — cosmology: observations — galaxies: formation — galaxies: evolution — galaxies: high-redshift1 Introduction
The star-formation history of the high- starburst galaxy population can be determined from an accurate measurement of the integral sub-millimetre (sub-mm) and millimetre (mm) source-counts, and the luminosity and redshift distributions of sub-mm and mm-selected galaxies. The contribution of these sources to the total FIR–mm background, measured by COBE [Puget et al. 1996, Hauser et al. 1998, Fixsen et al. 1998], places an additional strong constraint on the acceptable evolutionary models. It is now generally believed that the luminosity density, due to star formation activity in galaxies, is roughly constant between . A series of ground-based 850m surveys [Smail et al. 1997, Hughes et al. 1998, Barger et al. 1998, Eales et al. 1999, Eales et al. 2000, Scott et al. 2001, Fox et al. 2001, Borys et al. 2001], undertaken with the SCUBA camera [Holland et al. 1999] on the 15-m JCMT and 1.25 mm surveys [Bertoldi et al. 2000] using the MAMBO camera [Kreysa et al. 1998] on the 30-m IRAM telescope, have contributed significantly to this understanding. Prior to the first SCUBA results, the optical surveys suggested (contrastingly) that the density of star-formation declined by a factor of over the same redshift range [Steidel et al. 1996, Madau et al. 1996]. This discrepancy has highlighted the importance of including a correction for dust extinction in the optical-UV estimates of star formation rates. Nevertheless, the contribution of optically-selected starburst galaxies to the sub-mm background still remains uncertain [Chapman et al. 2000, Peacock et al. 2000]. Hereafter, for the sake of brevity, sub-mm and mm wavelengths will be referred to as sub-mm unless explicitly stated otherwise, and a sub-mm galaxy is considered to be an optically-obscured starburst galaxy detected in a blank-field SCUBA or MAMBO survey.
One important caveat to this opening statement is the fact that we actually have no accurate information on the redshift distribution of the sub-mm galaxy population. There are galaxies identified in 850m surveys at a level mJy. The lack of confident optical, or IR identifications (e.g. Hughes et al. 1998; Richards 1999), and thus precise redshifts for the sub-mm galaxies, was a source for the early scepticism of the claims that there existed no evidence for a decline in density of star formation at .
The use of the radio–sub-mm (850m/1.4GHz) spectral index has gained popularity as a valuable diagnostic of redshift [Hughes et al. 1998, Carilli & Yun 1999, Carilli & Yun 2000, Smail et al. 2000, Barger, Cowie & Richards 2000, Dunne, Clements & Eales 2000]. The radio follow-up of SCUBA surveys, and more recently 1.25mm MAMBO surveys [Bertoldi et al. 2000], with the VLA at 1.4 GHz has become the commonly accepted method to measure the redshift distribution of sub-mm galaxies. However this technique requires extremely sensitive observations if radio counterparts are to be detected. For example, in order that a radio survey detects per cent of bright sub-mm galaxies ( mJy) at , then a Jy survey must be conducted at 1.4 GHz [Aretxaga et al. 2002]. Unfortunately the necessity of such an ultra-deep radio survey prohibits this technique from being applied to the wider-area ( deg2) sub-mm surveys that will be conducted in the next few years (section 2) without an excessive committment of radio telescope time (e.g. 400–4000 hours per survey). An alternative, and, we argue, a more reliable method exists: namely the use of sub-mm–FIR photometric redshifts, provided that one can obtain experimental data with sufficient S/N and absolute calibration accuracy.

Although the possibility of conducting cosmological surveys at sub-mm and mm wavelengths has been realised in the last few years with the development and successful commissioning of sensitive bolometer arrays, the existing 850 m SCUBA and 1.25 mm MAMBO surveys are limited in their ability to constrain the evolutionary models of the sub-mm galaxy population. The practical reasons for these limitations have been described elsewhere [Hughes 2000] and can be summarised as follows: restricted wavelength coverage (enforced by the limited number of FIR–mm atmospheric windows available to ground-based observatories); low spatial resolution (resulting in both a high extragalactic confusion limit and poor positional accuracy); restricted field-of-view with the current sub-mm and mm bolometer arrays (typically 5 sq. arcmin); and low system sensitivity (a combination of instrument noise, size of telescope aperture and telescope surface accuracy, sky transmission and sky noise) which restrict even the widest and shallowest sub-mm surveys to areas deg2 [Scott et al. 2001, Fox et al. 2001]. In the effort to obtain these wide-area shallow surveys, the current sub-mm and mm observations are necessarily only sensitive to the most luminous star-forming galaxies (, or ) assuming the population is dominated by galaxies at redshifts .
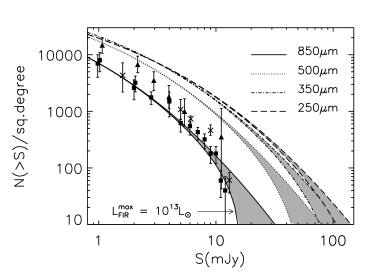
The discrepancy shown in Fig.1 between the bright-end source-counts in the 850m SCUBA and 1.25 mm MAMBO surveys [Eales et al. 2000, Bertoldi et al. 2000, Scott et al. 2001, Borys et al. 2001], and a visual inspection of their reconstructed maps, suggests that the clustering of sub-mm galaxies may be influencing the statistics [Gaztañaga & Hughes 2001]. Taken at face value, the steepening of the 850m counts for sources mJy can be interpreted as evidence for an under-density of galaxies in the survey-field providing those particular data (due to cosmic variance), or perhaps a high-luminosity cut-off in the luminosity function for galaxies (Fig.1). A plausible alternative explanation is simply the fact that, with so few bright sources detected (5–10 galaxies in 0.1 deg2), the counts in this regime are extremely sensitive to differences between the SEDs of the most luminous sub-mm galaxies. Sensitive, wider-area ( deg2), rest-frame FIR surveys with accurate redshift information (similar to those discussed in this paper) can distinguish between these possible alternatives.
1.1 Ambiguities in the Counterparts of Sub-mm Galaxies
The current 850m SCUBA and 1.25 mm MAMBO surveys are struggling to identify the sub-mm sources with their optical, IR and radio counterparts. Positional errors of arcsec are associated with the brightest sub-mm sources ( mJy) which, with some exceptions, are detected in the widest, shallowest SCUBA surveys [Scott et al. 2001, Eales et al. 2000]. These errors can be improved with follow-up mm-interferometric observations [Frayer et al. 1998, Gear et al. 2000, Lutz et al. 2001]. However ambiguous optical identifications still remain, even with arcsec resolution and sub-arcsec positional errors (e.g. Downes et al. 1999). It should be no surprise that sub-mm selected galaxies, including those with mm-interferometric detections, do not always have optical counterparts, since high- galaxies observed in the earliest stages of formation may be heavily obscured by dust. Indeed, this is the most compelling reason for conducting the sub-mm surveys in the first instance. Searches for counterparts at longer IR wavelengths have proven to be more successful [Smail et al. 1999, Frayer et al. 2000, Gear et al. 2000, Lutz et al. 2001], and have shown earlier identifications of lower- bright optical galaxies to be the incorrect counterpart to the sub-mm galaxies [Smail et al. 1999, Frayer et al. 2000]. The natural consequence of these ambiguous and potential mis-identifications is an inaccurate determination of redshift distribution, luminosities and star-formation history of high- galaxies.

1.2 Uncertainties in the SEDs and Redshifts of Sub-mm Galaxies
Despite the diversity in the properties of sub-mm galaxies [Ivison et al. 2000], efforts have been made to place them in the context of an evolutionary model of galaxy formation. The current estimate of the redshift distribution of sub-mm galaxies is based on simple comparisons of their IR–radio SEDs with those of redshifted template SEDs, drawn from local starburst galaxies and radio-quiet AGN [Hughes et al. 1998, Smail et al. 1999, Lilly et al. 1999, Carilli & Yun 1999, Barger, Cowie & Richards 2000, Carilli & Yun 2000, Smail et al. 2000, Bertoldi et al. 2000, Dunne, Clements & Eales 2000, Dunlop 2001, Smail et al. 2001, Chapman et al. 2002]. The consensus is that the population of sub-mm galaxies is distributed between redshifts , with a median . The details of this distribution are still unknown, and it is common to describe the redshifts of individual galaxies as “in the range of …., with a best guess of ….”.
This raises an obvious question:What classes of local galaxies offer the most useful analogues of the high-z sub-mm population? In order to address this we must measure the full rest-frame X-ray to radio SEDs of individual high- sub-mm galaxies, measure the dispersion in the shapes of their SEDs and their range of luminosities (which may depend on redshift), and thus determine the accuracy with which the SEDs of high- sub-mm galaxies can be characterised by a limited number of local template galaxies. In practise, the observed SEDs of high- sub-mm galaxies are restricted to a few detections and limits at 850, 450m and 1.4 GHz, with occasional mm interferometric observations and a K-band identification. No data exists at rest-frame FIR wavelengths with sufficient sensitivity to place additional useful constraints on redshifts.
As mentioned previously, optical and IR follow-up observations of those few SCUBA sources for which unambiguous identifications exist have revealed that the sub-mm counterparts are often optically-obscured, extremely red objects (EROs) with [Smail et al. 1999, Gear et al. 2000, Lutz et al. 2001], although in a few cases the sub-mm counterparts are blue galaxies, with a weak AGN (e.g. SMM02399–0136, Ivison et al. 2001). Also the suggestion that SCUBA galaxies are forming stars at a very high-rate (/yr) implies that local dusty ULIRGs may also be suitable analogues of high- sub-mm sources. Unfortunately the SEDs of this local class of luminous star-forming galaxies vary significantly with increasing FIR luminosity [Sanders & Mirabel 1996]. Furthermore, there are few starburst galaxies at for which complete IR–radio SEDs exist.
These initial SCUBA and MAMBO observations have demonstrated the necessity for larger-area surveys, and also shorter-wavelength (250–500m) sub-mm observations. Although new (and future) ground-based facilities (100-m GBT, 50-m LMT, SMA) will offer partial solutions to some of these problems over the next 6 years, there will still remain ambiguity in the optical, IR and radio identifications of sub-mm galaxies. The consequence is a lack of precision in the redshift distribution and rest-frame FIR luminosities, and thus an inaccurate constraint on the star formation history of the entire sub-mm population.
Once it begins operation beyond 2008, ALMA will undoubtedly solve many of these difficulties with its powerful combination of receivers operating between 350m and 3 mm, and high (sub-arcsec) spatial resolution. The expected launch of the Herschel satellite in 2008 will also bring the chance to map large areas of the extragalactic sky at 250–500m with high sensitivity. However, in late 2003 onwards, a series of long-duration ( day) sub-orbital balloon flights will be undertaken by BLAST – Balloon-borne Large-Aperture Sub-millimetre Telescope [Devlin et al. 2001]. BLAST has a 2-m primary aperture, and is equipped with large-format bolometer cameras operating at 250, 350 and 500m which are prototypes of the SPIRE focal-plane cameras for the Herschel satellite. BLAST will conduct sub-mm surveys over deg2 (Table 1), and will provide rest-frame FIR–sub-mm data for galaxies, with a point-source sensitivity 3 times greater than is available from even the largest ground-based sub-mm telescopes.
In this paper (Paper I) we describe Monte-Carlo simulations of sub-mm surveys that demonstrate how the rest-frame FIR–sub-mm SEDs (250-500m) of galaxies can be used to measure their photometric redshifts with a conservative 1 accuracy of over the redshift range . Thus we can finally break the current redshift deadlock that limits our understanding of the evolution of the sub-mm galaxy population. From such precision in the individual galaxy redshifts, we can determine the star formation history for luminous sub-mm galaxies brighter than with an accuracy of per cent. We consider the specific example of future surveys from BLAST. Furthermore we illustrate how these estimates can be improved with sub-mm observations using the more sensitive SPIRE camera on the Herschel satellite, and additionally with the inclusion of longer-wavelength ground-based 850m data from SCUBA. In paper II of this series [Aretxaga et al. 2002] we develop this photometric-redshift estimation technique, and apply it to the existing multi-frequency data for the population of sub-mm galaxies detected in SCUBA and MAMBO surveys. We include, for the first time, an appropriate treatment of the observational errors at sub-mm to radio wavelengths, and provide an accurate measurement of the redshift distribution for sub-mm galaxies. In paper III of this series (Gaztañaga et al., in preparation) we address the clustering of sub-mm galaxies, given their redshift distribution derived from these photometric redshifts.
The following cosmological model is adopted throughout the paper: .
2 Photometric Redshifts from Wide-Area Sub-millimetre Surveys
2.1 Designing the Sub-mm Surveys
To assess the accuracy of the photometric redshifts that can be determined from rest-frame FIR–sub-mm data, we generate mock catalogues of sub-mm galaxies from Monte-Carlo simulations that mimic realistic observing data (§2.2). Thus, we must first have prior knowledge of the areas and sensitivities of the sub-mm surveys that will be conducted with BLAST, SPIRE, or any other existing or future sub-mm experiment, in order to achieve the scientific goals. We have simulated realistic surveys to satisfy this requirement. These simulations, which include an evolving population of sub-mm galaxies that are consistent with the observed number-counts (Fig.1), and a foreground Galactic cirrus component, are described in more detail elsewhere [Hughes & Gaztañaga 2000, Gaztañaga & Hughes 2001, Chapin et al. 2001]. In particular these simualtions help understand how the analysis of the experimental survey data can be affected by telescope resolution, extragalactic and Galactic source-confusion, survey sensitivity and noise, and sampling variances due to clustering and shot-noise.


Provided the BLAST surveys are conducted towards regions of low Galactic cirrus ( MJy/sr), then the BLAST survey confusion limit will be dominated by extragalactic sources. In the absence of any foreground cirrus, the simulation indicates that the extragalactic confusion limit of BLAST at 250–500m will be mJy. For comparison the traditional estimate of extragalactic confusion, 1 source/30 beams [Condon 1974], suggests that confusion will begin to dominate below 30 mJy.
Hence, during a single long-duration balloon flight, BLAST will conduct a series of simultaneous large-area surveys ( deg2) at 250, 350 and 500m, down to a 1 sensitivity of 5 mJy, detecting in each survey luminous sub-mm galaxies () between (Table 1). The accuracy with which photometric redshifts can be determined from surveys of this magnitude is discussed in the following sections.
| survey area | 1 depth | no. of pixels | no. of detected galaxies | no. of galaxies | ||
|---|---|---|---|---|---|---|
| (deg2) | ||||||
| 1.0 | 5 mJy | 18334 | 835 | 265 | 765 | 147 |
| 2.0 | 7 mJy | 36668 | 1012 | 291 | 927 | 151 |
| 4.0 | 10 mJy | 73336 | 1100 | 294 | 988 | 147 |
| 9.0 | 15 mJy | 165006 | 1111 | 247 | 1023 | 129 |
| 36.0 | 30 mJy | 660024 | 990 | 246 | 895 | 105 |
2.2 Monte-Carlo Simulations of Sub-mm Galaxy Colours
Measurements of photometric redshifts determined from FIR–sub-mm–radio data usually do not include a rigorous analysis of the errors and the uncertainties in the calculations [Hughes et al. 1998, Blain 1999, Carilli & Yun 1999, Carilli & Yun 2000, Dunne, Clements & Eales 2000, Eales et al. 2000, Barger, Cowie & Richards 2000]. The desire to assign a degree of confidence (probability) to the photometric redshift of any individual sub-mm galaxy motivated the development of the Monte-Carlo simulations, taking into account the imprecise knowledge of the luminosity function of sub-mm galaxies, the dispersion in the luminosity-dependent SEDs, absolute calibration and observational photometric errors [Aretxaga et al. 2001, Aretxaga et al. 2002]. From these individual redshifts it is then possible to provide a robust statistical measure of the redshift distribution for the entire sub-mm population.
In the case of BLAST (and also SPIRE), the power of this simple technique to derive redshifts arises from the unique ability of these experiments to conduct observations at 250–500m that bracket the ubiquitous rest-frame FIR peak (at m) in the SEDs of high-redshift () galaxies undergoing a significant amount of star formation.
The adopted recipe that generates mock catalogues of galaxies between and , for a given wavelength and under the chosen cosmological model, is summarised:
-
1.
use a single representative SED to calculate the distribution of rest-frame FIR luminosities of galaxies, at all redshifts, from an evolving 60m local luminosity function, [Saunders et al. 1990], that reproduces the observed sub-mm number counts. We adopt a model of pure luminosity evolution, , where
(1) It has been verified that an alternative choice of SED can compensate for small differences in the evolutionary model, and hence still reproduce the source-counts (Fig.1);
-
2.
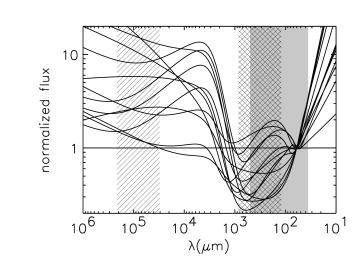
randomly assign an SED from a library of 13 template starburst galaxies, ULIRGs and AGN (Fig.2) to each of the galaxies in the mock catalogue, and use this SED to calculate the intrinsic sub-mm colours. The most crucial assumption of the paper occurs at this point in the simulation. We assume no correlation between the shape of the SED and luminosity (or redshift), and instead rely on the assumption that our library of 13 template SEDs is representative of those that exist at high-. The library, which includes M82, NGC1614, NGC3227, NGC2992, NGC4151, NGC7469, NGC7771, IZw1, Mkn231, Mkn273, Arp220, IRAS10214 and the “Cloverleaf” quasar (H1413+117), contains galaxies with FIR luminosities in the range of . The sample includes a mixture of AGN and starburst galaxies, and composite galaxies with both an AGN and a luminous extended FIR starburst region. The dust temperature ( K) and emissivity index (), which define the shape of their rest-frame FIR–sub-mm spectra are independent of the type or strength of nuclear activity. As mentioned in §1, the sensitivity of the sub-mm observations restricts the surveys to a detection threshold of . Thus, an implicit assumption in this method is that one can simply scale the SED of a lower luminosity galaxy to represent that of a high-redshift sub-mm galaxy. Furthermore, there is no conclusive evidence that the rest-frame FIR–sub-mm SEDs of galaxies vary with luminosity, and redshift beyond the range of SEDs considered here - there is simply a lack of sufficient high signal-to-noise observational data, over the appropriate wavelength regime, to come to any secure conclusions;
-
3.
add random noise (drawn from the distribution describing the measurement errors), and add a constant absolute flux calibration error to the intrinsic fluxes to allow a more realistic assessment of the photometric redshift accuracy: 1 photometric errors of 5 and 2.5 mJy for the BLAST and Herschel/SPIRE observations respectively, and in both cases an absolute calibration error of 5 per cent. The combined simulated images of extragalactic sources and cirrus, described earlier in §2.1, determine the depth of the surveys considered here, ensuring that galaxy confusion dominates. However this Monte-Carlo treatment of the photometric accuracy does not consider the contaminating effects of cirrus, clustering of galaxies, shot-noise or projection effects. These considerations are deferred to a future paper;
-
4.
finally, extract flux-limited catalogues from a 1 deg2 confusion-limited surveys at 250, 350 and 500m with mJy and 2.5 mJy sensitivities, appropriate for BLAST and SPIRE observations.
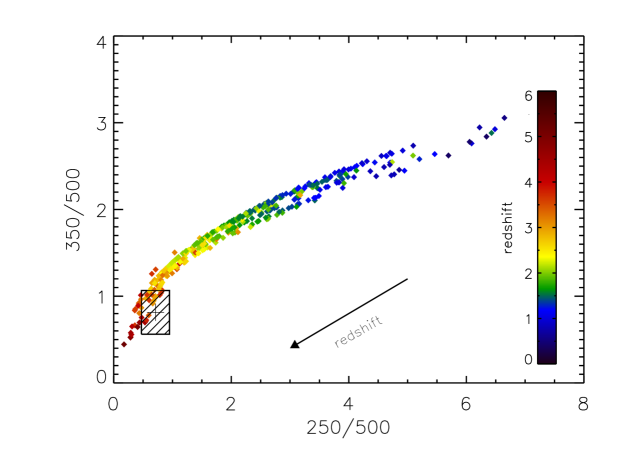
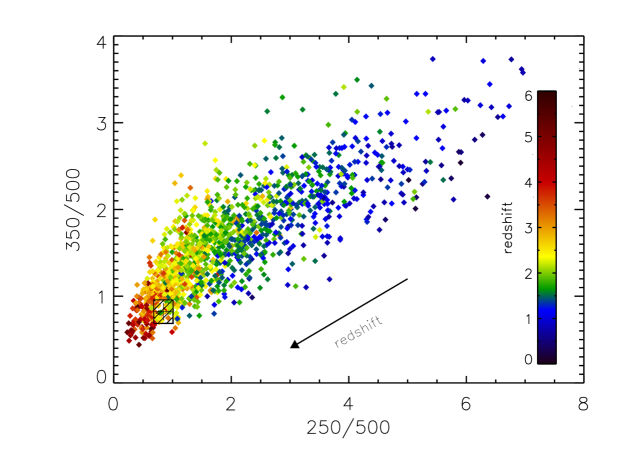
Fig.3 shows an example of one of the possible combinations of sub-mm colours, for a catalogue of galaxies detected () simultaneously at 250, 350 and 500m in a 1 deg2 BLAST survey. As expected the dispersion in sub-mm colours is dominated by the observational errors and not by the differences between the shapes of the template SEDs. This is particularly true when the colour ratios are determined over a relatively small wavelength interval, as is the case for the 250, 350 and 500m observations. However, as we extend the wavelength baseline over which colours are calculated then the effect of differences in the galaxy SEDs on the photometric colours becomes increasingly significant (see Fig.2). An example of this important effect can be found with the inclusion of longer wavelength data to the BLAST observations (§2.3.3), or perhaps more extreme, with the combination of 850m and 1.4GHz fluxes [Carilli & Yun 2000] which are separated in wavelength by a factor . Thus, in general, without an adequate treatment of observational errors and a representative set of reference SEDs, photometric redshifts will be estimated with an over-optimistic accuracy.
2.3 Sub-mm Photometric Redshifts
Sub-mm photometric redshifts can be determined by calculating the probability that the the colours (including errors) of an observed sub-mm galaxy are consistent with the colours of every galaxy (with a known redshift) in the mock catalogue. The final redshift probability distribution, , of any galaxy is then simply the sum of the individual probabilities from the entire catalogue, or explicitly
| (2) |
where is the normalization constant, such that where . The multi-variate Gaussian probability distribution, , for colours, is given by
| (3) | |||||
where is the colour vector of the th mock galaxy, such that , and is the colour vector of the test sub-mm galaxy, for which we want to derive its redshift distribution. is the covariance matrix of the colour distribution, of elements
| (4) |
for two colours , . In the majority of the analysis performed for this paper, the non-diagonal elements of the covariance matrix are small. When more than two colours are considered, for simplicity, the above prescription can be substituted with standard statistics.
In this analysis, we have adopted redshift bins of width 0.5 (). The most probable redshift of the test sub-mm galaxy will be given by the mode of the discrete distribution, estimated as the centroid of the Gaussian that best fits the 5 bins around the maximum of . The asymmetric error bars (, ) correspond to 68 per cent confidence levels such that and is minimised.

2.3.1 BLAST colours
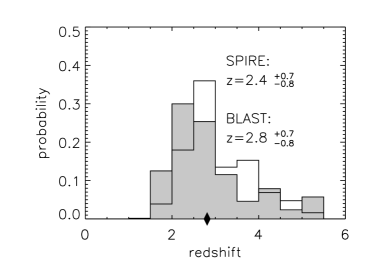
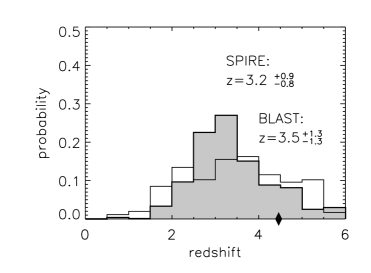
Fig.4 shows two examples of the redshift distributions for sub-mm galaxies detected by BLAST at different levels of significance in all 3 filters. A further example of the broader distribution derived for a higher- galaxy detected only at 500m is also shown in Fig.4. The accuracy of the redshifts determined from BLAST data is described in more detail in §2.4, where we also compare the accuracy to those obtained from optical–IR colours and the 850m/1.4 GHz spectral index. The dispersion in the sub-mm photometric redshifts derived from 3 BLAST bands is averaged over all redshifts in the range .
2.3.2 SPIRE colours
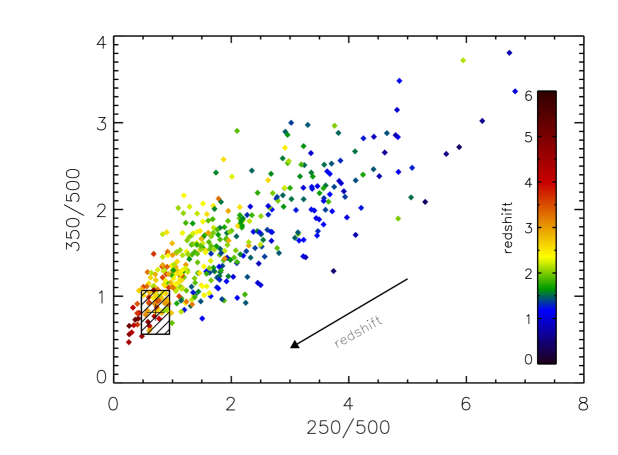
An increase in the sensitivity of the sub-mm observations (with SPIRE for instance) naturally translates into an increased accuracy of the redshift distributions. Fig.5 shows the increased sample-size (at all redshifts) for the deeper SPIRE survey (compared to Fig.3). However the greater sensitivity of the SPIRE observations ( mJy) does not significantly improve the accuracy of the redshift distributions, compared to those determined from detections in all 3 BLAST filters. The redshift uncertainties for these sources are due to a combination of the absolute calibration errors and the dispersion in the template SEDs. However SPIRE does provide a far greater redshift accuracy for the sources that BLAST detects in only one or two filters with low S/N (Fig.6). Thus, if the advantage of the larger aperture of Herschel, the reduced confusion limit and higher sensitivity of SPIRE is to be realised, then a clearer understanding of the SEDs of high- galaxies is first required.
2.3.3 BLAST + 850m colours
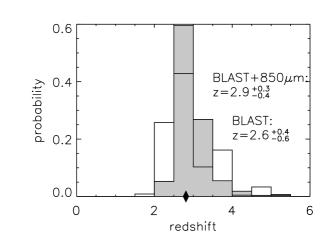
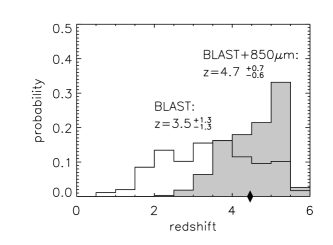
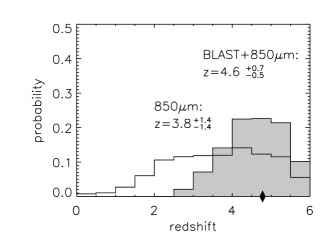
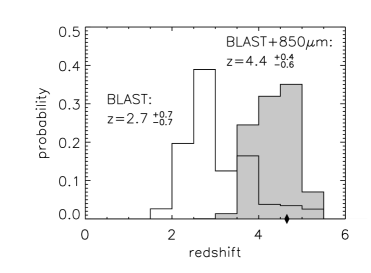
A greater improvement in the accuracy of the sub-mm photometric redshifts can be achieved by following-up BLAST (or SPIRE) surveys with longer-wavelength survey data (e.g. ground-based 850m SCUBA data), or vice-versa. Fig.7 shows the result of simulations that combine BLAST and 850m observations. The SCUBA data include a photometric measurement error of 2.5 mJy, to compare with the shallow UK 8mJy SCUBA survey [Scott et al. 2001], and an absolute calibration error of 9 per cent. The addition of a longer-wavelength datum to the colour information has two advantages. First, the inclusion of one more colour simply assists the ability to constrain the redshift. This is particularly important for galaxies detected only at 500 and/or 350m (40 per cent of the sources in the BLAST surveys), which lie at the highest redshifts. Second, at the BLAST filters all begin to sample the short-wavelength (rest-frame mid-IR) side of the FIR peak. This 850m extension to the BLAST wavelength coverage (250–500m) ensures that there is still a long-wavelength datum that brackets the rest-frame FIR peak (at least until ). A clear illustration of these benefits is shown in Fig.8 where high- galaxies at , that had previously been confused with lower- galaxies at (using only data at 250–500m), are now symmetrically distributed about the regression line over the entire range , with an improved average error of . This correction applies only to a small fraction (4 per cent) of the galaxies detected in all 3 BLAST bands. This sub-mm method therefore continues to provide un-biased estimates of photometric redshifts for the most distant galaxies.
Given this benefit of including longer-wavelength data, the deepest BLAST surveys will be selected to overlap the largest (0.5–1.0 deg2) surveys carried out by the JCMT at 850 m and IRAM at 1.25 mm. The extended wavelength coverage (250m – 1.1 mm) will provide accurate redshift constraints out .
The analysis described in this paper simultaneously makes use of all of the available multi-frequency data (unlike the simple one–colour vs. redshift treatments described elsewhere), and takes into account the measurement errors and uncertainties in the SEDs of the template galaxies used to extrapolate the rest-frame luminosities of the sub-mm galaxies from their observed data.


2.4 Comparison of Optical–IR, Sub-mm and Sub-mm–Radio Photometric Redshifts
The photometric redshifts of galaxies derived from sub-mm BLAST data (250, 350 and 500m), using the method described above, are compared with the true redshifts in our mock catalogues. We have demonstrated that an average accuracy of can be achieved over the range , although, as Table 2 shows, the scatter increases significantly for for the reasons described in §2.3. The photometric redshifts measured from the optical-IR SEDs of galaxies in the HDF [Fernández-Soto, Lanzetta & Yahil 1999, Rowan-Robinson 2001] have an accuracy that varies between over the same redshift range. However we note that the optical galaxies described in this HDF analysis are obviously not drawn from the same population as the sub-mm galaxies. The accuracy of the optical photometric redshifts must be much poorer if the technique is applied to the optically-obscured SCUBA galaxies. The inclusion of longer wavelength data (e.g. 850m) to the BLAST data improves the photometric redshift accuracy to , and extends the redshift range over which we can measure reliable redshifts to (Fig.9 and Table 2). This means that, despite the greater wealth of data describing the optical–IR SEDs of galaxies and the number of available optical–IR bands, the sub-mm photometric redshifts of the sub-mm galaxy population can be determined with a similar accuracy to the optical-IR photometric redshifts of optically-selected galaxies at (Fig.9).
We also draw attention to the lowest-redshift bin, , in Table 2, which shows that the addition of 850m data decreases the redshift accuracy, compared to that derived from the shorter wavelength 250–500m observations. This is due to the fact that the brightness of low-redshift galaxies, assuming our evolutionary model for the luminosity function, will necessarily have low S/N detections in an 850m survey with a sensitivity of 2.5 mJy. Thus the low S/N 850m detections, when combined with the BLAST data, allows a greater range of redshifts to be consistent with the observed colours. Conversely the addition of shorter wavelength SIRTF data with high S/N will improve the accuracy of our photometric redshift estimates at .
The redshift accuracies determined from BLAST and BLAST+850m data (cols. 3 and 4 in Table 2) are compared with those obtained from the identical data in our mock catalogues using the 350 GHz (850m) to 1.4 GHz spectral index () described by Carilli & Yun (2000). The simulations include a photometric error of 7Jy, and absolute calibration error of 3 per cent to compare with the deepest VLA surveys. As Fig.9 clearly illustrates, the photometric redshifts obtained with the sub-mm/radio method suffer a large scatter (), particularly at , where small differences in result in large differences in the redshift estimates. The inability of the 850–1.4 GHz index to determine accurate redshifts at has already been noted by Carilli & Yun [Carilli & Yun 2000]. At , photometric redshifts using are still less accurate than those determined from the sub-mm (250–850m) method described in this paper. This is due, in part, to the larger scatter of the SEDs at radio wavelengths (Fig.2). Naturally, any redshift estimated from a single colour index (e.g. ) is also, in general, going to a offer a less stringent constraint than the use of two or more colours.
| redshift bin | redshift accuracy | |||
|---|---|---|---|---|
| z | optical | BLAST | BLAST | 850m |
| + IR | + 850m | + 1.4 GHz | ||
| 0.5 1.5 | 0.1 (0.2) | 0.3 | 0.5 | 0.7 |
| 1.5 2.5 | 0.5 (0.3) | 0.3 | 0.3 | 1.2 |
| 2.5 3.5 | 0.5 (0.4) | 0.7 | 0.3 | 1.4 |
| 3.5 4.5 | 0.5 (0.2) | 1.1 | 0.7 | 2.1 |
| 4.5 5.5 | 0.3 (0.6) | 2.1 | 0.6 | 2.5 |


2.5 Measuring the Star Formation History from Sub-mm Surveys
The measurement of redshift probability distributions for a large sample of sub-mm galaxies provides the information necessary to derive robust estimates of global properties of the population, such as the SFR history, even if the redshift and luminosity of individual galaxies are not known with a great degree of precision. The photometric redshift distribution of an individual galaxy allows the determination of its probable contribution to the total FIR luminosity density in a given redshift interval.
This calculation is performed via 100 Monte-Carlo samples drawn from the redshift probability distribution for each galaxy in the mock survey. The FIR luminosities of these galaxies are then derived from the fluxes in the mock catalogue and the new synthetic redshifts. The SED from the template library that best represents the colours (including observational errors) of the whole population is used to calculate the necessary k-correction. This SED will in general be different from that assigned in the original catalogue. We then calculate the uncertainty in the k-correction, and therefore the error in the FIR luminosity, by randomly selecting any SED in the template library. Thus we remove any bias introduced into the reconstruction of the SFR through the choice of a single SED intended to represent the whole population of sub-mm galaxies. Finally, the star formation density is calculated from the mean of the Monte-Carlo FIR luminosities, assuming [Hughes, Dunlop, Rawlings 1997].
A deep BLAST survey, combined with a wide-area shallow SCUBA survey ( mJy), can recover the SFR density due to galaxies with at with an accuracy of per cent (Fig.10). The completeness of the survey is per cent above (Fig.10). The SFR density derived from the mock combined BLAST and SCUBA survey is consistent with the preliminary results from the UK 8 mJy SCUBA survey [Scott et al. 2001], and provides a good illustration of the advantage of being able to derive photometric redshifts for the entire survey sample over a large redshift range.
3 Conclusions
Monte-Carlo simulations of multi-wavelength (250–850m) sub-mm surveys show that the majority of the scatter in the derived sub-mm colours will be due, in approximately equal parts, to the dispersion in the SEDs of galaxies in a library of templates, and the observational and calibration errors. Since we can control to some extent the quality of the experimental data, it is still the uncertainty in the observed (or model) SEDs of high- starburst galaxies that will ultimately limit the accuracy of these photometric redshift predictions. Theoretical SEDs, based on radiative transfer models for high- starburst galaxies [Efstathiou, Rowan-Robinson & Siebenmorgen 2000], can help in principle. However the low S/N, and restricted wavelength coverage of the available observational data for high- starburst galaxies are consistent with such a broad range of theoretical models that they currently provide little discriminatory power in determining the most appropriate SEDs to use as templates. Consequently, one of the most straight-forward achievements of BLAST, but no less important, will be simply to provide an accurate empirical model of the temperature-sensitive SEDs for 1000’s of high- galaxies at these critical short sub-mm wavelengths (250–500m).
The product of the simulations of sub-mm surveys described in this paper is the ability to calculate the probability distribution for the redshift of any individual galaxy, taking into account observational errors and the uncertainty in the appropriate template SED, without the requirement to first identify the optical, IR or radio counterpart. These simulations demonstrate that the combination of balloon-borne (airborne or satellite) short-wavelength sub-mm data at 250–500m, and longer-wavelength ground-based 850m data, for a statistical sample of galaxies can provide the rest-frame FIR luminosity distribution, and hence the star formation history of the entire sub-mm population.
The precision of redshift estimates determined from short-wavelength sub-mm observations (250–500m) is encouraging, with a dispersion of (depending on the availability of longer-wavelength ground-based data, m) over the range . This sub-mm precision is comparable to the accuracy of the optical-IR photometric estimates of redshift, at , and significantly better than those provided by the 850m/1.4 GHz spectral index. An important consequence of these sub-mm redshift constraints is the ability to measure the star-formation of luminous sub-mm galaxies () with an unprecedented error of per cent.
The advantage of having a constrained redshift probability distribution for individual sub-mm galaxies, without optical, IR or radio (continuum) counterparts, is that we can now determine the likelihood that a redshifted rotational CO transition-line falls into the frequency range of any particular spectral-line receiver on the next generation of large mm–cm telescopes (e.g. 100-m GBT, 50-m LMT). The opportunities to conduct mm-wavelength spectroscopic follow-up observations that will provide definitive molecular-line redshifts, and dynamical-mass estimates of sub-mm galaxies, are discussed further in Paper II [Aretxaga et al. 2002].
The combination of short-wavelength sub-mm data from BLAST, SPIRE or other facilities, and large single-dish millimetre wavelength telescopes provides a powerful combination to break the redshift deadlock that hinders our ability to understand the evolution and nature of the sub-mm starburst galaxy population.
4 Acknowledgments
We thank the anonymous referee for constructive suggestions to improve this paper. This work has been funded by CONACYT grants 32180-E and 32143-E. The development of BLAST is supported in part by NASA grant NAG5-92291. DHH, IA, and ELC would like to thank Mark Devlin and the Physics & Astronomy Dept. at Univ. of Pennsylvania, Philadelphia for their financial support and hospitality in June 2001 during which time part of this work was carried out.
References
- [Aretxaga et al. 2001] Aretxaga I., Hughes D.H, Chapin E., Gaztañaga E., 2001, in M. de Petris & M. Gervasi, eds, Experimental Cosmology at Millimetre Wavelengths. AIP, in press, astro-ph/0111508
- [Aretxaga et al. 2002] Aretxaga I., Hughes D.H, Chapin E., Gaztañaga E.,Dunlop J.S., 2002 (paper II), MNRAS, submitted
- [Barger et al. 1998] Barger A.J., Cowie L.L., Sanders D.B., Fulton E., Taniguichi, Y., Sato, Y., Kawara, K, Okuda, H., 1998, Nat, 394, 248
- [Barger, Cowie & Richards 2000] Barger A.J., Cowie, L.L, Richards, E.A., 2000, AJ, 119, 2092
- [Bertoldi et al. 2000] Bertoldi F., et al., 2000, in D.J.Wilner et al., eds., Highlights of Astronomy 12, Cold Gas and Dust at High Redshift. in press, astro-ph/0010553
- [Blain 1999] Blain A.W., 1999, MNRAS, 309, 955
- [Blain & Longair 1993] Blain A.W., Longair M.S., 1993, MNRAS, 264, 509
- [Borys et al. 2001] Borys C. Chapman S.C., Halpern M., Scott D., 2001, preprint, astro-ph/0107515
- [Carilli & Yun 1999] Carilli C.L., Yun M.S., 1999, ApJ, 513, L13
- [Carilli & Yun 2000] Carilli C.L., Yun M.S., 2000, ApJ, 530, 618
- [Chapin et al. 2001] Chapin E., Hughes D.H., Kelly B.D., Holland W.S., 2001, in M. de Petris & M. Gervasi, eds, Experimental Cosmology at Millimetre Wavelengths. AIP, in press, astro-ph/0109330
- [Chapman et al. 2000] Chapman S.C. et al., 2000, MNRAS, 319, 318
- [Chapman et al. 2002] Chapman S.C., Scott D., Borys C., Fahlman G.G., 2002, MNRAS, 330, 92
- [Condon 1974] Condon J.J., 1974, ApJ, 188, 279
- [Désert, Boulanger & Puget 1990] Désert F.X., Boulanger F., Puget J.L., 1990, A&A, 237, 215
- [Devlin et al. 2001] Devlin M. et al., 2001, in J.Lowenthal & D.H.Hughes, eds, Deep Millimetre Surveys: Implications for Galaxy Formation and Evolution. World Scientific, in press, astro-ph/0012327
- [Downes et al. 1999] Downes D., et al., 1999, A&A, 347, 809
- [Dunlop 2001] Dunlop J.S., 2001, in M. van Bemmel, B. Wilkes, P. Barthel, eds., The FIR and Submillimeter Spectral Energy Distributions of Active and Starburst Galaxies, Elsevier New Astronomy Reviews, in press, astro-ph/0101297
- [Dunne, Clements & Eales 2000] Dunne L., Clements D.L., Eales S.A., 2000, MNRAS, 319, 813
- [Eales et al. 1999] Eales S.A., Lilly S., Gear W., Dunne L., Bond J.R., Hammer F., Le Fèvre O., Crampton D., 1999, ApJ, 515, 518
- [Eales et al. 2000] Eales S.A., Lilly S., Webb T., Dunne L., Gear W., Clements D.L., Yun Min, 2000, AJ, 120, 2244
- [Efstathiou, Rowan-Robinson & Siebenmorgen 2000] Efstahiou A., Rowan-Robinson M., Siebenmorgen R., 2000, MNRAS, 313, 734
- [Fernández-Soto, Lanzetta & Yahil 1999] Fernández-Soto A., Lanzetta K., Yahil A., 1999, ApJ, 513, 34
- [Fixsen et al. 1998] Fixsen D.J., Dwek E., Mather J.C., Bennett C.L., Shafer R.A., 1998, ApJ, 508, 123
- [Fox et al. 2001] Fox M.J., et al., 2001, MNRAS, in press, astro-ph/0107585
- [Frayer et al. 1998] Frayer D.T., Ivison R.J., Scoville N.Z., Yun M., Evans M.S., Smail I., Blain A.W., Kneib J.-P., 1998, ApJ, 506, L7
- [Frayer et al. 2000] Frayer D.T., Smail I., Ivison R.J., Scoville N.Z., 2000, AJ, 120, 1668
- [Gautier et al. 1992] Gautier T.N., Boulanger F., Pérault M., Puget J.L., 1992, AJ, 103, 1313
- [Gaztañaga & Hughes 2001] Gaztañaga E., Hughes D.H., 2001, in J.Lowenthal & D.H.Hughes, eds, Deep Millimetre Surveys: Implications for Galaxy Formation and Evolution. World Scientific, in press, astro-ph/0103127
- [Gear et al. 2000] Gear W.K., Lilly S.J., Stevens J.A., Clements D.L., Webb T.M., Eales S.A., Dunne L., 2000, MNRAS, 316, 51 Advanced Technology MMW, Radio, and Terahetrz Telescopes.
- [Hauser et al. 1998] Hauser M.G., et al. 1998, ApJ, 508, 25
- [Holland et al. 1999] Holland W.S., et al., 1999, MNRAS, 303, 659
- [Hughes 2000] Hughes D.H., 2000, in A.Mazure, O. Le Févre, V. Le Brun, eds, Clustering at High Redshift. ASP Conf. 200, 81, astro-ph/0003414
- [Hughes, Dunlop, Rawlings 1997] Hughes D.H., Dunlop J.S., Rawlings S., 1997, MNRAS, 289, 766
- [Hughes et al. 1998] Hughes D.H., et al., 1998, Nat, 394, 241
- [Hughes & Gaztañaga 2000] Hughes D.H., Gaztañaga, E., 2000, in F.Favata & A.Kass, eds, Star formation from the Small to the Large Scale. ESA SP-445, p.29, astro-ph/0004002
- [Ivison et al. 2000] Ivison R.J., Smail I., Barger A.J., Kneib J.-P., Blain A.W., Owen F.N., Kerr T.H., Cowie L.L., 2000, MNRAS, 315, 209
- [Ivison et al. 1999] Ivison R.I., et al., 1999, Ap&SS, 266, 285
- [Knudsen, van der Werf & Jaffe 2001] Knudsen K.K., van der Werf P.P., Jaffe W., 2001 in J.Lowenthal & D.H.Hughes, eds, Deep Millimetre Surveys: Implications for Galaxy Formation and Evolution. World Scientific, in press, astro-ph/0009024
- [Kreysa et al. 1998] Kreysa E. et al., 1998, in T.G. Phillips, ed, Proceedings of SPIE Vol. 3357, Advanced Technology MMW, Radio, and Terahetrz Telescopes.
- [Lagache & Puget 2000] Lagache G., Puget J.L, 2000, A&A, 355, L17
- [Lilly et al. 1999] Lilly S.J., Eales S.A., Gear W.K., Hammer F., Le Fèvre O., Crampton D., Bond J. R., Dunne L., 1999, ApJ, 518, 641
- [Lutz et al. 2001] Lutz D., et al., 2001, A&A, 378, 70
- [Madau et al. 1996] Madau P., Ferguson H.C., Dickinson M.E., Giavalisco M., Steidel C.C., Fruchter A., 1996, MNRAS, 283, 1388
- [Peacock et al. 2000] Peacock J.A., et al. 2000, MNRAS, 318, 535
- [Puget et al. 1996] Puget J.-L., Abergel A., Bernard J.-P., Boulanger F., Burton W.B., Désert F.-X., Hartmann D., 1996, A&A, 308, L5
- [Richards 1999] Richards E.A., 1999, ApJ, 513, L9
-
[Rowan-Robinson 2001]
Rowan-Robinson M., 2001, ApJ, submitted,
http://astro.ic.ac.uk/mrr/photz/photzapj.ps - [Sanders & Mirabel 1996] Sanders D.B., Mirabel I.F., 1996, ARA&A, 34, 749
- [Saunders et al. 1990] Saunders W., Rowan-Robinson M., Lawrence A., Efstathiou G., Kaiser N., Ellis R.S., Frenk C.S., 1990, MNRAS, 242, 318
- [Schlegel, Finkbiener & Davis 1998] Schlegel D.J., Finkbiener D.P., Davis, M., 1998, ApJ, 500, 525
- [Scott et al. 2001] Scott S., et al., 2001, MNRAS, in press, astro-ph/0107446
- [Smail et al. 1997] Smail I., Ivison R.J., Blain A.W., 1997, ApJ, 490, L5
- [Smail et al. 1999] Smail I., Ivison R.J., Kneib J.-P., Cowie L.L., Blain A.W., Barger A.J., Owen F.N., Morrison G., 1999, MNRAS, 308, 1061
- [Smail et al. 2000] Smail I., Ivison R.J., Owen F.N., Blain A.W., Kneib J.-P., 2000, ApJ, 528, 612
- [Smail et al. 2001] Smail I., Ivison R.J., Blain A.W., Kneib J.-P., 2001, astro-ph/0112100
- [Steidel et al. 1996] Steidel C.C., Giavalisco M., Pettini M., Dickinson M., Adelberger K.L., 1996, ApJ, 462, L17