The European Large Area ISO Survey VII: ROSAT observations of ELAIS sources
Abstract
We present a cross-correlation between the ELAIS 15m ISO survey with the ROSAT (0.1-2 keV) all-sky survey and the pointed observations WGACAT source catalogue. The resulting sample contains 15 objects. Optical spectroscopic identifications exist for 13 objects: 6 broad-line QSOs, 4 narrow line galaxies or type-2 AGN (NLG) and 3 stars. We have used both the X-ray to IR luminosity flux ratio and the X-ray hardness ratios diagnostics to estimate the amount of obscuration in these objects. The X-ray spectrum of the narrow-line galaxies does not present strong evidence for obscuration; however, the low ratio combined with the high X-ray luminosities suggest that at least one of the narrow line galaxies is associated with an obscured Seyfert nucleus. 4 out of 6 QSOs present high ratios and steep X-ray spectra with . One QSO (ELAISC15-J133442+375736) at a redshift of z=1.89, has an abnormally low X-ray/IR flux ratio, with its infrared luminosity approaching that of an hyperluminous galaxy (). Finally, one radio-loud QSO is the hardest X-ray source in our sample, presenting strong evidence for a high absorbing column ().
Keywords: Cosmology: observations - X-ray: galaxies- Infrared: galaxies
1 Introduction
The standard Unification model (Antonucci & Miller 1985) asserts that the nuclei in both type-1 and type-2 Active Galactic Nuclei (AGN) have basically the same structure containing a supermassive black hole, an accretion disk, a molecular torus and a broad line region. Then their classification as type-1 or type-2 AGN depends solely on the viewing angle. Specifically, if the source is observed at sufficiently high inclination angle and thus the line of sight intersects the torus, it would be classified as a Seyfert-2, whereas for all other orientations it would be deemed to be a Seyfert-1. X-ray observations of Seyfert-2 galaxies with Ginga, ASCA and RXTE (Smith & Done 1996; Turner et al. 1997; Georgantopoulos & Papadakis 2001) observe large absorbing columns supporting this scenario. However, optical surveys for AGN have failed so far to produce large numbers of obscured AGN beyond the local Universe.
In contrast, recent X-ray surveys have proved very useful in finding evidence for the presence of such obscured AGN population at moderate to high redshifts (). In particular, ROSAT surveys (0.1-2 keV) have detected a number of narrow-line galaxies (NLG) the majority of which are associated with obscured AGN (Boyle et al. 1995, Schmidt et al. 1998, Lehmann et al. 2000). ASCA and BeppoSAX surveys have also found some examples of such an obscured AGN population (Boyle et al. 1998; Georgantopoulos et al. 1999; Fiore et al. 1999; Akiyama et al. 2000), in the hard 2-10 keV band which is less prone to photoelectric absorption. These AGN present column densities typically higher than while in some cases their optical spectra may present broad lines with only moderate optical reddening. The above results have been corroborated by recent Chandra and XMM surveys (eg Mushotzky et al. 2000, Brandt et al. 2001, Hasinger et al. 2001). Moreover, ASCA (Nakanishi et al. 2000), Chandra (Norman et al. 2001) and XMM (Lehmann et al. 2001) have produced the first examples of the long sought type-2 QSO population i.e. with no signs of broad emission lines, similar to Seyfert-2 galaxies in the local Universe.
Obscured AGN should emit copious amounts of IR radiation as the obscuring matter reprocesses the optical radiation. Therefore, the combination of X-ray and IR observations is a powerful tool in the detection of such obscured objects. In particular, using both the and the X-ray hardness ratios, we can detect the obscured AGN, due to the fact that the latter quantities are excellent indicators of high photoelectric absorption.
Green et al. (1992), combined far-infrared (IRAS) and X-ray (Einstein) data, finding a significant correlation between luminosities in the 60-m and 0.5-4.5 keV. They also find that the ratios of broad-line AGN are significantly higher than those of narrow-line AGN and star-forming galaxies. In a similar way, Boller et al. (1992) cross-correlated the ROSAT with the IRAS all-sky surveys. The resulting sample consists of about 200 objects of which many are obscured Seyfert galaxies (Moran, Halpern & Helfand 1996). More recently, Gunn et al. (2001) have observed with ISOPHOT onboard ISO 15 sources (QSOs and narrow-line AGN) detected in deep ROSAT fields. The large number of narrow line objects detected suggests that large amounts of obscuring matter are present in these objects. Finally, Alexander et al. (2001) observed with BeppoSAX an area of 0.7 from the ELAIS ISO survey (Oliver et al. 2000, Serjeant et al. 2000) to a flux limit of in the 2-10 keV band. They find 17 common sources in the hard 2-10 keV band and the band. Surprisingly, no obscured AGN are among these sources.
Here we cross-correlate the ELAIS (Oliver et al. 2000; Serjeant et al. 2000) 15m ISO survey with the ROSAT all-sky survey and the pointed observations WGACAT source catalogues. Willott et al. (2001) present preliminary results on Chandra 0.3-10 keV observations of ACIS-I fields, covering 0.14 and probing fluxes as faint as in the 2-10 keV band. The ROSAT observations presented here are complementary as they cover the full area of the ELAIS survey, albeit at much brighter fluxes. Our aim is to find a number of obscured AGN especially at high redshift and explore their nature. We note that although the ROSAT passband is soft (0.1-2 keV) and therefore more susceptible to photoelectric absorption as compared to either BeppoSAX or Chandra, at high redshifts the K-correction diminishes the effective obscuring column as it moves the photoelectric absorption cut-off towards lower energies.
The plan of this paper is the following: In section 2, we describe the ELAIS and ROSAT catalogues used as well as the cross-correlation results, while in sections 3 and 4 we present the discussion and conclusions.
2 Observations
2.1 The European Large Area ISO Survey: (ELAIS)
The European Large Area ISO Survey (ELAIS) has surveyed 12 square deegres of the sky at 15m, 90m and subsets of this area at 6.75m and 175m using the ISOCAM (Cesarsky et al. 1996) onboard the Infrared Space Observatory (ISO), (Kessler et al. 1996). The catalogue, a reliable subset of the preliminary analysis catalogue (Serjeant et al. 2000), contains 484 sources down to a flux limit of in the 15 band. The positional error of the catalogue is typically 3 arcsec (Serjeant et al. 2000). A large number of the 15m sources (with optical counterparts down to ) have been spectroscopically identified containing a large fraction of AGN and star-forming galaxies (Cabrera-Guerra et al., Pérez-Fournon et al., Gruppioni et al. in preparation and González-Solares et al. 2001).
2.2 ROSAT data
We have used ROSAT data from the PSPC (Position Sensitive Proportional Catalogue Counter) operating in the 0.1-2.4 keV band. In particular, we have used the RASSBSC, RASSFSC and WGACAT point source catalogues. RASSBSC (ROSAT All-Sky Survey Bright Source Catalogue) is derived from the all-sky ROSAT survey and contains 18811 sources (Voges et al. 1999) in the energy band 0.1-2.4 keV. RASSFSC (ROSAT All-Sky Survey Faint Source Catalogue) is an extension of the RASSBSC (Voges et al. 2000) and contains approximately 106,000 sources. WGACAT is a point source catalogue generated from all ROSAT PSPC pointed observations (see White, Giommi & Angelini 1994). The last version of this catalogue contains about 88,000 detections, with more than 84,000 individual sources, obtained from 4160 sequences.
The PSPC has an energy resolution of 0.5 keV at 1 keV, but limited spatial resolution (FWHM ). The positional rms error of the PSPC detector is typically 15 arcsec, although the exact error depends on the brightness of the source. Throughout this paper, X-ray luminosities are calculated from X-ray fluxes for a Hubble constant of km s-1 Mpc-1 and , assuming an average spectrum of .
2.3 The ELAIS/ROSAT compilation
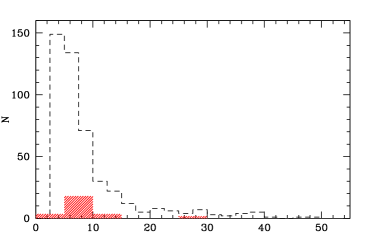
We have performed a positional cross-correlation of the ELAIS catalogue with the above four ROSAT catalogues, within . The resulting sample contains 15 objects. Note that ELAISC15-J050226-304113 and ELAISC15-J05228-304140 are associated with the same X-ray source; both ELAIS sources are located at the same redshift (z=0.191). We have performed 20 simulations in order to assess the probability of chance coincidences. We are offseting the actual ELAIS source coordinates by a few arcminutes and then we are repeating the cross-correlation. We find that the chance coincidence probability is low. In particular we find that for the RASSBSC we expect false coincidences. For the RASSFSC and WGACAT the numbers are 0.3 and 0.7 respectively. In Fig. 1 we plot the IR flux distribution of our sources relative to the full ELAIS sample. For 13 of our sources, spectroscopic identifications exist either through the ELAIS spectroscopic follow-up program or through the literature. Details of the 15 sources are presented in table 1: column (1) ELAIS name; column (2) X-ray position; (3) angular separation between the IR and X-ray position (4) the 15m flux (mJy) as listed in Serjeant el al. (2000) (5) radio flux (mJy) as listed in Ciliegi el al. (1999) (6) redshift (7) object classification from: a) Gruppioni et al. (in preparation) b) Cabrera-Guerra et al. (in preparation) or Pérez-Fournon et al. (in preparation) c) from McHardy et al. (1998) d) NASA Extragalactic Database (NED) (8) the ROSAT catalogues in which the source has been detected ( 1 RASSBSC,2 RASSFSC, 3 WGACAT, 4 ROSHRI). Note that three of our sources have been also detected in the ROSAT HRI source catalogue, ROSHRI, (ledas-www.star.le.ac.uk/rosat/rra/roshri) and therefore have more accurate X-ray positions. Hence, we list here the HRI X-ray positions for these sources. In table 2 we present the X-ray properties of our sources: column (2) gives the logarithmic X-ray Luminosity () in the 0.1-2 keV band; (3) the X-ray flux (0.1-2) keV, in units of 10-13erg sec-1 cm-2; note that a few of our objects have been detected in more than one ROSAT catalogue; for these we present here the X-ray flux from the observation with the highest photon statistics. (4) X-ray photon index together with the error. The photon indices were estimated from the hardness ratio defined as (h-m)/(h+m) where h and m correspond to the 0.9-2 keV and 0.5-0.9 keV (RASSFSC and RASSBSC) and 0.9-2 keV and 0.4-0.9 keV bands (WGACAT). Unfortunately, two objects have very poor photon statistics and therefore their spectral index could not be calculated (ELAISC15-J003015-430333 and ELAISC15-J003515-433355).
| Name | X-ray position | (arcmin) | Classification | ROSAT catalogue | |||
|---|---|---|---|---|---|---|---|
| ELAISC15-J143143+330131 | 14 31 43.4 +33 01 31 | 0.083 | 4.95 | - | - | 1,3 | |
| ELAISC15-J133451+374616 | 13 34 51.3 +37 46 19 | 0.078 | 12.13 | - | - | Stard | 1,3,4 |
| ELAISC15-J160623+540555 | 16 06 24.1 +54 05 59 | 0.174 | 8.00 | 168 | 0.875 | QSOb | 2 |
| ELAISC15-J160706+550335 | 16 07 04.9 +55 03 58 | 0.414 | 6.03 | - | - | Starb | 2 |
| ELAISC15-J161521+543147 | 16 15 20.5 +54 32 12 | 0.423 | 5.74 | - | 0.474 | QSOb | 2,3 |
| ELAISC15-J163310+405644 | 16 33 08.9 +40 56 32 | 0.289 | 6.26 | - | 0.136 | NLGb | 2 |
| ELAISC15-J163709+414030 | 16 37 08.9 +41 40 54 | 0.401 | 12.51 | 8.37 | 0.765 | QSOb,d | 2,3 |
| ELAISC15-J003015-430333 | 00 30 14.5 -43 03 23 | 0.190 | 6.15 | - | 1.564 | QSOa | 2 |
| ELAISC15-J003515-433355 | 00 35 15.9 -43 33 50 | 0.183 | 29.40 | - | - | 2 | |
| ELAISC15-J050212-302828 | 05 02 12.0 -30 28 23 | 0.083 | 9.38 | - | 0.86 | QSOa | 2,3 |
| ELAISC15-J050226-304113 | 05 02 26.4 -30 41 28 | 0.264 | 9.64 | - | 0.191 | NLGa | 3 |
| ELAISC15-J050228-304140 | 05 02 26.4 -30 41 28 | 0.398 | 5.02 | - | 0.191 | NLG | 3 |
| ELAISC15-J133401+374912 | 13 33 59.6 +37 49 12 | 0.28 | 7.77 | - | 0.062 | NLGd | 3,4 |
| ELAISC15-J133414+375133 | 13 34 14.4 +37 51 34 | 0.08 | 9.58 | - | - | Starc | 3,4 |
| ELAISC15-J133442+375736 | 13 34 44.9 +37 57 17 | 0.500 | 4.13 | - | 1.89 | QSOc | 3 |
| Name | |||
|---|---|---|---|
| ELAISC15-J143143+330131 | 9.80 | 3.17 | |
| ELAISC15-J133451+374616 | 9.95 | 2.22 | |
| ELAISC15-J160623+540555 | 44.91 | 3.15 | 0.43 |
| ELAISC15-J160706+550335 | 1.35 | 2.84 | |
| ELAISC15-J161521+543147 | 44.44 | 4.07 | 2.62 |
| ELAISC15-J163310+405644 | 42.65 | 0.90 | 0.67 |
| ELAISC15-J163709+414030 | 45.11 | 6.77 | 2.84 |
| ELAISC15-J003015-430333 | 45.44 | 3.00 | - |
| ELAISC15-J003515-433355 | 5.28 | - | |
| ELAISC15-J050212-302828 | 44.98 | 3.90 | 2.51 |
| ELAISC15-J050226-304113 | 43.13 | 1.37 | 1.85 |
| ELAISC15-J050228-304140 | 43.13 | 1.37 | 1.85 |
| ELAISC15-J133401+374912 | 41.28 | 0.19 | 2.11 |
| ELAISC15-J133414+375133 | 0.16 | 3.95 | |
| ELAISC15-J133442+375736 | 44.32 | 0.15 | 3.28 |
2.4 Notes on Individual Objects
-
•
ELAISC15-J160623+540555 It is the hardest object in X-rays, having . Recently, Pérez-Fournon et al. (in preparation) discovered that this object presents broad-lines. The redshift as measured from the Mg II line is 0.875. If we assume that then the column density is at the QSO’s rest-frame. It is also detected in the radio follow-up of the ELAIS fields with flux of 167mJy (Ciliegi et al. 1999). Furthermore, its ratio is comparable to those of QSOs.
-
•
. This unidentified source presents a steep X-ray spectrum together with a high ratio, . The above suggest that most probably this source is a QSO.
-
•
Again for this source we have no optical identification. The ratio for this object places it marginally in the narrow-line galaxy regime. Still, it has a steep spectrum with . If this object is associated with an obscured AGN, the steep X-ray emission may be due to a scattered component.
-
•
This QSO (z=1.89) presents a very steep spectrum in X-rays () with X-ray luminosity of erg s-1. This object could be associated with an intrinsically weak X-ray source. Interestingly, the infrared luminosity is very high approaching the luminosity of a hyperluminous galaxy.
-
•
: This is classified as a star-forming galaxy according to Pérez-Fournon et al., (in preparation). Its luminosity is erg s-1, higher than those of known star-forming galaxies. The high X-ray luminosity is in stark contrast with the optical spectrum. This object bears close resemblance with the “composite” Seyfert/star-forming galaxies of Moran et al. (1996). Unfortunately, the X-ray spectrum has poor photon statistics and thus it cannot provide additional constraints on the nature of this object. The is low typical of obscured Seyfert galaxies in the local Universe. Finally, considering that this source is an AGN then the estimated infrared luminosity, respectively.
-
•
This is classified as a star according to Pérez-Fournon et al., (in preparation). The optical magnitude is very bright ().
-
•
This is classified as a star according to the NASA Extragalactic Database (NED). Still its ratio is high for a normal star (see Stocke et al. 1991) suggesting that this is probably an X-ray binary.
3 DISCUSSION
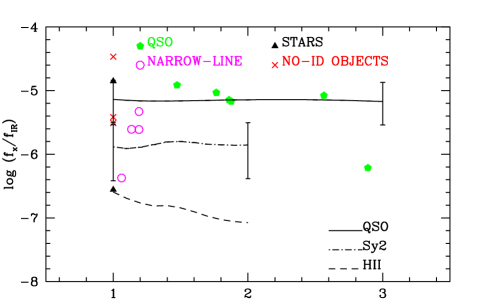
In figure 2 we plot the estimated as a function of redshift for our 15 sources. The lines model the expected evolution of the ratio for various classes of extragalactic object, namely QSOs, Seyfert-2 and narrow-line galaxies. The solid line (QSOs) is based on the average QSO SED (spectral energy distribution) produced by Elvis et al. (1994). The dash line (star-forming galaxies) and the dot-dash line (Seyfert-2) are based on infrared SEDs generated using the Xu et al. (1998) model (see also Alexander et al. 2001). The errors on the above lines correspond to the statistical spread in X-ray/IR colours. Note that, the QSO X-ray/IR ratios in our sample are in general in good agreement with the corresponding model. The only exception is ELAISC15-J133442+375736, the highest redshift QSO (z=1.89) in our sample. The narrow line galaxies are again in good agreement with the predicted ratio with the possible exception of ELAISC15-J050228-304140 which has a somewhat higher approaching the QSO regime. Note however that this is the “double” ISO source at z=0.191 which is associated with a single X-ray source. Therefore we are unable to assess the exact amount of the X-ray emission which originates from each galaxy and to draw conclusions on the nature of this object based on the ratio alone.
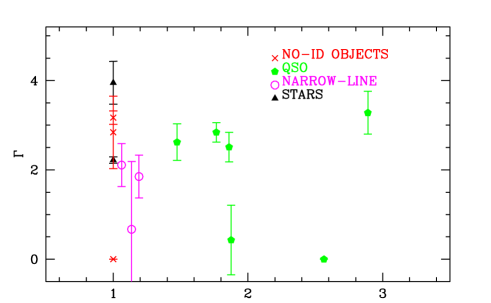
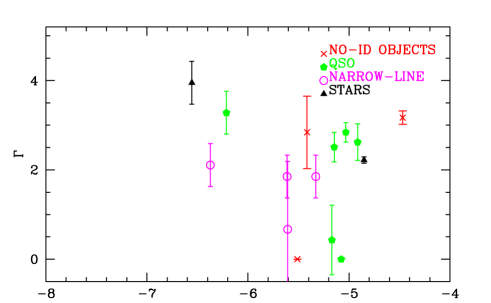
The photon indices provide additional evidence on the nature of these objects. In Fig. 3 we present the derived X-ray spectrum, , as a function of redshift while in Fig. 4 the ratio as a function of . From Fig. 4 it becomes obvious that most QSOs have soft X-ray spectra (). These values are quite typical of QSO spectra in the soft ROSAT band (Schartel et al. 1996; Fiore et al. 1997; Blair et al. 2000). Interestingly, the high redshift QSO ELAISC15-J133442+375736 which presents the lowest ratio, compared to the other QSOs, also shows a steep spectrum. The steep spectral index observed () clearly argues against an absorbed AGN scenario. Therefore, the low ratio could be attributed to either an intrinsically low X-ray emission (similar to PG1011-040, Gallagher et al. 2001) or alternatively to high IR luminosity. Indeed, this source has a luminosity of . For comparison we note that our source has an ratio a few times lower than that of the hyperluminous source () ELAISP90-J164010+410502 (Morel et al. 2001) which has been detected in the 90 ELAIS sample. The hardest X-ray source in our sample is ELAISC15-J160623+540555. This is a radio-loud QSO at a redshift of z=0.875. The hardness ratio corresponds to a photon index of 0.43 or alternatively to a column density of (assuming ) at the QSO’s rest-frame. This is not unphysical for radio-loud QSOs. Indeed, Reeves & Turner (2000) using ASCA observations of a sample of 35 radio-loud QSOS, find that a large fraction of these present absorbing columns of the order of or higher. The same conclusions have been reached by Fiore et al. (1998) using ROSAT.
The narrow-line galaxies have soft X-ray spectra all consistent with . Only ELAISC15-J163310+405644 presents a harder X-ray spectrum ( but within the large uncertainty this is still consistent with the spectra of the other narrow-line objects. Such soft X-ray spectra are compatible with X-ray observations of star-forming galaxies in the ROSAT band (see Read et al. 1997; Dahlem et al. 1998). The X-ray luminosities of these objects yield additional clues on the nature of these objects. It is becoming clear that star-forming galaxies cannot exceed luminosities of in the X-ray band (eg Moran et al. 1996; Zezas, Georgantopoulos & Ward 1998). Then the high luminosity of ELAISC15-J163310+405644 implies the presence of an active nucleus in this object. Still, the optical spectrum presents no sign of nuclear activity. This object has very similar properties to the “composite” galaxies presented in detail in Veron et al. (1997) and Moran et al. (1996). The “composites” have optical spectra which would classify these as star-forming galaxies on the basis of the diagnostic line ratio diagram of Veilleux & Osterbrock (1987), but still their X-ray luminosities are typical of AGN. The “double” ISO source again presents a high X-ray luminosity (). Then both or at least one of the sources are associated with an AGN. Alternatively, the X-ray source could be associated with a cluster of galaxies (indeed both ELAIS sources have the same redshift) while the IR emission could originate from star-forming processes in the two galaxies. Finally, ELAISC15-J133401+374912 presents a low X-ray luminosity typical of star-forming galaxies suggesting that this may be the only “bona-fide” normal galaxy in our sample. Of course the possibility that this hosts a low luminosity AGN cannot be ruled out.
4 Summary and Conclusions
We have presented a cross-correlation between the ELAIS (Oliver et al. 2000; Serjeant et al. 2000) 15m ISO survey with the ROSAT (0.1-2 keV) all-sky survey and pointed observations source catalogues. We found 15 common objects, 13 of which have optical indentifications: 6 broad-line QSOs (), 4 narrow-line galaxies or type-2 AGN ( and 3 stars. Utilising the measured and the X-ray hardness ratios we can investigate whether our sources present large amounts of obscuration. We find that 5/6 QSOs present steep spectra arguing against the presence of large (more than a few times ) obscuring columns. The hardest source in our sample is a radio-loud QSO having a column density of . This is a radio-loud QSO and therefore the presence of a large obscuring column is not surprising. The highest redshift QSO has a low ratio suggesting that its X-ray emission is weak relative to its powerful IR luminosity which is borderline to that of hyperluminous galaxies.
On the other hand, the narrow-line galaxies in general have soft X-ray spectra being consistent with and therefore with both the star-forming galaxy and AGN spectra. ELAISC15-J163310+405644 presents a harder X-ray spectrum ( but within the large uncertainty this is still consistent with the spectra of the other narrow-line objects. On the basis of the high X-ray luminosity ( ), it becomes clear that at least one of the four narrow line objects (ELAISC15-J163310+405644) harbours an AGN. Then the low X-ray to IR flux ratio implies that we are only viewing the scattered or star-forming component in the ROSAT passband. This object presents additional interest as the optical spectrum classifies it as a star-forming galaxy and demonstrates that X-ray observations play a critical role in identifying the true nature of IR sources.
In conclusion, the majority of extragalactic objects in our sample falls roughly into two categories: high redshift non-obscured radio-quiet QSOs and low redshift absorbed AGN or star-forming galaxies. We have not found any evidence for the presence of absorbed radio-quiet QSOs at high redshift similar to those found in BeppoSAX or ASCA surveys. Deeper X-ray observations of a few of the ELAIS fields with Chandra and XMM are expected to shed more light on the number density and the nature of these enigmatic objects.
Acknowledgements
This work was supported by EC Network programme ’POE’ (grant number HPRN-CT-2000-00138). IPF, FCG and EGS were supported by project PB98-0409-CO2-01 of the Spanish Ministerio de Ciencia y Techología.
References
- [] Akiyama, M., et al., 2000, ApJ, 532, 700
- [] Alexander, M. D., et al., 2001, ApJ, 554, 18
- [] Antonucci, R., & Miller, J. S., 1985, ApJ, 297, 621
- [] Blair, A. J., Stewart, G. C., Georgantopoulos, I., Boyle, B. J., Griffiths, R. E., Shanks, T., Almaini, O., 2000, MNRAS, 314, 138
- [] Boller, T., Meurs, E. J. A., Brinkmann, W., Fink, H., Zimmermann, U., Adorf, H. M., 1992, A&A, 261, 57
- [] Boyle, B. J., McMahon, R.G., Wilkes, B.J., Elvis, M., 1995, MNRAS, 272, 462
- [] Boyle, B. J., Almaini, O., Georgantopoulos, I., Blair, A. J., Stewart, G. C., Griffiths, R. E., Shanks, T., Gunn, K. F., 1998, MNRAS, 297, L53
- [] Brandt, W. N., Hornschemeier, A. E., Schneider, D. P., Alexander, D. M., Bauer, F. E., Garmire, G. P., Vignali, C., 2001, ApJ, 558, L5
- [] Cesarsky, C. J., et al., 1996, A&A, 315, L32
- [] Ciliegi, P., et al., 1999, MNRAS, 302, 222
- [] Dahlem, M., Weaver, K. A., Heckman, T. M., 1998, ApJS, 118, 401
- [] Gallagher, S. C., Brandt, W. N., Sambruna, R. M., Mathur, S., Yamasaki, N., 2001, ApJ, 546, 795
- [] Georgantopoulos, I., Almaini, O., Shanks, T., Stewart, G. C. Griffiths, R. E., Boyle, B. J., Gunn, K. F., 1999, MNRAS, 305, 125
- [] Georgantopoulos, I., Papadakis, I. E., 2001, MNRAS, 305, 125
- [] González-Solares et al., 2001, in Proc. of ESA Conference, ”The Promise of First”, in press
- [] Green, P. J., Anderson, S. F., Ward, M. J., 1992, MNRAS, 254, 30
- [] Gunn, K. F., et al., 2001, MNRAS, submitted
- [] Elvis, M. et al., 1994, ApJS, 72, 1
- [] Fiore, F., Matt, G., Nicastro, F., 1997, MNRAS, 284, 731
- [] Fiore, F., Elvis, M., Giommi, P., Padovani, P., 1998, ApJ, 492, 79
- [] Fiore, F., La Franca, F., Giommi, P., Elvis, M., Matt, G., Comastri, A., Molendi, S., Gioia, I., 1999, MNRAS, 306, L55
- [] Hasinger, G., et al., 2001, A&A, 365, 45
- [] Kessler, M. F., et al., 1996, A&A, 315, L27
- [] Lehmann, I., et al. 2000, A&A, 354, 35
- [] Lehmann, I., Hasinger, G., Murray, S. S., Schmidt, M., 2001, Proceedings for X-rays at Sharp Focus Chandra Science Symposium
- [] McHardy, I. M., et al., 1998, MNRAS, 295, 641
- [] Morel, T., et al., 2001, MNRAS, 327, 1187
- [] Moran, E. C., Halpern, J. P., Helfand, D. J., 1996, ApJS, 106, 341
- [] Mushotzky, R. F., Cowie, L. L., Barger, A. J., Arnaud, K. A., 2000, Nature, 404, 459
- [] Nakanishi, K., Akiyama, M., Ohta, K., Yamada, T., 2000, ApJ, 534, 587
- [] Norman, C., et al., 2001, submitted, astro-ph/0103198
- [] Oliver, S., et al., 2000, MNRAS, 316, 749
- [] Read, A. M., Ponman, T. J., Strickland, D. K., 1997, MNRAS, 286, 629
- [] Reeves, J. N., Turner, M. J. L., 2000, MNRAS, 316, 234
- [] Schartel, N., et al., 1996, MNRAS, 283, 1015
- [] Schmidt, M., et al., 1998, A&A, 329, 495
- [] Serjeant, S., et al., 2000, MNRAS, 316, 768
- [] Smith, D. A., &, Done, C., 1996, MNRAS, 280, 355
- [] Stocke, J. T., Case, J., Donahue, M., Shull, J. M., Snow, T. P., 1991, ApJ, 374, 72
- [] Turner, T. J., George, I. M., Nandra, K., Mushotzky, R. F., 1997, ApJ, 488, 164
- [] White, N. E., Giommi, P., Angelini, L., 1994, AAS, 185, 4111
- [] Veilleux, S.; Osterbrock, D. E., 1987, ApSJ, 63, 295
- [] Veron, P., Goncalves, A. C., Veron-Cetty, M.-P., 1997, A&A, 319, 52
- [] Voges, W., et al., 1999, A&A, 349, 389
- [] Voges, W., et al., 2000, IAUC, 7432, 3
- [] Willott, C.J. et al., 2001, astro-ph/0105560
- [] Xu, C., et al., 1998, ApJ, 508, 576
- [] Zezas, A. L., Georgantopoulos, I., Ward, M. J., 1998, MNRAS, 301, 915