Detection of CDM Substructure 11institutetext: Harvard-Smithsonian Center for Astrophysics, Cambridge, MA 02420 22institutetext: Dept. of Physics, UCSD, La Jolla, CA 92093
Detection of CDM Substructure
Abstract
The properties of multiple image gravitational lenses require a fractional surface mass density in satellites of ( at 90% confidence) that is consistent with the expectations for CDM. The characteristic satellite mass scale, -, is also consistent with the expectations for CDM. The agreement between the observed and expected density of CDM substructure shows that most low mass galactic satellites fail to form stars, and this absence of star formation explains the discrepancy between the number of observed Galactic satellites and CDM predictions rather than any modification to the CDM theory such as self-interacting dark matter or a warm dark matter component.
1 Introduction
The existence of a “CDM crisis” (e.g. Moore 2001) rests on three pillars. First, the central rotation curves of some dwarf and low surface brightness galaxies may be inconsistent with the expectation of a central dark matter density cusp, as is discussed by Swaters and McGaugh in these proceedings. Second, the observed and predicted magnitudes and distributions of the baryonic angular momentum may be inconsistent, as discussed by Dekel and Burkert in these proceedings. Third, the Galaxy has far fewer satellites than expected for a CDM halo of its mass (e.g. Moore et al. 1999, Klypin et al. 1999). It is this third pillar of the crisis which we will undermine with our present analysis.
The satellite crisis essentially boils down to the observation that cluster and galaxy mass halos show similar amounts of substructure in CDM simulations, while observations appear to show that the Galaxy and the Coma cluster have very different amounts of substructure. The simplest solution is to suppress star formation in low mass halos relative to high mass halos (e.g. Bullock et al. 2000). A similar effect is required to explain the difference between the steep slope of the halo mass function () and the shallow slope of the luminosity function () independent of the satellite problem (e.g. Scoccimarro et al. 2001, Kochanek 2001, Chiu et al. 2001). More exotic solutions are to destroy the satellites using self-interacting dark matter (e.g. Spergel & Steinhardt 2000) or to avoid creating them by adding warm dark matter (e.g. Bode et al. 2001, Colin et al. 2000). We can distinguish between these possibilities only if we have a probe which is sensitive to the presence of mass in the absence of light.
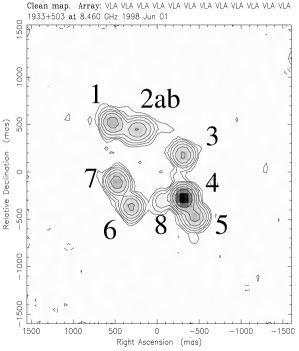
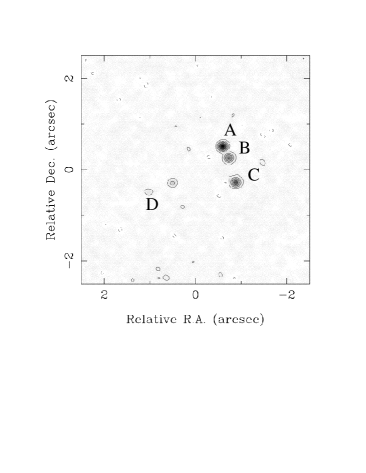
Moore et al. (1999) also realized that the only such probes we possess are gravitational lenses. Indeed, Mao & Schneider (1998) had already pointed out that the anomalous flux ratios of close image pairs, where the fluxes expected for a mass distribution consisting only of the primary lens galaxy would be nearly equal, could be explained by the presence of small, satellite galaxies. More recently, Metcalf & Madau (2001) showed that these effects would be easily detected given the expected amount of substructure in CDM models, and Chiba (2001) showed that CDM substructure could explain the flux ratios in PG1115+080 and B1444+231. In Fig. 1 we show two less well-known examples of gravitational lenses with anomalous flux ratios. The problem, however, is to convert these arguments about plausibility into quantitative estimates of the surface density and properties of satellites.
In Dalal & Kochanek (2001) we developed a formalism for making these estimates and applied it to a sample of 7 four-image lenses. We do not repeat the mathematical development here, providing only a qualitative outline in §2. We present our results and and discuss the future of the method in §3.
2 An Outline Of the Method
The fundamental problem in estimating the properties of any substructure in a gravitational lens is degeneracy between the effects of substructure and the primary lens. For example, equal radial deflection perturbations to the images are degenerate with a change in the mass of the macro model. Thus we must limit our analysis to systems with more constraints than reasonable models of the primary lens have parameters. This rules out two-image lenses, so we will analyze only lenses consisting of four images which have (in general) three degrees of freedom left after fitting a macro model consisting of a singular isothermal ellipsoid (SIE) in an external shear field.
For each of the 7 lenses in our sample we start from the best fit model for the lens and linearly expand the lens equations around each image including both changes in the lens parameters and the local perturbations due to substructure. For any model of the substructure we can then adjust the parameters of the macro model to compensate for its effects and compute a new goodness of fit . This provides us with an estimate of the probability that substructure realization for lens provides a fit to the data . Of course, with so few degrees of freedom left after fitting the macro model, many substructure realizations produce significant improvements in the fit statistic – we have too few constraints to uniquely determine the substructure near each lensed image.


We are interested in the statistical properties of the substructure, not the particular realizations, and we can estimate the statistical properties using a Bayesian analysis of the data. For satellites drawn from a population described by parameters , the probability of substructure realization is . Given a prior for the parameters, the probability of given the data after marginalizing over the actual realizations is
| (1) |
where the normalization is set by the constraint that and we multiply the contributions from each lens and sum (marginalize) over the substructure realizations . Qualitatively, as we vary the parameters, the probability of finding substructure realizations which improve the fit from to varies, thereby allowing us to estimate the parameters.
We modeled the substructure as pseudo-Jaffe models (Munoz et al. 2001) with surface densities, in units of the critical surface density ,
| (2) |
The full model has three parameters: a mass scale , a tidal truncation radius , and the satellite surface mass density . For isothermal models the tidal truncation radius is where we fix for the Einstein radius of the primary lens. The satellite mass is , and the fraction of the mass in substructure is . Near the Einstein ring, where we see the images, most of the mass is dark matter. We model the substructure using random realizations of the satellite distributions. The perturbations are dominated by the variance in the shear and convergence (rather than the astrometry), with
| (3) |
There is a “Coulomb” logarithm where is an effective core radius to the lens.
Figs. 2 and 3 show the results of two Monte Carlo tests of the algorithm. In the first test we take the macro models for our 7 lenses, add measurement errors and analyze the data for substructure. We find only upper bounds on the substructure density with and no preferred mass scale. In the second test we added perturbers with surface density , mass scale , and tidal radius . Multiple trials with samples of 7 lenses recover the surface density and mass scale with reasonable accuracy given the sample size. In a third test, which we do not show, we find that we can determine both and simultaneously.
3 The Surface Density of Satellites
We then fit our sample of 7 lenses either with (Fig. 5) or varying both and (Fig. 5). Qualitatively, the probability curves look very similar to our Monte Carlo simulations. The dominant uncertainty is the degree to which the flux measurements in the real lenses are affected by systematic errors. To explore this, we assumed a standard flux uncertainty of 10%, but show results for both 5% and 20% flux errors. The errors are certainly smaller than 20%, probably smaller than 10% and unlikely to be smaller than 5%. In the models where we estimate both and we find median estimates of and for our standard model with 90% confidence regions of and . If we assume 5% errors, the surface density must be higher, , while if we assume 20% errors it must be lower, . There is a relatively strong degeneracy between the values of and , with higher mass scales allowing lower surface densities. The slope closely matches , which corresponds to keeping the rms shear perturbation constant (see eqn. 3).
These estimates are consistent with the expectations for CDM models, where (Moore et al. 1999, Klypin et al. 1999), and much larger than the expectations for normal satellite populations, (Mao & Schneider 1998, Chiba 2001). For a substructure mass function over the range , our mass scale provides a crude estimate of the upper mass to which is also consistent with the CDM scenario. Thus, our results are most naturally explained as a detection of the satellite galaxies expected in the CDM model.
While one could debate whether we detect “satellites” or “CDM satellites,” alternative explanations do not appear to be viable. There are systematic uncertainties in the data, but the anomalous flux ratios which produce the result are generic and seen in repeated observations spread over long time scales (years) and a range of wavelengths. They can be misinterpreted but not eliminated. Coherent structures in the primary lens galaxy (e.g. spiral arms) are not seen in deep HST images of the lenses, and would need to be far larger fractional mass perturbations to produce the same effects because, unlike satellites, they cannot perturb individual images. Stellar microlensing, while it is the same physical phenomenon, is ruled out as a full explanation. Radio sources are generally too large to suffer from microlensing and the flux ratio anomalies are too long lived. While microlensing has been seen in one radio lens (see Koopmans & de Bruyn 2000), it only affects a superluminal subcomponent, it has a small rms amplitude, and it has a very short fluctuation time scale. Moreover, our estimate of the mass scale is consistent with that of satellites rather than stars.
There is considerable work to be done in the future. First, there is no reason that careful observation and monitoring of the lenses cannot measure the image fluxes to 1% accuracy including the effects of variability and any microlensing. Not only would this allow us to estimate the properties of the CDM substructure more accurately, but it would also supply a large sample of accurate time delay measurements for determining without the problematic systematic errors of the local distance scale (e.g. Schechter 1999). Second, deep high resolution imaging with both HST and the VLBA is needed. Images of the radio source’s host galaxy can constrain the macro model without being affected by substructure because of the larger angular size of the host. Deep VLBA images to map extended structures can be used to measure the substructure mass scale accurately. Extended radio structure also can be used to estimate the surface density over larger areas of the lens than point sources, and can be used to study the internal structure of the satellites. Finally, more lenses will reduce the statistical uncertainties. This includes finding more lenses and more detailed studies of existing lenses to find enough constraints on the macro model to allow a substructure analysis.
Acknowledgments: CSK was supported by the Smithsonian Institution and NASA grants NAG5-8831 and NAG5-9265. ND was supported by the Smithsonian Institution Short Term Visitor Program, DOE grant DOE-FG03-97-ER 40546 and the ARCS Foundation.
References
- (1) Bode, P., Ostriker, J. P. and Turok, N. 2001, ApJ, 556, 93
- (2) Bullock, J. S., Kravtsov, A. V. and Weinberg, D. H. 2000, ApJ, 539, 517.
- (3) Chiba, M., 2001, astro-ph/0109499
- (4) Chiu, W.A., Gnedin, N.Y., & Ostriker, J.P., 2001, astro-ph/0103359
- (5) Colin, P., Avila-Reese, V., & Valenzuela, O., 2000, ApJ, 542, 622
- (6) Dalal, N., & Kochanek, C.S., 2001, ApJ submitted
- (7) Fassnacht, C.D., et al. 1996, ApJL, 460, 103
- (8) Fassnacht, C.D., Blandford, R.D., Cohen, J.G., et al., 1999, AJ, 117, 658
- (9) Klypin, A., Kravtsov, A.V., Valenzuela, O., & Prada, F., 1999, ApJ, 522, 82.
- (10) Kochanek, C.S., 2001, The Dark Universe, M. Livio, ed., also astro-ph/0108160
- (11) Koopmans, L.V.E., & de Bruyn, A.G., 2000, A&A, 358, 793
- (12) Mao, S., & Schneider, P., 1998, MNRAS, 295, 587
- (13) Metcalf, R.B., & Madau, P., 2001, astro-ph/0108224
- (14) Moore, B., et al., 1999, ApJ, 524, L19
- (15) Munoz, J.A., Kochanek, C.S., & Keeton, C.R., 2001, ApJ, 558, 657
- (16) Schechter, P., 1999, IAU 201, A.N. Lasenby & A. Wilkinson, eds., astro-ph/0009048
- (17) Scoccimarro R., Sheth R.K., Hui L., Jain, B., 2001, ApJ, 546, 20
- (18) Spergel, D. N. and Steinhardt, P. J. 2000, PRL, 84, 3760
- (19) Sykes, C.M., Browne, I.W.A., Jackson, N.J., et al., 1998, MNRAS, 301, 310