The Chandra Deep Field North Survey. X. X-ray Emission from Very Red Objects
Abstract
The multi-wavelength properties of Very Red Objects (VROs; ) are largely unknown as many of these sources are optically faint () and undetected at most wavelengths. Here we provide constraints on the X-ray (0.5–8.0 keV) properties of VROs using the 1 Ms Chandra exposure of an region within the Hawaii Flanking-Field area containing the Hubble Deep Field North (HDF-N). We find that VROs detected in the hard band (2.0–8.0 keV) have flat X-ray spectral slopes ( 0.9) and X-ray properties consistent with those expected from luminous obscured AGN. The fraction of such sources in the VRO population is %. Conversely, the average X-ray spectral slope of VROs detected in the soft band (0.5–2.0 keV) but not in the hard band is comparatively steep (), and the X-ray emission from these sources is consistent with that expected from less energetic processes (i.e., star formation, low-luminosity AGN activity, normal elliptical galaxy emission); star-formation and low-luminosity AGN activity scenarios are favored in those sources with irregular optical morphologies. Stacking analyses of the X-ray emission from VROs not individually detected at X-ray energies yield significant detections (99% confidence level) in the soft band and the full band (0.5–8.0 keV). We find this X-ray emission is produced predominantly by the optically brightest VROs. The simplest explanation of this result is that we have detected the average X-ray emission from non-active VROs with low X-ray-to-optical flux ratios [ –2]; this is consistent with that expected if the majority of these VROs are elliptical galaxies. A number of VROs are also detected with mid-infrared (15 m) and radio emission, and we provide constraints on the nature of this emission.
1 Introduction
Understanding the properties and nature of Very Red Objects (hereafter VROs111In many studies these sources are also referred to as Extremely Red Objects (EROs).) remains a challenge to observational cosmology. This is principally because VROs are often optically faint (i.e., ) and undetected at most wavelengths to faint limits. Although the definition of a VRO varies from study to study, it is generally accepted that a source with or is a VRO. These colors are consistent with those of a passively evolving elliptical galaxy at 1 (e.g., see Pozzetti & Mannucci 2000; Daddi et al. 2000). Optical and near-IR spectroscopy and morphology studies have indeed shown that 1 elliptical galaxies appear to comprise at least 40–50% of the VRO population (e.g., Cimatti et al. 1999; Moriondo et al. 2000; Mannucci et al. 2001). However, sub-millimeter and infrared observations have also demonstrated that the VRO population contains dust-enshrouded galaxies at 1 (e.g., Cimatti et al. 1998; Barvainis, Antonucci, & Helou 1999; Dey et al. 1999; Smail et al. 1999; Afonso et al. 2001; Elbaz et al. 2001; Pierre et al. 2001; Smith et al. 2001a). These dusty VROs may dominate the extreme red-end of the VRO population (i.e., ; Smail et al. 1999; Smith et al. 2001b), although the current statistics are limited. Due to the extreme faintness of VROs, the earliest studies of source densities were limited to small areas and susceptible to “cosmic variance” (e.g., see Table 1 in Scodeggio & Silva 2000). Indeed, recent wide-area VRO surveys have shown evidence for source clustering (e.g., Daddi et al. 2000, 2001).
Deep ROSAT observations first showed that VROs are detectable at X-ray energies (e.g., Newsam et al. 1997; Lehmann et al. 2000, 2001). Deeper X-ray surveys performed with the Chandra X-ray Observatory (hereafter Chandra; Weisskopf et al. 2000) have uncovered more examples of X-ray detected VROs (e.g., Alexander et al. 2001, hereafter Paper VI, Barger et al. 2001; Brandt et al. 2001b, hereafter Paper IV; Cowie et al. 2001; Crawford et al. 2001; Hornschemeier et al. 2001, hereafter Paper II; Stanford et al. 2001). In the majority of cases this X-ray emission is consistent with that expected from obscured AGN activity. In Paper II, a 221.7 ks observation of the Chandra Deep Field North (hereafter CDF-N) was used to investigate the X-ray emission from a sample of -band selected VROs. Four of the 33 sources were individually detected at X-ray energies although only in the hard band (2.0–8.0 keV), suggesting obscured AGN activity. Conversely, stacking analyses of the X-ray undetected VROs produced a significant average detection in only the soft band (0.5–2.0 keV). The properties of this X-ray emission were found to be consistent with those expected from normal elliptical galaxies at 1 (i.e., X-ray binary and thermal gas emission), suggesting a dichotomy in the X-ray properties of VROs. However, the definition of a VRO in Paper II was , and none of the individually detected X-ray sources had .
In this study we provide specific constraints on the X-ray properties of VROs using the stricter VRO definition of (equivalent to ) and the much deeper 1 Ms observation of the CDF-N (e.g., Brandt et al. 2001a, hereafter Paper V). We also exploit the deep and extensive multi-wavelength observations within the HDF-N and environs to provide constraints on the multi-wavelength properties of VROs. The Galactic column density along this line of sight is cm-2 (Stark et al. 1992). We adopt the cosmology used in Paper VI (i.e., km s-1 Mpc-1 and ) throughout this paper. All coordinates in this paper are J2000.
2 VRO sample definitions and basic properties
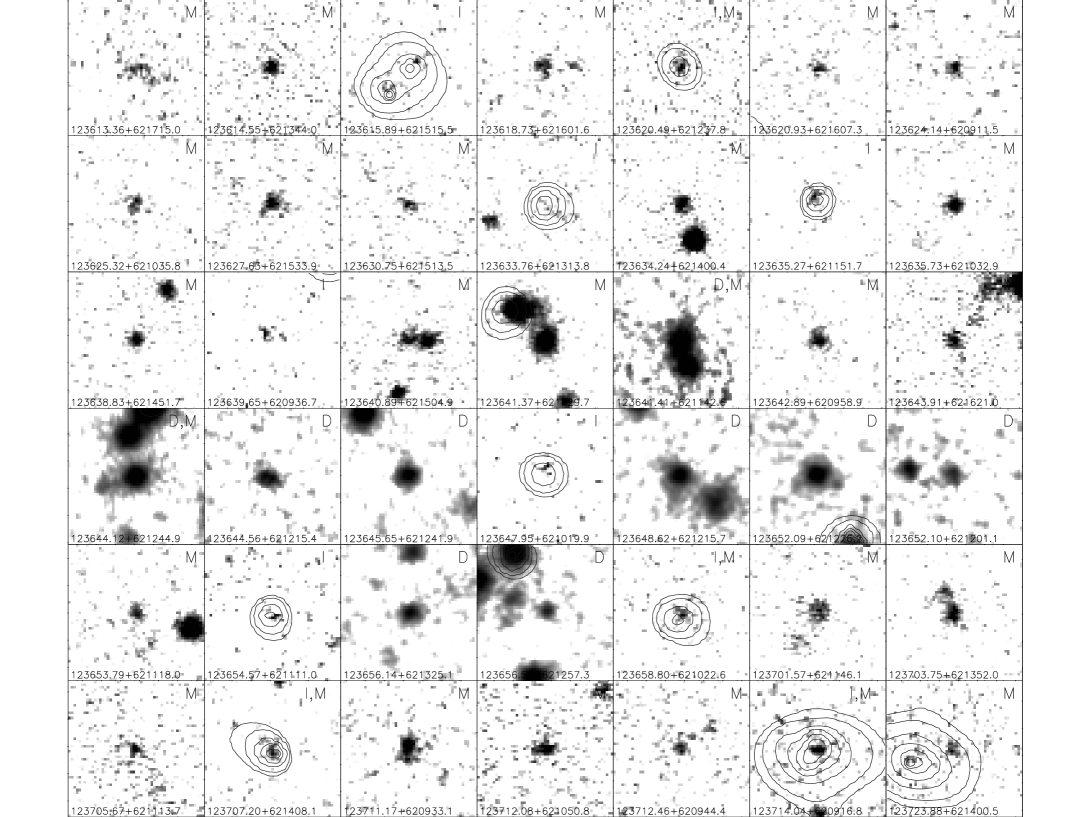
In this study we have defined three VRO samples with different -band (or equivalent) magnitude limits. The first sample includes all VROs with detected in the area used in Paper VI (hereafter referred to as the reduced Hawaii Flanking-Field area) and is referred to as the moderate-depth VRO sample (see §2.1).222As the relationship between the band and band is (Barger et al. 1999), this is equivalent to . The second sample includes all VROs with detected in the 5.3 arcmin2 region of the HDF-N itself and is referred to as the deep VRO sample (see §2.2). These two samples are complete VRO samples and allow us to estimate the fraction of X-ray emitting VROs within the VRO source population. The final VRO sample is an intermediate-depth X-ray detected VRO sample that covers the same area as the moderate-depth VRO sample but only includes X-ray detected VROs with (see §2.3). We have defined this sample to improve the statistics of X-ray detected VROs and provide a more detailed understanding of the X-ray properties of VROs. We are unable to construct a reliable parent VRO sample at the magnitude limit of this sample without introducing a significant number of spurious sources. See Table 1 for the sample definitions. Thumbnail images of the 42 VROs used in this study are shown in Figure 1.
2.1 The moderate-depth VRO sample
As stated above, the area in which the moderate-depth VRO sample is defined is the reduced Hawaii Flanking-Field area used in Paper VI. However, to reduce the number of spurious VROs, we have further excluded sources within 17′′ of the positions of three bright stars where we could not reliably identify VROs. Although optical-to-near-IR catalogs are available for this region (Barger et al. 1999)333These images are publicly available at http://www.ifa.hawaii.edu/cowie/hdflank/hdflank.html., to retain consistency with our previous studies we have used the -band and -band photometric catalogs (with 2 limits of and , respectively) produced in Paper VI. As this region also has -band coverage (Barger et al. 1999), we have produced a -band catalog of sources down to 2 magnitudes of using the sextractor photometry tool (Bertin & Arnouts 1996) and assuming the “Best” magnitude criteria.
To ensure a low fraction of spurious VROs we use the 5 magnitude limit of . We find 29 VROs with (equivalent to ) and within this 70.3 arcmin2 region, corresponding to a source density of 1500 deg-2 (see Tables 1 and 2).444All errors are taken from Tables 1 and 2 of Gehrels (1986) and correspond to the level; these were calculated assuming Poisson statistics. We find this VRO source density to be consistent with that found in other studies (e.g., see Table 1 of Scodeggio & Silva 2000), although the scatter from study to study is large.
2.2 The deep VRO sample
The deep VRO sample covers the region of the HDF-N itself. We have used the seven-band photometric catalog of Fernandez-Soto et al. (1999) to construct the deep VRO sample which has a 5 magnitude limit of . The optical observations used in this catalog were taken with the Hubble Space Telescope (HST; Williams et al. 1996), and the near-IR observations were taken with ground-based telescopes (Dickinson et al. 2000). We find nine VROs with and within this 5.3 arcmin2 region (see Table 3), corresponding to a source density of 6100 deg-2 (see Table 1).555We converted the HST -band photometry to the standard band using (Cowie, Songaila, & Barger 1999). There are few constraints on the source density of VROs at these faint -band magnitudes, and all studies performed to date have covered small areas (e.g., see Table 5 in McCracken et al. 2000). However, our source density is in reasonable agreement with previous studies given the probable large effects of “cosmic variance”.
Five sources within the deep VRO sample have -band magnitudes and colors that fall within the moderate-depth VRO sample definition: two sources are included in both samples, and the other three sources fall just outside the VRO sample definition with the moderate-depth VRO sample photometry. These small differences in source magnitudes are to be expected given the faintness of these VROs. There are no sources within the moderate-depth VRO sample that lie within the HDF-N and are not included in the deep VRO sample; this is probably due to a statistical fluctuation as there does not appear to be any systematic differences in the photometry of these two samples.
2.3 The intermediate-depth X-ray detected VRO sample
The intermediate-depth X-ray detected VRO sample covers the same area as the moderate-depth VRO sample and includes all X-ray detected VROs down to the 2 magnitude limit of . We are unable to define a parent VRO sample at this magnitude limit without introducing a significant number of spurious sources. However, due to the relatively small fraction of VROs with X-ray counterparts, we significantly reduce the probability of spurious sources by selecting those sources with X-ray detections.
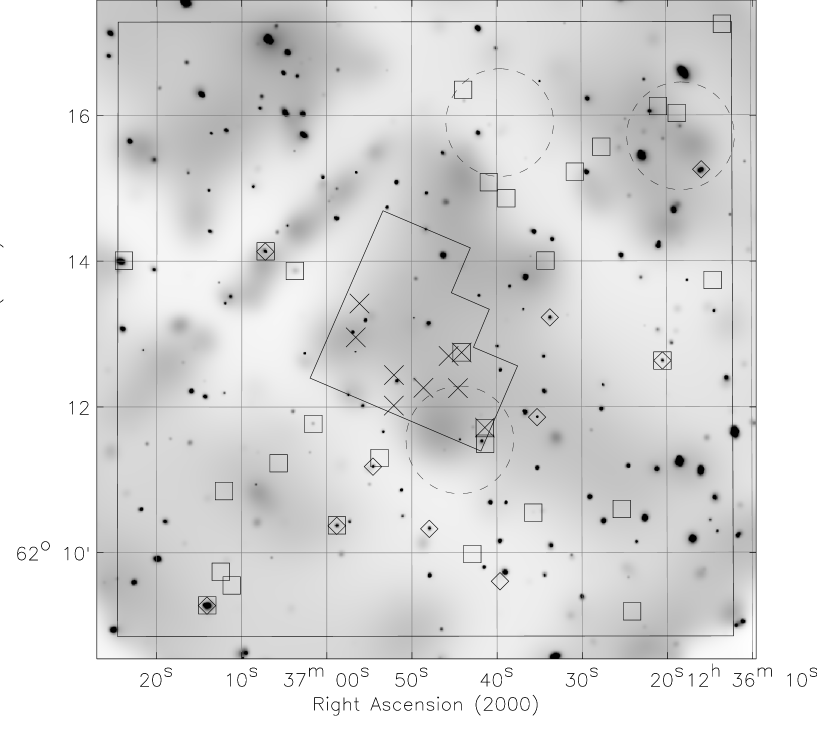
The X-ray data used to produce this sample were taken from the 1 Ms CDF-N catalogs (see Paper V), which contain point sources down to on-axis flux limits of erg cm-2 s-1 and erg cm-2 s-1 in the soft and hard bands, respectively. Within the reduced Hawaii Flanking-Field area that defines this sample there are 141 X-ray sources (see Paper VI). We show the adaptively smoothed full-band (0.5–8.0 keV) Chandra image of this area in Figure 2. These X-ray sources are matched to -band and -band counterparts with a matching radius of 1′′ (in practice all sources had a matching distance ′′) to be consistent with Paper VI; we would conservatively expect 0.2 spurious matches with this criterion. In total there are 10 X-ray detected VROs with and , corresponding to a source density of 500 deg-2 (see Tables 1 and 4 and Figure 2). Six of these sources are exclusively in the intermediate-depth X-ray detected VRO sample (the other four sources are also within the moderate-depth VRO sample) and have magnitudes close to the 2 limit of ; we would expect 0.3 of these sources to be spurious.
Only one source is an extreme VRO (i.e., ), although three sources are undetected in the band and have lower limits on their colors. The fraction of VROs within the X-ray source population at these X-ray depths is % and, with the exception of one source, all are optically faint with (see Paper VI).
2.4 X-ray detected VROs in the moderate-depth and deep VRO samples
Four of the 29 VROs in the moderate-depth VRO sample are detected at X-ray energies, and none of the nine VROs in the deep sample is detected at X-ray energies (see Tables 1–4). All these X-ray sources were detected by wavdetect (Freeman et al. 2002) with a false-positive probability threshold of in at least one X-ray band (Paper V).
However, given the comparitively low source density of VROs, we are able to search for lower significance X-ray sources associated with VROs without introducing a significant number of spurious X-ray sources. We ran wavdetect with a false-positive probability threshold of 10-4 and found two further X-ray sources with positions within 1′′ of sources in the moderate-depth VRO sample as well as one X-ray source with a position within 1′′ of a source in the deep VRO sample (see Tables 1–4 and Figure 2). We would conservatively expect a total of 0.15 spurious X-ray sources at this threshold. The X-ray detected sources in the moderate-depth VRO sample had matching distances of ′′ although the X-ray detected source in the deep VRO sample had a matching distance of 0.9′′. This larger matching distance is not unreasonable given the difficulty of source centroid determination when a low number of counts are measured. We inspected these low-significance sources to verify that they are not caused by “cosmic-ray afterglows” (Chandra X-ray Center 2000, private communication) or background fluctuations.
With these data we have detected X-ray emission from % of the VRO population and % of the VRO population (see Table 1). All but two of these X-ray detected sources are optically faint with . Three of the six extreme VROs (i.e., ) in the moderate-depth VRO sample are detected with X-ray emission. Two of these sources are extremely faint X-ray sources and have irregular optical morphologies, suggesting they may be dust-enshrouded galaxies (see §3.4.1).
2.5 Multi-wavelength counterparts and source redshifts
In addition to the extremely deep X-ray and moderately deep optical-to-near-IR coverage, the reduced Hawaii Flanking-Field area has the deepest feasible optical spectroscopy (e.g., Cohen et al. 2000; Dawson et al. 2001), deep 1.4 and 8.5 GHz radio observations (Richards et al. 1998; Richards 2000), and shallow sub-millimeter observations (Borys et al. 2001).666The reduced Hawaii Flanking-Field area also has additional optical coverage (e.g., Hogg et al. 2000); however, we found the Barger et al. (1999) images to provide superior resolution and depth. A fraction of this region also has deep 15 m and sub-millimeter coverage (Aussel et al. 1999a; Hughes et al. 1998; Barger et al. 2000), and the central HDF-N region has some of the deepest multi-wavelength observations taken to date (see Ferguson, Dickinson, & Williams 2000). We cross-correlated our VROs to the sources in these catalogs using a matching radius of 1′′ with the exception of the ISOCAM catalog of Aussel et al. (1999a) and the SCUBA catalogs of Hughes et al. (1998) and Borys et al. (2001); see Tables 2–4. Given the larger uncertainty of the ISOCAM and SCUBA source positions, we used matching radii of 3′′ and 10′′ respectively; with these matching distances there is a non-negligible probability of mis-associations, and we would expect 0.5 spurious ISOCAM matches and 0.6 spurious SCUBA matches. As all the matches to ISOCAM sources were those included in the ISOCAM supplementary catalog and, with the exception of CXOHDFN J123647.9+621019, all had weak emission ( Jy), there is also an additional possibility that some of the ISOCAM sources are spurious (see Aussel et al. 1999b). With the exception of the tentative (2.2) sub-millimeter counterpart of CXOHDFN J123701.6+621145 (see §3.4.1), we found no matches to SCUBA sources.
All of the sources in the deep VRO sample have photometric redshifts in the Fernandez-Soto et al. (1999) catalog of 1.0–1.8 (see Table 3); this redshift range is consistent with that found in other VRO studies to date (e.g., Cimatti et al. 1999; Martini 2001). The comparitively blue near-IR colors of these sources () are consistent with those expected for elliptical galaxies at 1–2 (Pozzetti & Mannucci 2000), and the best fitting spectral energy distribution (SED) template for the majority of these sources is that of an elliptical galaxy.
We are unable to provide reliable photometric redshifts for the sources in the moderate-depth VRO sample and the intermediate-depth X-ray detected VRO sample due to a limited number of optical-to-near-IR bands.
3 Constraints on the nature of VROs
In this section we provide constraints on the nature of VROs from an analysis of their multi-wavelength properties, focusing on the X-ray emission characteristics of VROs. As most of our X-ray detected VROs do not have redshifts we have also defined an X-ray detected VRO literature sample which includes all X-ray detected VROs from the literature with spectroscopic or photometric redshifts (Fabian et al. 2000; Barger et al. 2001; Cowie et al. 2001; Crawford et al. 2001; Lehmann et al. 2001); this sample is clearly not complete and is only included to provide a comparison to the properties of our VROs.
3.1 Optical-to-near-IR constraints
Deep X-ray surveys have shown a correlation between the optical faintness and optical-to-near-IR color of X-ray sources (e.g., Hasinger et al. 1999; Giacconi et al. 2001; Lehmann et al. 2001). In Paper VI we showed that this correlation exists for the X-ray sources in the reduced Hawaii Flanking-Field area with 99.99% confidence. In Figure 3a we plot the mean colors for X-ray sources with showing this correlation. Clearly the majority of the X-ray detected VROs continue this trend, suggesting they are the extension of the X-ray source population to very red optical-to-near-IR colors. The only X-ray detected VROs that do not follow this trend are the two VROs which may be dust-enshrouded galaxies and different to the majority of the X-ray source population (see §3.4.1). In Figure 3b we show the mean redshifts for X-ray sources with and compare them to those expected for E, Sa and Sc galaxies; we determined using the magnitudes given in Folkes et al. (1999) and the colors given in Mannucci et al. (2001). The redshifts of our X-ray undetected VROs are 1–2 (see Table 3), consistent with the few known spectroscopic and photometric redshifts of VROs to date (e.g., Cimatti et al. 1999; Martini 2001; Willott, Rawlings &
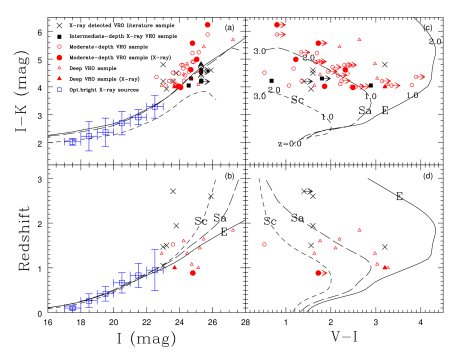
Blundell 2001); on average these sources appear to reside in approximately galaxies. The redshifts of the VROs in the X-ray detected VRO literature sample cover 1–3, similar to that found for X-ray undetected VROs.
We can also use the -band observations to place further constraints on the properties of X-ray detected VROs. In Figure 3c we show the versus colors of all the VROs and compare them to those expected for different galaxy types.777We converted the HST -band photometry to the standard band using (Cowie et al. 1999). All of the VROs in the deep VRO sample have -band detections, and almost all lie within the region between the Sa and E galaxy tracks.888We have applied -corrections to these galaxy tracks using the -correction factors given in Poggianti (1997). However, we have not applied evolutionary corrections; hence these tracks should be considered extreme in the sense that a typical elliptical should have bluer colors than those shown here. Since our analysis is not sensitive to the accuracy of these tracks, our overall conclusions will not change even if the true evolutionary corrections are found to be large. The only X-ray detected source in the deep VRO sample appears to be an elliptical galaxy in the HST images and lies between the predicted tracks for 1 Sa and E galaxies (see §3.2.2 and Figures 3c and 3d). Due to the shallower -band coverage of the moderate-depth VRO sample, only 15 of the 29 sources are detected, restricting the constraints we can place on the host galaxy types of these VROs. With the exception of the two VROs, which are very faint in the optical band and may be dust-enshrouded galaxies (see §3.4.1), all of the X-ray detected VROs are also detected in the -band; however, the average colors of these sources are consistent with those found for the X-ray undetected VROs with -band detections. Unfortunately the depth and resolution of these images are not sufficient to determine accurately the host-galaxy types of these sources.
3.2 X-ray constraints for X-ray detected VROs
Key distinctions between AGN and “normal” galaxies can be made at X-ray energies. AGN are generally distinguishable by having moderate-to-high X-ray luminosities, high X-ray-to-optical flux ratios, and, in the case of obscured AGN, flat X-ray spectral slopes.999The flat X-ray spectral slopes of obscured AGN are due to absorption and are not intrinsic. In Figure 4a we show the hard-band flux versus the X-ray band ratio, defined as the ratio of hard-band to soft-band counts, for all the X-ray detected VROs. The range of spectral slopes for the nine VROs detected in the hard band is , and the origin of the X-ray emission from these sources is almost certainly obscured AGN activity (see §3.2.1). There are, however, four VROs undetected in the hard band; we argue below that at least some of these sources are not obscured AGN (see §3.2.2).
3.2.1 Hard-band detected VROs
The constraints on the X-ray spectral slope for the nine hard-band detected VROs are poor in most cases. However, we can derive an average X-ray spectral slope by stacking the individual sources using the stacking technique presented in §3.3 of Paper VI. We find a mean band ratio of , corresponding to a mean spectral slope of 0.9. This is very similar to that found for the optically faint X-ray source population (Paper VI), suggesting that these X-ray detected VROs are simply the extension of the optically faint X-ray source population to very red optical-to-near-IR colors. Such a flat X-ray spectral slope is strongly indicative of obscured AGN activity and, assuming the observed X-ray spectral slope is due to obscuration of power-law emission, corresponds to an intrinsic absorption column density at 1–3 (the probable redshift range of these sources; see §3.1) of (5–35) cm-2. Three of the VROs are undetected in the soft band and have inverted spectra (); these characteristics can be indicative of Compton-thick absorption. We can derive an average spectral slope for these sources by stacking the individual sources in the same manner as performed above; this gives a mean band ratio of , corresponding to a mean spectral slope of –0.4 and an average intrinsic column-density at 1–3 of (0.2–1.2) cm-2. The upper-limit absorption estimate is just below that expected for Compton-thick absorption ( cm-2). However, we note that this column density range should be considered a lower limit since additional components other than the intrinsic AGN emission (e.g., scattered AGN emission and star-formation) can raise the soft-band flux.
![[Uncaptioned image]](/html/astro-ph/0111397/assets/x4.png)
Hard-band flux versus (a) X-ray band ratio, defined as the ratio of hard-band to soft-band count rate, and (b) -band magnitude. The symbols have the same meaning as in Figure 3. The open circles and open triangles indicate the stacking-analysis results for the X-ray undetected sources from the moderate-depth VRO sample and deep VRO sample, respectively. We converted the reported X-ray fluxes and count-rates in the X-ray detected VRO literature sample to the energy bands used here using the AO2 version of pimms (Mukai 2000). The equivalent photon indices () are shown on the left-hand side of the top panel, and the equivalent column densities () for a = 2.0 power-law source at are shown on the right-hand side of the top panel. These values were determined using pimms (Mukai 2000) and xspec version 11.0.1 (Arnaud 1996). A possible obscured QSO (CXOHDFN J123615.8+621515) is indicated (see §3.2.1).
Another key signature of AGN activity is luminous X-ray emission. In determining source luminosities we have corrected for apparent intrinsic absorption in each VRO by assuming that the observed X-ray spectral slope is due to obscuration of power-law emission; the equivalent 0 absorbing column densities for a given band ratio are given in Figure 4a. For those sources that do not have a measured redshift we have assumed and . The estimated rest-frame unabsorbed 0.5–8.0 keV luminosities of all the X-ray detected VROs are given in Table 4. The range in X-ray luminosity for the hard-band detected VROs is 3 erg s-1 to 5 erg s-1, and two sources (CXOHDFN J123615.8+621515 and CXOHDFN J123714.0+620916) would be obscured QSOs (i.e., erg s-1) at 3; see also Paper VI. As star-formation activity is rarely more luminous than erg s-1 in the X-ray band (e.g., Moran, Lehnert, & Helfand 1999 and references therein), it is probable that all the hard-band detected VROs are obscured AGN; these results are consistent with those found in Paper II. If we assume that we have detected all luminous AGN sources in the moderate-depth VRO sample then the fraction of such sources within the VRO population is %.
Further evidence that these sources host AGN activity is found from their X-ray-to-optical flux ratios (see Figure 4b). With the exception of one source, all of the VROs detected in the hard band lie within the boundaries expected for typical AGN (i.e., ; Akiyama et al. 2000; Paper VI). The only source found to lie outside these boundaries is CXOHDFN J123615.8+621515. This source is optically blank () and has , an inverted X-ray spectral slope ( –0.3) and a rest-frame unabsorbed 0.5–8.0 keV luminosity of 4 erg s-1. This source may be an obscured QSO; see §6.2 in Paper VI for further discussion of this source.
3.2.2 Hard-band undetected VROs
The four X-ray detected VROs that are undetected in the hard band are also faint in the soft band, limiting the X-ray spectral constraints we can provide. We can, however, derive an average X-ray spectral slope by stacking the individual sources using the technique given in §3.2.1. This still does not provide an average detection in the hard band, although it places a constraint on the average band ratio of , corresponding to . This X-ray spectral slope is considerably steeper than that found for the hard-band detected VROs, suggesting the X-ray emission mechanisms of these sources are different. Since we have redshift determinations for two of these VROs (CXOHDFN J123651.9+621225 and CXOHDFN J123701.6+621145) we can provide better constraints on their X-ray emission mechanism.
CXOHDFN J123651.9+621225 (optical identification 123652.0+621226) lies within the HDF-N itself and has a photometric redshift in the Fernández-Soto et al. (1999) catalog of ; three independent photometric redshift studies also place this galaxy at 1.0–1.2 (see Hughes et al. 1998). We made our own determination using the publicly available photometric redshift code hyperz Version 1.1 (Bolzonella, Miralles, & Pelló 2000).101010The hyperz code is available at http://webast.ast.obs-mip.fr/hyperz/. In performing the photometric redshift fitting, we used only the Bruzual & Charlot (1993) spectral templates and allowed up to 1.6 mags of visual extinction. The best-fitting model was found to be a elliptical galaxy with an age of 6.5 Gyr and 0.3 mags of visual extinction; the uncertainty in the redshift determination corresponds to the 90% confidence level. Indeed, based on optical morphology, this source is clearly an elliptical galaxy and has versus colors consistent with that of an elliptical at 1 (see Figures 3c and 3d). Assuming , the rest-frame 0.5–2.0 keV luminosity is 9 erg s-1, and the rest-frame 0.5–8.0 keV luminosity is erg s-1. Furthermore, with a -corrected -band magnitude of , the X-ray emission from this source is consistent with that found for local elliptical galaxies (e.g., O’Sullivan, Forbes, & Ponman 2001; S. Pellegrini 2001, private communication).
CXOHDFN J123701.6+621145 (optical identification 123701.5+621146) is an optically faint Jy radio source (Richards et al. 1999) and has a spectroscopic redshift of , based on a single emission line assumed to be [OII] 3727 (Cohen et al. 2000).111111The SED of CXOHDFN J123701.6+621145 provides corroborating evidence for this redshift (see §3.4.1). Adopting , the rest-frame 0.5–2.0 keV luminosity is 1 erg s-1, and the rest-frame 0.5–8.0 keV luminosity is 4 erg s-1. As the irregular morphology of this source (van den Bergh et al. 2000) clearly indicates that it is not an elliptical galaxy, the X-ray emission is probably produced by either luminous star-formation or low-luminosity AGN activity; we provide further constraints in §3.4.1.
We do not have detailed constraints for the other two hard-band undetected VROs, CXOHDFN J123639.6+620936 and CXOHDFN J123642.8+620958. However, their irregular -band morphologies and extremely faint optical magnitudes () suggest they may be similar to CXOHDFN J123701.6+621145 and not normal elliptical galaxies. The extreme optical-to-near-IR color of CXOHDFN J123642.8+620958 () and the lower limit optical-to-near-IR color of CXOHDFN J123639.6+620936 () provide further support for this interpretation.
If we assume the hard-band undetected sources in the moderate-depth VRO sample with irregular morphologies are luminous star-forming galaxies, the fraction of such sources within the VRO population is %. Clearly, this fraction should be used with caution since we have not proved that these sources are luminous star-forming galaxies, and a large number of such sources may lie below the detection limit of our X-ray observations.
3.3 X-ray constraints for X-ray undetected VROs
The majority of our VROs do not have detectable X-ray emission. We can, however, search for evidence of X-ray emission from these sources on average by stacking the individually undetected sources in the same manner as performed in previous studies (e.g., Paper II; Paper IV; Paper VI). We conservatively excluded from the stacking analyses five of the 23 X-ray undetected VROs in the moderate-depth VRO sample and one of the eight X-ray undetected VROs in the deep VRO sample that lay within 10′′ of a high-significance X-ray source (i.e., detected with a wavdetect false-positive probability threshold of ) or within 3′′ of a low-significance X-ray source (i.e., detected with a wavdetect threshold of but undetected with a wavdetect threshold of ); these could be affected by the low-level wings of the Chandra point-spread function (see Tables 2 and 3). In all the stacking analyses we used the 30-pixel aperture and restricted ACIS grade set defined in Paper IV. To determine the significance of the stacked X-ray emission we performed Monte-Carlo stacking simulations using the technique given in Appendix A of Paper IV. The Monte-Carlo simulations consisted of 10,000 trials where we stacked 18 random positions (seven random positions in the case of the deep VRO sample) within each VRO sample area using the same photometric aperture as for the stacking analyses. We verified the significances determined from these simulations using Poisson statistics; all significant detections (i.e., % confidence level) were found to be so with both methods. The results of the stacking analyses are given in Table 5; we have assumed when determining all fluxes and luminosities.
3.3.1 Results from the moderate-depth VRO sample
The effective Chandra exposure time achieved from the stacking analyses of the moderate-depth VRO sample is 15.8 Ms. We find significant detections (99% confidence level) in the soft and full bands corresponding to average fluxes of erg cm-2 s-1 and erg cm-2 s-1, respectively.
We may expect the optically brightest sources to contribute more to the stacked X-ray emission as for a given X-ray-to-optical flux ratio these sources would have brighter X-ray fluxes. To investigate this possibility we performed separate stacking analyses for the and VROs; the threshold was chosen to give equal numbers of VROs in both sub-samples. The effective Chandra exposure times from these stacking analyses are similar (8.1 Ms for the sub-sample and 7.7 Ms for the sub-sample) and allow for a relatively unbiased comparison. We find significant detections in the soft and full bands and a tentative (96.4% confidence level) detection in the hard band for the VROs; there are no significant detections for the VROs in any X-ray band (see Table 5). This clearly shows that the VROs are contributing the majority of the stacked X-ray emission, and deeper Chandra observations should preferentially detect the optically brightest VROs. Given the average soft-band flux ( erg cm-2 s-1) and mean -band magnitude () of the VROs, the mean X-ray-to-optical flux ratio of is consistent with that expected from normal elliptical galaxies. Furthermore, given the mean -band magnitude for the sources () and assuming the same X-ray-to-optical flux ratio, the expected soft-band flux of erg cm-2 s-1 is consistent with our non-detection of the VROs.
The fainter -band magnitudes of the VROs could be due to these sources lying at higher redshifts than the VROs. Although we do not have redshifts for the majority of these VROs, assuming they are elliptical galaxies the average redshifts of the and sources are and , respectively. At , the average rest-frame 0.5–2.0 keV and 0.5–8.0 keV luminosities of the VROs are erg s-1 and erg s-1, respectively. This X-ray emission is at the level expected from normal elliptical galaxies, although it could also be produced by star formation and low-luminosity AGN activity. At , the average rest-frame 0.5–2.0 keV and 0.5–8.0 keV luminosity upper limits of the VROs are erg s-1 and erg s-1, respectively. Both of these X-ray luminosity upper limits are higher than those determined for the VROs and therefore the non-detection of X-ray emission from the VROs is consistent with these sources lying at higher redshifts. Deep imaging in multiple optical-to-near-IR bands is required to determine source morphologies and photometric redshifts to test these hypotheses (see §4.2).
3.3.2 Results from the deep VRO sample
The effective Chandra exposure time achieved from the stacking analyses of the deep VRO sample is 6.5 Ms. We find a significant detection (99% confidence level) in the soft band corresponding to an average flux of erg cm-2 s-1. At the mean photometric redshift of these sources (; see Table 3), the rest-frame 0.5–2.0 keV luminosity is erg s-1, the same as that found for the one X-ray detected VRO in the deep VRO sample (CXOHDFN J123651.9+621225 at ; see §3.2.2). As CXOHDFN J123651.9+621225 is the lowest redshift source in the deep VRO sample, this suggests that the individual non-detections of the other VROs are mostly due to these sources lying at higher redshifts. This result is entirely consistent with that suggested in §3.3.1 based on the stacking analyses of X-ray undetected sources in the moderate-depth VRO sample, suggesting that deeper Chandra observations should detect more examples of X-ray emitting normal elliptical galaxies in the VRO population.
As only 7 VROs were used in these stacking analyses we are unable to investigate distinctions in average X-ray properties with optical brightness or redshift.
3.4 Multi-wavelength constraints
3.4.1 Broad-band SED of CXOHDFN J123701.6+621145
Most of our VROs are only detected at optical-to-near-IR wavelengths; however, CXOHDFN J123701.6+621145 is remarkable in that it is detected at most of the wavelengths investigated here. This source is an extreme VRO (i.e., ), has an irregular morphology (van den Bergh et al. 2000), and has a spectroscopic redshift of (Cohen et al. 2000); see also §3.2.2. The extreme VRO colors and irregular morphology suggest this source may be a member of the dust-enshrouded VRO population.
In Figure 5 we compare the SED of CXOHDFN J123701.6+621145 to that of the archetypal nearby dusty starburst galaxy Arp 220. The fluxes of Arp 220 have been adjusted to to show the relative luminosities of both sources from radio to X-ray wavelengths; however, to produce the fit shown, we had to reduce the luminosity of the Arp 220 model by a factor of 2.2. Clearly CXOHDFN J123701.6+621145 has a similar SED to Arp 220. The bolometric luminosity of CXOHDFN J123701.6+621145 is lower than that of Arp 220, although the X-ray luminosity is times higher (see §3.2.2). The X-ray emission from Arp 220 is consistent with that produced by both a star-formation component and a hard X-ray power-law component (Iwasawa et al. 2001); this latter component could be due to AGN emission or a population of X-ray binaries. We do not have sufficient X-ray information to determine the origin of the X-ray emission from CXOHDFN J123701.6+621145; although we note that it is less luminous than that found for NGC 3256 (Moran et al. 1999; Lira et al. 2001), the most X-ray luminous local starburst.
![[Uncaptioned image]](/html/astro-ph/0111397/assets/x5.png)
A comparison between the multi-wavelength properties of CXOHDFN J123701.6+621145 and the SED of the dusty starburst galaxy Arp 220. The filled circles show the data for CXOHDFN J123701.6+621145. The X-ray and optical-to-near-IR data are taken from this paper while the radio, sub-millimeter and infrared data are taken from Richards (2000), Barger, Cowie, & Richards (2000), and Aussel et al. (1999a), respectively. Observational data are not shown for Arp 220; instead the best-fit model from Silva et al. (1998) is shown for the radio-to-optical wavelengths (dot-dashed curve), and the best-fit model from Iwasawa et al. (2001) is shown for X-ray energies (dashed curve). These models have been corrected to that expected from Arp 220 at , although to achieve the fit shown we decreased the luminosity of Arp 220 by a factor of 2.2. The model of a 5 Gyr old passively evolving giant elliptical galaxy taken from Silva et al. (1998) is plotted (dotted curve) to demonstrate the expected 15 m emission from starlight.
The similarity of the colors and X-ray properties of CXOHDFN J123639.6+620936 and CXOHDFN J123642.8+620958 (see §3.2.2) with those of CXOHDFN J123701.6+621145 suggests they may also be dust-enshrouded galaxies.
3.4.2 Radio detections of VROs
Five VROs have radio counterparts, four of which are also detected at X-ray energies. This high matching fraction between radio and X-ray sources is consistent with that found in other studies (i.e., Paper II; Paper IV; Bauer et al. 2001a) suggesting an association between the production of X-ray and radio emission. Only three of the five VROs with radio counterparts have well-defined radio spectral slopes; two sources (123641.4+621143 and CXOHDFN J123707.2+621408) have flat radio spectra (i.e., ) while a third source (CXOHDFN J123701.6+621145) has a steep radio spectrum () and is described in §3.4.1. The origin of the radio emission in the sources with flat radio spectra can be either AGN or recent starburst activity (e.g., Condon 1992; Richards 2000). The flat X-ray spectrum of CXOHDFN J123707.2+621408 favors the former case for this object. The source 123641.4+621143 is undetected in all the X-ray bands; given a full-band upper limit of erg cm-2 s-1, its rest-frame 0.5–8.0 keV luminosity can be as high as erg s-1 at (Dawson et al. 2001). As this source has a disk-like morphology, it is most likely a star-forming galaxy or a low-luminosity AGN.
3.4.3 ISOCAM detections of VROs
Four of the 14 VROs in the ISOCAM region of Aussel et al. (1999a) have 15 m counterparts, two of which are also detected at X-ray energies (see Tables 2 and 4). This infrared radiation can be due to either dust or starlight emission. In Figure 5, we show the SEDs of both a dusty starburst (Arp 220) and a starlight-dominated galaxy (a giant elliptical galaxy) normalized to the -band emission of CXOHDFN J123701.6+621145. The predicted 15 m emission from starlight is an order of magnitude below that expected from the dusty starburst, and clearly the origin of the infrared radiation in CXOHDFN J123701.6+621145 is dust emission. As CXOHDFN J123701.6+621145 is the brightest ISOCAM-detected VRO in the -band, this suggests that starlight emission at 15 m for VROs at 1 is Jy. This is 1–2 orders of magnitude fainter than the 15 m flux limit, and the origin of the infrared emission in all the ISOCAM-detected VROs is likely to be dust emission.
3.5 VRO clustering
Wide-area VRO studies have shown that VROs are strongly clustered (e.g., Daddi et al. 2000, 2001; McCarthy et al. 2001). The solid angles covered by our VRO samples are too small to perform a detailed analysis of source clustering; the results of a two-point correlation analysis on the moderate-depth VRO sample with the estimator of Landy & Szalay (1993) did not show significant evidence for source clustering.
We also took an alternative approach and searched for VRO overdensities in the vicinities of three known moderate-redshift (i.e., 1) clusters and cluster candidates (see Figure 2). Three VROs lie within the 45′′ radius region of the cluster-candidate X-ray source CXOHDFN J123620.0+621554 (Bauer et al. 2001b, hereafter Paper IX) when we would expect 0.9 VROs in the case of a uniform distribution. This unusual X-ray source also contains an overdensity of optically faint X-ray sources and optically faint Jy radio sources, and it is likely to be a poor cluster at ; see Paper IX for further discussion. We found one VRO within 45′′ of the center of the cluster ClG 1236+6215 discovered by Dawson et al. (2001) and two VROs (excluding the VROs in the deep VRO sample) within 45′′ of the center of the cluster/group associated with the FR I radio galaxy VLA J123644.3+621133 (e.g., Richards et al. 1998; Paper IX). The evidence for VRO clustering within the vicinities of all these sources is not significant although we are limited by statistics. If we combine these results we find six VROs when we would expect 2.7 in the case of a uniform distribution; the evidence for VRO clustering is significant at the 94% confidence level.
4 Summary and Further work
4.1 Summary of main results
We have used the 1 Ms CDF-N observation of an region within the Hawaii Flanking-Field area to provide constraints on the X-ray emission from Very Red Objects (VROs; ). We defined three VRO samples: a moderate-depth VRO sample () and an intermediate-depth X-ray detected VRO sample () both covering the 70.3 arcmin2 reduced Hawaii Flanking-Field area, and a deep VRO sample () covering the 5.3 arcmin2 region of the HDF-N itself. Our main results are the following:
(i) We detected X-ray emission from 13 VROs down to 0.5–2.0 keV and 2.0–8.0 keV point-source fluxes of erg cm-2 s-1 and erg cm-2 s-1, respectively. Six (%) of the 29 VROs within the moderate-depth VRO sample and one (%) of the nine VROs within the deep VRO sample were detected with X-ray emission. See §2.3 and §2.4.
(ii) The color versus -band magnitude of all the X-ray detected VROs follows the trend found for optically brighter () X-ray sources, suggesting the VROs are the very red analogs of the optically bright X-ray source population. The two X-ray detected VROs have redder colors than those expected given their -band magnitudes and may be dust-enshrouded VROs. See §3.1 and §3.4.1.
(iii) The hard-band detected VROs have flat X-ray spectral slopes () and X-ray properties consistent with those expected from obscured AGN; three of these VROs are undetected in the soft band, and the absorption to the X-ray nucleus in some of these sources may be Compton-thick. Assuming all the hard-band detected VROs lie at 1–3, they have rest-frame 0.5–8.0 keV unabsorbed luminosities of to erg s-1; the two brightest sources would be obscured QSOs (i.e., erg s-1) if they lie at 3. Assuming these hard-band detected VROs comprise all the luminous AGNs within the moderate-depth VRO sample, the fraction of such sources in the VRO population is %. Unfortunately, the depth and resolution of the optical-to-near-IR images are not sufficient to determine the host-galaxy types of these sources. See §3.2.1.
(iv) The hard-band undetected VROs have steeper X-ray spectral slopes and are more likely to contain less energetic X-ray emission processes such as star formation, low-luminosity AGN, and normal elliptical galaxy emission (i.e., X-ray binary activity and thermal gas emission). One of these sources appears to be a normal elliptical galaxy at 1, while another source is a VRO that has a SED very similar to that of the archetypal dusty starburst galaxy Arp 220. The X-ray emission from this source is likely to be due to either luminous star-formation or low-luminosity AGN activity. The irregular morphologies and optical-to-near-IR colors of the other hard-band undetected VROs are similar to those of the extreme VRO, and the X-ray emission from these sources is also likely to be produced by the same processes. Assuming the hard-band undetected sources with irregular morphologies in the moderate-depth VRO sample are luminous star-forming galaxies, the fraction of such sources within the VRO population is % or larger. See §3.2.2 and §3.4.1.
(v) Stacking analyses of VROs not individually detected with X-ray emission produced significant detections (% confidence level) in the 0.5–2.0 keV band for both the moderate-depth and deep VRO samples, and a significant detection in the 0.5–8.0 keV band for the moderate-depth VRO sample. These average X-ray detections are consistent with the emission expected from normal elliptical galaxies, star formation or low-luminosity AGN activity at 1. We found that the optically brightest VROs contribute the majority of this X-ray emission. The simplest explanation of these results is that we have detected the X-ray emission from non-active VROs with low X-ray-to-optical flux ratios [ –2]. This is consistent with expectations if the majority of these VROs are elliptical galaxies. See §3.3.
(vi) Five VROs have radio counterparts, and four of these are detected with X-ray emission. This high matching rate between radio and X-ray sources is consistent with that found from other deep X-ray and radio studies. See §3.4.2.
(vii) Four of the 14 VROs within the ISOCAM HDF-N region have 15 m counterparts, and two of these are detected with X-ray emission. The origin of the infrared radiation from all these ISOCAM sources is likely to be dust emission. See §3.4.3.
4.2 Further work
Given our results we can provide suggestions for further work to extend the understanding of X-ray emission from VROs. Arguably the most important issue to address is identifying the differences between X-ray detected and X-ray undetected VROs. There are three main approaches that may provide useful constraints in this regard: (i) galactic host types and environments, (ii) redshift distributions, and (iii) large-scale clustering properties.
The determination of galactic host types and environments will be most effectively pursued with high-resolution deep (i.e., 27) optical/near-IR imaging; the excellent angular resolution of HST is preferable in this regard. As the photometric redshift technique will probably be the only viable method of determining the redshifts for most VROs, deep imaging in multiple optical-to-near-IR bands will be necessary to determine redshift distributions. However, given that many of the X-ray detected VROs are probably AGN, deep optical spectroscopy may successfully detect high equivalent-width emission lines in some sources. It is becoming clear that VROs are strongly clustered although the clustering properties of X-ray detected VROs are almost completely unknown. The advantage of an investigation into the clustering properties of X-ray detected VROs is that it can be undertaken with comparatively moderate depth optical-to-near-IR imaging (i.e., 25). However, to place useful constraints and construct statistically significant samples, imaging observations over a large area (i.e., a few hundred arcmin2) would be required.
The 1 Ms Chandra observation used in the present study has shown that VROs without obvious AGN activity are probably only detected at faint X-ray fluxes (i.e., 0.5–2.0 keV fluxes erg cm-2 s-1) and are therefore only detectable in extremely deep X-ray surveys. Our ultimate aim with the CDF-N survey is to reach a Chandra exposure time of Ms. Such an observation should reach 0.5–2.0 keV fluxes of erg cm-2 s-1 and will be deep enough to detect a large number of VROs without obvious AGN activity.
Acknowledgments
This work would not have been possible without the support of the entire Chandra and ACIS teams; we particularly thank P. Broos and L. Townsley for data analysis software and CTI correction support. We thank L. Pozzetti for interesting discussions, L. Silva and G.L. Granato for providing model SEDs, and S. Dawson, M. Dickinson, S. Pellegrini, and P. Severgnini for providing useful information. We are grateful to A. Barger and L. Cowie for making their optical and near-IR images publicly available and to M. Bolzonella, J.-M. Miralles and R. Pelló for making hyperz available. We thank the referee for concise comments. We acknowledge the financial support of NASA grant NAS 8-38252 (GPG, PI), NSF CAREER award AST-9983783 (DMA, CV, FEB, WNB), NASA GSRP grant NGT5-50247 and the Pennsylvania Space Grant Consortium (AEH), and NSF grant AST-9900703 (DPS). C.V. also acknowledges partial support from the Italian Space Agency, under the contract ASI 00/IR/103/AS, and the Ministry for University and Research (MURST) under grant Cofin-00-02-36.
References
- (1)
- (2) Afonso, J., Mobasher, B., Chan, B., & Cram, L. 2001, ApJ, 559, L101
- (3)
- (4) Alexander, D.M., Brandt, W.N., Hornschemeier, A.E., Garmire, G.P., Schneider, D.P., Bauer, F.E., & Griffiths, R.E. 2001, AJ, 122, 2156 (Paper VI)
- (5)
- (6) Arnaud, K.A. 1996, in ASP Conf. Ser. 101, Astronomical Data Analysis Software and Systems V. eds. Jacoby G. & Barnes J. (San Francisco: ASP), 17
- (7)
- (8) Aussel, H., Cesarsky, C.J., Elbaz, D., & Starck, J.L. 1999a, A&A, 342, 313
- (9)
- (10) Aussel, H., Elbaz, D., Cesarsky, C. J., & Starck, J. L. 1999b, ESA SP-427: The Universe as Seen by ISO, 427, 1023
- (11)
- (12) Barger, A.J., Cowie, L.L., Trentham, N., Fulton, E., Hu, E.M., Songaila, A., & Hall, D. 1999, AJ, 117, 2656
- (13)
- (14) Barger, A.J., Cowie, L.L., & Richards, E.A. 2000, AJ, 119, 2092
- (15)
- (16) Barger, A.J., Cowie, L.L, Mushotzky, R.F., & Richards, E.A. 2001, AJ, 121, 662
- (17)
- (18) Barvainis, R., Antonucci, R., & Helou, G. 1999, AJ, 118, 645
- (19)
- (20) Bauer, F.E., et al. 2001a, AJ, in preparation
- (21)
- (22) Bauer, F.E., et al. 2001b, AJ, submitted (Paper IX)
- (23)
- (24) Bertin, E., & Arnouts, S. 1996, A&AS, 117, 393
- (25)
- (26) Bolzonella, M., Miralles, J.-M., & Pelló, R. 2000, A&A, 363, 476
- (27)
- (28) Borys, C., Chapman, S., Halpern, M., & Scott, D. 2001, MNRAS, submitted (astro-ph/0107515)
- (29)
- (30) Brandt, W.N., et al. 2001a, AJ, in press (astro-ph/0108404)(Paper V)
- (31)
- (32) Brandt, W.N., et al. 2001b, AJ, 122, 1 (Paper IV)
- (33)
- (34) Brandt, W.N., Hornschemeier, A.E., Schneider, D.P., Alexander, D.M., Bauer, F.E., Garmire, G.P., & Vignali, C. 2001c, ApJ, 558, L5 (Paper VII)
- (35)
- (36) Bruzual A., G. & Charlot, S. 1993, ApJ, 405, 538
- (37)
- (38) Cimatti, A., Andreani, P., Rttgering, H., & Tilanus, R. 1998, Nature, 392, 895
- (39)
- (40) Cimatti, A., et al. 1999, A&A, 352, L45
- (41)
- (42) Cohen, J.G., Hogg, D.W., Blandford, R., Cowie, L.L., Hu, E., Songaila, A., Shopbell, P., & Richberg, K. 2000, ApJ, 538, 29
- (43)
- (44) Condon, J.J., 1992, ARA&A, 30, 575
- (45)
- (46) Cowie, L.L., Songaila, A., & Barger, A.J. 1999, AJ, 118, 603
- (47)
- (48) Cowie, L.L., et al. 2001, ApJ, 551, L9
- (49)
- (50) Crawford, C.S., Gandhi, P., Fabian, A.C., Wilman, R.J., Johnstone, R.M., Barger, A.J., & Cowie, L.L. 2001, MNRAS, in press (astro-ph/0106067)
- (51)
- (52) Daddi, E., Cimatti, A., Pozzetti, L., Hoekstra, H., Rttgering, H. J. A., Renzini, A., Zamorani, G., & Mannucci, F. 2000, A&A, 361, 535
- (53)
- (54) Daddi, E., Broadhurst, T., Zamorani, G., Cimatti, A., Rttgering, H., & Renzini, A. 2001, A&A, 376, 825
- (55)
- (56) Dawson, S., Stern, D., Bunker, A.J., Spinrod, H. & Dey, A. 2001, AJ, 122, 598
- (57)
- (58) Dey A., Graham, J. R., Ivison, R. J., Smail, I., Wright, G. S., & Liu, M. C. 1999, ApJ, 519, 610
- (59)
- (60) Dickinson, M., et al. 2000, ApJ, 531, 624
- (61)
- (62) Ebeling, H., White, D.A., & Rangarajan, F.V.N. 2001, MNRAS, submitted
- (63)
- (64) Elbaz, D., Flores, H., Chanial, P., Mirabel, I.F., Sanders, D., Duc, P.-A., Cersarsky, C.J., & Aussel, H. 2001, A&A, in press (astro-ph/0111243)
- (65)
- (66) Fabian, A.C., et al. 2000, MNRAS, 315, L8
- (67)
- (68) Ferguson, H.C, Dickinson, M., & Williams, R. 2000, ARA&A, 38, 667
- (69)
- (70) Fernández-Soto, A., Lanzetta, K.M., & Yahil, A. 1999, ApJ, 513, 34
- (71)
- (72) Folkes, S., et al. 1999, MNRAS, 308, 459
- (73)
- (74) Freeman, P.E., Kashyap, V., Rosner, R., & Lamb, D.Q. 2002, ApJS, in press (astro-ph/0108429)
- (75)
- (76) Gehrels, N. 1986, ApJ, 303, 336
- (77)
- (78) Giacconi, R., et al. 2001, ApJ, 551, 624
- (79)
- (80) Hasinger, G., Lehmann, I., Giacconi, R., Schmidt, M., Trumper, J., & Zamorani, G. 1999 in Highlights in X-ray Astronomy, eds. B. Aschenbach & M.J. Freyberg, MPE Report 272, p 199 (astro-ph/9901103)
- (81)
- (82) Hogg, D.W., et al. 2000, ApJS, 127, 1
- (83)
- (84) Hornschemeier, A.E., et al. 2001, ApJ, 554, 742 (Paper II)
- (85)
- (86) Hughes, D.H., et al. 1998, Nature, 394, 241
- (87)
- (88) Iwasawa, K., Matt, G., Guainazzi, M., & Fabian, A.C. 2001, MNRAS, 326, 894
- (89)
- (90) Landy, S.D., Szalay, A.S. 1993, ApJ, 412, L64
- (91)
- (92) Lehmann, I., et al. 2000, A&A, 354, 35
- (93)
- (94) Lehmann, I., et al. 2001, A&A, 371, 833
- (95)
- (96) Lira, P., Ward, M., Zezas, A., Alonso-Herrero, A., & Ueno, S. 2001, MNRAS, in press (astro-ph/0109198)
- (97)
- (98) Lyons, L. 1991, Data Analysis for Physical Science Students. Cambridge University Press, Cambridge
- (99)
- (100) Mannucci, F., Basile, F., Poggianti, B. M., Cimatti, A., Daddi, E., Pozzetti, L., & Vanzi, L. 2001, MNRAS, 326, 745
- (101)
- (102) Mannucci, F., Pozzetti, L., Thompson, D., Oliva, E., Baffa, C., Comoretto, G., Gennari, S., & Lisi, F. 2001, MNRAS, in press (astro-ph/0110648)
- (103)
- (104) Martini, P. 2001, AJ, 121, 2301
- (105)
- (106) McCarthy, P.J., et al. 2001, ApJ, 560, L131
- (107)
- (108) McCracken, H. J., Shanks, T., Metcalfe, N., Fong, R., & Campos, A. 2000, MNRAS, 318, 913
- (109)
- (110) Moran, E.C., Lehnert, M.D., & Helfand, D.J. 1999, ApJ, 526, 649
- (111)
- (112) Mukai, K. 2000, pimms Version 3.0 Users’ Guide. NASA/GSFC, Greenbelt
- (113)
- (114) Newsam, A.M., McHardy, L.M., Jones, L.R., & Mason, K.O. 1997, MNRAS, 292, 378
- (115)
- (116) O’Sullivan, E., Forbes, D.A., & Ponman, T.J. 2001, MNRAS, 328, 461
- (117)
- (118) Pierre, M., et al. 2001, A&A, 372, L45
- (119)
- (120) Poggianti, B.M. 1997, A&AS, 122, 399
- (121)
- (122) Pozzetti, L., & Mannucci, F. 2000, MNRAS, 317, L17
- (123)
- (124) Richards, E.A., Kellermann, K.I., Fomalont, E.B., Windhorst, R.A., & Partridge, R.B. 1998, AJ, 116, 1039
- (125)
- (126) Richards, E.A., Fomalont, E.B., Kellerman, K.I., Windhorst, R.A., Partridge, R.B., Cowie, L.L., & Barger, A.J. 1999, ApJ, 526, L73
- (127)
- (128) Richards, E.A. 2000, ApJ, 533, 611
- (129)
- (130) Scodeggio, M., & Silva, D.R. 2000, A&A, 359, 953
- (131)
- (132) Silva, L., Granato, G. L., Bressan, A., & Danese, L. 1998, ApJ, 509, 103
- (133)
- (134) Smail, I., Ivison, R.J., Kneib, J.-P., Cowie, L.L., Blain, A.W., Barger, A.J., Owen, F.N., & Morrison, G. 1999, MNRAS, 308, 1061
- (135)
- (136) Smith, G.P., Tommaso, T., Ellis, R., Smail, I., Kneib, J.-P., & Frye, B. 2001a, ApJ, in press (astro-ph/0108039)
- (137)
- (138) Smith, G.P., et al. 2001b, MNRAS, in press (astro-ph/0109465)
- (139)
- (140) Stanford, S.A., Holden, B.P., Rosati, P., Eisenhardt, P.R., Stern, D., Squires, G., & Spinrad, H. 2001, AJ, in press (astro-ph/0110709)
- (141)
- (142) Stark, A.A., Gammie, C.F., Wilson, R.W., Bally, J., Linke, R.A., Heiles, C., & Hurwitz, M. 1992, ApJS, 79, 77
- (143)
- (144) van den Bergh, S., Cohen, J.G., Hogg, D.W., & Blandford, R. 2000, AJ, 120, 2190
- (145)
- (146) Weisskopf, M.C., Tananbaum, H.D., Van Speybroeck, L.P. & O’Dell, S.L. 2000, Proc. SPIE, 4012, 2 (astro-ph/0004127)
- (147)
- (148) Williams, R.E., et al. 1996, AJ, 112, 1335
- (149)
- (150) Willott, C.J., Rawlings, S., & Blundell, K.M. 2001, MNRAS, 324, 1
- (151)
| VRO | Magnitude | VRO | Source | X-ray | Source | |||
|---|---|---|---|---|---|---|---|---|
| Sample | Limita | Areab | Definition | Densityd | e | Fractionf | Densityg | |
| Moderate-depth | 70.3 | 29 | % | |||||
| 6 | % | |||||||
| Deep | 5.3 | 9 | % | |||||
| Intermediate-depth X-ray detected | 70.3 | 10 | 100% |
| Optical coordinates | Optical magnitudes | |||||
|---|---|---|---|---|---|---|
| Other | ||||||
| 12 36 13.36 | +62 17 15.0d | 24.8 | 19.9 | 5.2 | 26.5 | |
| 12 36 14.55 | +62 13 44.0d | 23.8 | 20.0 | 4.1 | 26.0 | |
| 12 36 18.73 | +62 16 01.6d | 24.5 | 20.0 | 4.7 | 26.5 | |
| 12 36 20.49 | +62 12 37.8 | 24.7 | 20.4 | 4.6 | 27.0 | X |
| 12 36 20.93 | +62 16 07.3 | 23.9 | 20.2 | 4.0 | 26.5 | |
| 12 36 24.14 | +62 09 11.5d | 24.6 | 20.3 | 4.6 | 26.5 | |
| 12 36 25.32 | +62 10 35.8d | 24.0 | 20.2 | 4.1 | 25.0 | |
| 12 36 27.63 | +62 15 33.9d | 24.0 | 19.8 | 4.5 | 26.3 | |
| 12 36 30.75 | +62 15 13.5 | 24.3 | 20.2 | 4.4 | 26.5 | |
| 12 36 34.24 | +62 14 00.4d | 24.1 | 19.6 | 4.8 | 26.5 | |
| 12 36 35.73 | +62 10 32.9d | 23.7 | 19.9 | 4.1 | 27.5 | |
| 12 36 38.83 | +62 14 51.7d | 25.2 | 20.2 | 5.2 | 26.5 | I |
| 12 36 40.89 | +62 15 04.9d | 23.8 | 20.1 | 4.0 | ||
| 12 36 41.37 | +62 11 29.7 | 22.6 | 18.5 | 4.4 | ||
| 12 36 41.41 | +62 11 42.6d | 23.6 | 19.4 | 4.5 | 24.1 | R,Z |
| 12 36 42.89 | +62 09 58.9 | 25.7 | 19.8 | 6.2 | 26.5 | X |
| 12 36 43.91 | +62 16 21.0d | 24.2 | 19.9 | 4.7 | 25.4 | |
| 12 36 44.12 | +62 12 44.9d | 24.2 | 19.7 | 4.8 | 26.5 | |
| 12 36 53.79 | +62 11 18.0d | 24.8 | 20.2 | 4.9 | 26.5 | |
| 12 36 58.80 | +62 10 22.6 | 24.1 | 20.4 | 4.0 | 26.5 | X |
| 12 37 01.57 | +62 11 46.1 | 24.8 | 19.5 | 5.6 | 26.5 | X,R,I,Z |
| 12 37 03.75 | +62 13 52.0 | 23.4 | 19.5 | 4.2 | I | |
| 12 37 05.67 | +62 11 13.7d | 25.7 | 20.1 | 5.9 | 26.5 | |
| 12 37 07.20 | +62 14 08.1 | 25.0 | 20.4 | 5.0 | 26.3 | X,R |
| 12 37 11.17 | +62 09 33.1d | 23.1 | 19.4 | 4.1 | 26.5 | |
| 12 37 12.08 | +62 10 50.8d | 23.6 | 19.7 | 4.2 | 25.0 | |
| 12 37 12.46 | +62 09 44.4d | 24.8 | 20.2 | 4.9 | 26.5 | |
| 12 37 14.04 | +62 09 16.8 | 23.9 | 20.2 | 4.0 | 25.8 | X |
| 12 37 23.88 | +62 14 00.5 | 24.3 | 20.3 | 4.2 | 26.5 | |
| Optical coordinates | Optical magnitudes | Photometric | |||||
|---|---|---|---|---|---|---|---|
| Redshiftc | Other | ||||||
| 12 36 41.39 | +62 11 43.0f | 23.0 | 18.9 | 4.1 | 24.0 | 1.524e | R,Z |
| 12 36 44.12 | +62 12 44.8f | 24.6 | 19.6 | 4.8 | 26.6 | 1.32 | |
| 12 36 44.56 | +62 12 15.4f | 25.3 | 20.7 | 4.6 | 26.7 | 1.44 | |
| 12 36 45.65 | +62 12 41.9f | 25.5 | 20.0 | 5.4 | 27.0 | 1.64 | |
| 12 36 48.62 | +62 12 15.7f | 24.3 | 19.8 | 4.4 | 25.4 | 1.60 | |
| 12 36 52.09 | +62 12 26.2 | 23.8 | 19.7 | 4.0 | 25.9 | 1.00 | X,R |
| 12 36 52.10 | +62 12 01.1f | 27.4 | 21.5 | 5.7 | 29.1 | 1.84 | |
| 12 36 56.14 | +62 13 25.1f | 24.9 | 20.4 | 4.3 | 26.9 | 1.08 | |
| 12 36 56.58 | +62 12 57.3 | 25.3 | 21.0 | 4.1 | 27.4 | 1.00 | |
| X-ray coordinates | Optical magnitudes | X-ray counts | Band | X-ray flux | FB luminosity | VRO | |||||||||||
|---|---|---|---|---|---|---|---|---|---|---|---|---|---|---|---|---|---|
| FBc | SBc | HBc | Ratiod | FBf | SBf | HBf | Other | Samplei | |||||||||
| 12 36 15.89 | +62 15 15.5 | 25.3 | 21.4 | 4.2 | 26.5 | 81.518.7 | 20.7 | 71.920.7 | 3.52 | –0.26 | 2.19 | 0.10 | 2.48 | 2.28 | 43.45 | R | I |
| 12 36 20.52 | +62 12 38.1 | 24.7 | 20.4 | 4.6 | 27.0 | 29.47.9 | 16.35.8 | 15.06.3 | 0.88 | 0.49 | 0.09 | 0.44 | 0.40 | 7.64 | I,M | ||
| 12 36 33.76 | +62 13 13.8 | 24.7 | 20.7 | 4.3 | 26.5 | 40.38.3 | 9.8 | 35.67.9 | 3.67 | –0.29 | 1.06 | 0.05 | 1.19 | 1.11 | 21.14 | I | |
| 12 36 35.27 | +62 11 51.7 | 24.5 | 20.8 | 4.1 | 27.4 | 23.97.0 | 9.94.8 | 12.75.8 | 1.40 | 0.29 | 0.05 | 0.32 | 0.25 | 4.79 | I | ||
| 12 36 39.65 | +62 09 36.7 | 25.3 | 21.1 | 4.5 | 26.5 | 14.36.9 | 9.55.3 | 12.1 | 1.29 | 1.40 | 0.19 | 0.06 | 0.33 | 0.17 | 3.17 | I | |
| 12 36 42.89 | +62 09 58.9j | 25.7 | 19.8 | 6.2 | 26.5 | 11.8 | 4.12.0 | 9.8 | 2.40 | 1.40 | 0.16 | 0.02 | 0.27 | 0.15 | 2.90 | M | |
| 12 36 47.95 | +62 10 19.9 | 25.3 | 21.0 | 4.6 | 26.5 | 36.28.3 | 11.65.3 | 24.47.2 | 0.10 | 0.96 | 0.07 | 0.89 | 0.90 | 17.20 | I | I | |
| 12 36 51.97 | +62 12 25.8j | 23.7 | 20.0k | 4.0 | 26.9 | 7.3 | 3.62.0 | 4.0 | 1.12 | 1.40 | 0.08 | 0.02 | 0.09 | 0.03l | R,Z | D | |
| 12 36 54.57 | +62 11 11.0 | 25.3 | 21.4 | 4.2 | 26.0 | 30.77.7 | 12.15.2 | 20.66.7 | 0.28 | 0.77 | 0.07 | 0.75 | 0.70 | 13.32 | I | ||
| 12 36 58.83 | +62 10 22.3 | 24.1 | 20.4 | 4.0 | 26.5 | 42.68.9 | 10.3 | 39.98.6 | 3.87 | –0.34 | 1.20 | 0.05 | 1.41 | 1.28 | 24.39 | I,M | |
| 12 37 01.66 | +62 11 45.9j | 24.8 | 19.5 | 5.6 | 26.5 | 11.84.4 | 7.22.8 | 7.4 | 1.03 | 1.40 | 0.14 | 0.04 | 0.18 | 0.04l | R,I,Z | M | |
| 12 37 07.23 | +62 14 08.0 | 25.0 | 20.4 | 5.0 | 26.3 | 54.79.3 | 24.26.4 | 32.27.7 | 0.50 | 1.00 | 0.12 | 0.92 | 0.88 | 16.75 | R | I,M | |
| 12 37 14.07 | +62 09 16.7 | 23.9 | 20.2 | 4.0 | 25.8 | 333.221.2 | 223.716.8 | 111.213.3 | 1.46 | 3.67 | 1.11 | 2.58 | 2.44 | 46.50 | I,M | ||
| VRO | Effective | Source counts | Background counts | Statistical probability | Flux | |||||||||
|---|---|---|---|---|---|---|---|---|---|---|---|---|---|---|
| Sample | Exposureb | FBc | SBc | HBc | FBd | SBd | HBd | FBe | SBe | HBe | FBf | SBf | HBf | |
| Moderate-depth | 18 | 15.8 | 124 | 38 | 67 | 94.3 | 19.6 | 55.2 | 0.07 | 1.5 | 0.6 | 2.6 | ||
| Moderate-depth () | 9 | 8.1 | 71 | 23 | 39 | 47.7 | 9.3 | 28.6 | 0.04 | 2.2 | 0.9 | 3.7 | ||
| Moderate-depth () | 9 | 7.7 | 53 | 15 | 28 | 46.5 | 10.3 | 26.5 | 0.20 | 0.11 | 0.41 | 2.0 | 0.6 | 3.7 |
| Deep | 7 | 6.5 | 52 | 16 | 23 | 38.4 | 7.7 | 22.4 | 0.02 | 0.48 | 2.1 | 0.7 | 4.0 | |