Abstract
In order to understand the time scales for complete mixing in a supernova-driven ISM we used the model of Avillez (2000) to follow the mixing and dispersal of inhomogeneities with different length scales. We included tracer fields to follow the inhomogeneities in kpc-scale simulations with different supernova rates. We find that an initially inhomogeneous ISM still shows local variations and a clumpy distribution on time scales of several hundred Myr. This clumpy structure does not disapear over a time of a few tens of Myr, even if the rate of SNe is increased to ten times the Galactic rate. These local variations occur because, even in the presence of numerical diffusion, gas does not mix quickly between hot and cold regions. The lower limit that we are able to place on the mixing time at the kpc scale is already longer than the time for chemistry to reach local equilibrium in the gas. The simulations also show that the time scale to erase inhomogeneities in the ISM is nearly independent of their length scale over the range 25–500 pc, contrary to what is expected from classical mixing length theory.
Mixing of Primordial Elements in a Supernova-Driven ISM
1Department of Astrophysics, American Museum of Natural History, Central Park West at 79th Street, New York, NY 10024, USA.
1 Introduction
Observations show significant abundance fluctuations along and between lines of sight in the interstellar medium (ISM), suggesting the ISM is far from homogeneous. For example, observations using the Interstellar Medium Absorption Profile Spectrograph (IMAPS) show local variations in the D/H ratio of about a factor of three (Jenkins et al. 1999; Sonneborn et al. 2000). Deuterium is mainly produced during Big Bang nucleosynthesis111However, Mullan & Linsky (1999) have proposed that D can be formed in stellar flares from M dwarf stars. and only destroyed in pre-main sequence stars. Therefore, the D in the ISM traces the fraction of gas not processed through stars, and the detection of local variations in the D/H ratio indicates incomplete mixing of processed material into the ISM. However, such an inhomogeneity picture contradicts the almost homogeneous distribution seen in O/H, which suggest that the ISM mixes completely on timescales no longer than that for chemistry reach an equilibrium.
These observations pose the question of how chemical elements such as D can avoid being mixed well enough to suppress local variations in the D/H ratio. Furthermore, the ISM is regulated by supernova explosions that form well structured and explosive flows in addition to diffuse turbulence that acts on the smaller scales. It is therefore, necessary to understand the mixing process in such a medium by carrying out direct simulations of the evolution of the ISM polluted with inhomogeneities of different length scales.
Section 2 deals with the description of the three-dimensional model used in this study, as well as, with the setup and evolution of the simulations. In section 3 we present the results of these simulations and discuss them in the light of the classical diffusion theory. Finally, in section 4 we present a summary of the main results.
| Runa | ||||
| [pc] | [Myr] | [Myr] | ||
| L11 | 5 | 1 | 303.1 | 311.2 |
| L12 | 5 | 10 | 143.0 | 167.2 |
| L13 | 5 | 20 | 123.5 | 144.9 |
| L16 | 5 | 30 | 108.4 | 130.5 |
| L17 | 5 | 50 | 107.0 | 127.2 |
| L21 | 2.5 | 1 | 318.8 | 326.5 |
| L22 | 2.5 | 10 | 162.4 | 184.5 |
| L23 | 2.5 | 20 | 138.5 | 151.6 |
| L31 | 1.25 | 1 | 347.2 | 366.4 |
| L32 | 1.25 | 10 | 180.1 | 199.1 |
| L33 | 1.25 | 20 | 149.6 | 163.8 |
| a Run number and finest grid level number. | ||||
| b Finest grid resolution. | ||||
| c Time between SNe in terms of the Galactic value. | ||||
| d Time for complete mixing. | ||||
2 Supernova-Driven ISM Model
2.1 Mixing Simulations
The model includes a fixed gravitational field provided by the stars in the disk, and an ideal-gas equation of state. Radiative cooling is treated assuming collisional ionization equilibrium, using a piecewise cooling function following that presented in Figure 2 of Dalgarno & McCray (1972) with an ionization fraction of 0.1 at temperatures below K and a temperature cutoff at 10 K. Background heating due to starlight varies with as described in Wolfire et al. (1995), and at it is chosen to balance radiative cooling at 8000 K.
Type Ib, Ic, and II SNe are set up at the beginning of their Sedov phases, with radii determined by their progenitor masses, as described in detail by Avillez (2000). Sixty percent of the SNe are set up within associations, and the rest are set up at random sites. OB associations are set up in a layer with a scale height of 46 pc (from the midplane) following the distribution of the molecular gas in the Galaxy, while the isolated SNe are set with an exponential distribution with a scale height of 90 pc. The rates of occurrence of SNe in the Galaxy are normalized to the volume under study, with the Galactic rate for types Ib and Ic in the Galaxy taken to be yr-1, while for type II it is yr-1 (Cappellaro et al. 1997). The total rate of these SNe in the Galaxy is yr-1, or one SN every 71 yr.
The interstellar gas is initially distributed in a smooth disk with the vertical distribution of Dickey & Lockman (1990). In addition, an exponential profile representing the distribution of the warm ionized gas with a scale-height of 1 kpc in the Galaxy as described in Reynolds (1987) is used.
We model inhomogeneities in the ISM with a tracer field distributed in a checkerboard pattern of empty and full squares. We followed the evolution of models with squares having length of 25, 50 and 500 pc in the and directions (parallel to the Galactic plane). Slab symmetry of the tracer field is assumed along the -direction (perpendicular to the Galactic plane). In the current work we report on simulations using five SN rates: , 10, 20, 30 and 50. The simulations are run until 400 Myr for and 200 Myr for the remaining supernova rates. This evolution time is enough for the system to reach steady state. A summary of these runs is presented in Table 1.
The computational domain contains a section of the Galaxy with an area of 1 kpc2 and vertical extension from -10 to 10 kpc. The innermost edge lies 8.5 kpc from the Galactic centre. The computational grid has a resolution of 10 pc, except in the layer between -250 and 250 pc, where three levels of adaptive mesh refinement are used, yielding a finest resolution of 1.25 pc. These simulations use the piecewise-parabolic method of Colella & Woodward (1984), a third-order scheme implemented in a dimensionally-split (Strange 1968) manner in combination with the AMR scheme of Berger & Colella (1989), with the subgridding scheme of Bell et al. (1994).
2.2 Global Evolution of the ISM
Once disrupted by the SN explosions, which start occurring at time , the disk never returns to its initial state. Instead, regardless of the initial vertical distribution of the disk gas, a thin disk of cold gas forms in the Galactic plane, and, above and below, a thick, inhomogeneous gas disk forms. The code does not explicitly follow ionization states, but we can trace gas with temperature K and scale height of 180 pc, which we designate Hi, and gas with K and scale height of 1 kpc, which we designate Hii. These distributions reproduce those described in Dickey & Lockman (1990) and Reynolds (1987), respectively. The upper parts of the thick Hii disk form the disk-halo interface, where a large scale fountain is set up by hot ionized gas escaping in a turbulent convective flow (see Avilez 2000 and Avillez & Mac Low 2001).
3 Evolution of ISM Inhomogeneities
The tracer field is a scalar whose mass flux follows that of the density and whose value is unity in the regions of the flow where it is present and zero elsewhere in the flow. By definition the tracer field should keep its value of 1, and therefore its average value on a checkerboard should always be 0.5 regardless of how it is advected. Numerical schemes introduce numerical diffusion leading sooner or later to a change of the value of the tracer field. However, its average value over the grid should remain constant. The simulations show that as the disk gas evolves to steady state approaches 0.5, with variations of no more than 2.4% occurring for a supernova rate of 30 times that in the Galaxy.
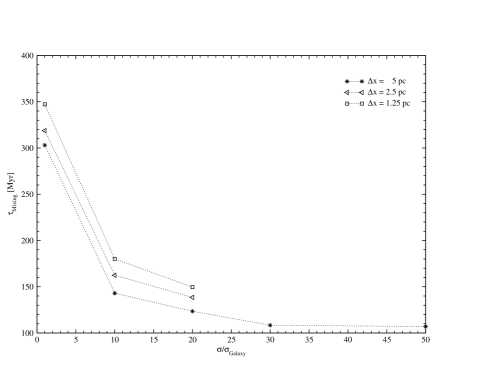
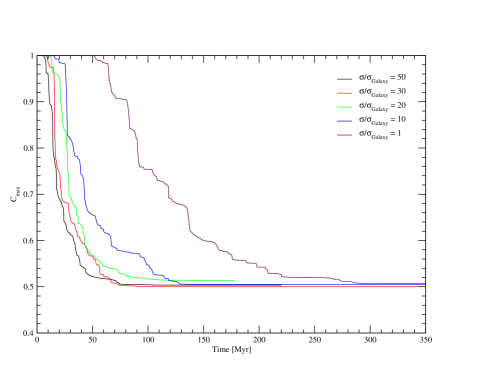
We define complete mixing to be when the maximum and minimum of the tracer field become numerically indistinguishable from each other and , i.e., (). Table 1 presents the time scales for complete mixing in checkerboards with 50 and 500 pc scale-lengths for resolutions of 5, 2.5 and 1.25 pc, while Figures 1 and 2 show the time variation of for a resolution of 5 pc and the variation of the mixing time with supernova rate for different finer resolutions, respectively.
Figure 1 shows that there is a steady decrease of until complete mixing occurs. Futhermore, and take almost the same amount of time to vary from a difference to as the time from to , when we define complete mixing to occur. This indicates that smaller scale structures dominate the mixing process after the gas has been completely mixed on larger scales.
Figures 1 and 2 show that the time taken for complete mixing to occur decreases with increasing supernova rate, that is, increased energy input into the ISM. However, the rate of increase of mixing reaches a saturation level for , beyond which the increase in the supernova rate does not accelerate mixing in the ISM. For SN rates greater than 20 times the Galactic rate we see that the mixing time scales differ by only a few Myr (see Table 1), with complete mixing occurring at Myr for pc. This results from the fact that for , after the first 50 Myr of evolution a large fraction fo the disk gas has a temperature greater than K and at 100 Myr of evolution all the gas is hotter than K. As a consequence of the high SN rate the disk becomes hotter and cooling becomes inefficient. At this high temperature the sound speed is correspondingly high, so the gas mixes within a 40-50 Myr period (Roy & Kunth 1995) leading to complete mixing at some 110 Myr.
The time taken for complete mixing to occur in a checkerboard with 50 pc squares varies from Myr for to some 120 Myr for and 107 for for pc, while for pc mixing varies from 347 Myr for to 150 Myr for . On 500 pc squares complete mixing is surprisingly only delayed by around 20 Myr (Table 1). The similarity between these time scales indicates that the mixing process is almost independent of the length-scale of the inhomogeneities, and therefore, of the initial setup adopted for the tracer field. Rather, it is regulated by supernovae and their energy input into the ISM.
According to classical mixing length theory the mixing time scales of these boards should follow the relation , where is the length of the squares. Therefore, the mixing time of inhomogeneities with a scale length of 500 pc should be 25 times longer than the mixing time for 50 pc squares. The computed similarity in the mixing time scales (Table 1) for the different inhomogeneity sizes shows that classical mixing length theory does not describe mixing in the ISM well. This seems to be because much of the ISM is dominated by nearly laminar flows inside of SNRs and superbubbles rather than by diffuse turbulence. The latter does act on smaller scales and in cooler gas, in which classical mixing length theory may apply better.
4 Summary
In this paper we try to shed light on the time scales that it takes to erase inhomogeneities in the ISM and how this process depends on the inhomogeneity length scale. We find: (1) The time scale to erase inhomogeneities in the ISM is nearly independent of their length scale on scales above 10 pc or so; (2) Mixing time scales decrease with increasing supernova rate until all the gas is hot and the mixing rate saturates. This occurs when , when the mixing time scale is Myr for pc and 150 Myr for pc; (3) Even after some of the gas has been mixed, the simulations show that the ISM remains clumpy for at least twice as long if we examine scales smaller than a kpc. Even if the rate of SNe is increased to ten times the Galactic rate, this clumpy structure does not disappear over a time of a few tens of Myr.
This work shows that inhomogeneities that are present in the ISM, assuming that no further inhomogeneities are introduced into the system, take a very long time to be erased. The time for complete mixing (greater than 107 Myr, which occurs for and pc) is already longer that any time scale for chemical equilibrium to occur, and therefore, the ISM will show a clumpy distribution. The local variations occur because, even in the presence of numerical diffusion, gas does not mix quickly between hot and cold regions.
Acknowledgements. The authors acknowledge useful discussions with D. York, and E. Jenkins, and with R. Ferlet, who also emphasized the importance of working on this problem. This work was supported by an NSF CAREER grant (AST 99-85392).
References
- [1] de Avillez M. A., 2000, MNRAS, 315, 479
- [2] de Avillez M. A., & Mac Low M.-M., 2001, ApJ, 557, L57
- [3] Bell J., Berger M., Saltzman J., & Welcome M., 1994, SIAM J. Sci. Comp., 15, 127
- [4] Berger M. J., & Colella P., 1989, J. Comp. Phys. 82, 64
- [5] Cappellaro E., Turatto M., Tsvetkov D. Yu., Bartunov O. S., Pollas C., Evans R., & Hamuy M., 1997, A&A, 322, 431
- [6] Colella P., & Woodward P., 1984, J. Comp. Phys., 54, 174
- [7] Dalgarno A., & McCray R. A., 1972, ARA&A, 10, 375
- [8] Dickey J. M., & Lockman F. J., 1990, ARA&A, 28, 215
- [9] Jenkins E. B., Tripp T. M., Woniak P. R., Sofia U. J., & Sonneborn G., 1999, ApJ, 520, 182
- [10] Lockman F. J., Hobbs L. M., & Shull J. M., 1986, ApJ, 301, 380
- [11] Mullan D. J., & Linsky J. L., 1999, ApJ, 511, 502
- [12] Reynolds R. J., 1987, ApJ, 323, 118
- [13] Roy J.-R., & Kunth D., 1995, A&A, 294, 432
- [14] Sonneborn G., Tripp T. M., Ferlet R., Jenkins E. B., Sofia U. J., Vidal-Madjar, A., & Wozniak P. R., 2000, ApJ, 545, 277
- [15] Strange W. G., 1968, SIAM J. Numer. Anal., 5, 506
- [16] Wolfire M. G., McKee C. F., Hollenbach D., & Tielens A. G. G. M., 1995, 453, 673