Star formation, metallicity and dust properties derived from the SAPM galaxy survey spectra
Abstract
We have derived star formation rates (SFRs), gas-phase oxygen abundances and effective dust absorption optical depths for a sample of galaxies drawn from the Stromlo-APM redshift survey using the new Charlot & Longhetti (2001; CL01) models, which provide a physically consistent description of the effects of stars, gas and dust on the integrated spectra of galaxies. Our sample consists of 705 galaxies with measurements of the fluxes and equivalent widths of H, [O ii], and one or both of [N ii] and [S ii]. For a subset of the galaxies, 60 and 100 m IRAS fluxes are available. We compare the star formation rates derived using the models with those derived using standard estimators based on the H, the [O ii] and the far-infrared luminosities of the galaxies. The CL01 SFR estimates agree well with those derived from the IRAS fluxes, but are typically a factor of higher than those derived from the H or the [O ii] fluxes, even after the usual mean attenuation correction of mag is applied to the data. We show that the reason for this discrepancy is that the standard H estimator neglects the absorption of ionizing photons by dust in H ii regions and the contamination of H emission by stellar absorption. We also use our sample to study variations in star formation and metallicity as a function of galaxy absolute magnitude. For this sample, the star formation rate per unit luminosity is independent of magnitude. The gas-phase oxygen abundance does increase with luminosity, although the scatter in metallicity at fixed magnitude is large.
keywords:
galaxies: general – galaxies: ISM – galaxies: stellar content.1 Introduction
Most large spectroscopic galaxy surveys have been carried out with the aim of determining the luminosity function or of studying the three-dimensional clustering properties of galaxies. The spectra are used to measure redshifts and so to infer the distances to galaxies. However, the spectra also contain a wealth of additional information about the physical properties of galaxies. The continuum and the absorption lines provide information about the stellar content, while the nebular emission lines provide a measure of the star formation rate (SFR) and the interstellar metallicity.
Kennicutt (1992a) published an atlas of high-resolution, high signal-to-noise, flux-calibrated spectra of a small sample of nearby galaxies of different Hubble types. The spectra obtained in redshift surveys are typically of much lower quality than the spectra in the Kennicutt atlas, but they nevertheless provide a means of studying the star formation rates and metallicities of a magnitude-limited sample of normal galaxies and of characterizing trends in these properties as a function of galaxy luminosity and environment. As a result, there have been a large number of papers analyzing the spectral properties of redshift survey galaxies.
Many studies focus on SFR estimates based on a single strong emission line, such as [O ii]3727 (e.g. Hashimoto et al 1998; Christlein 2000; Baldi, Bardelli & Zucca 2001). One of the advantages of [O ii] is that it is easily observed in high-redshift galaxies and can thus be used to study evolutionary trends in star formation (e.g. Ellis et al 1996; Cowie et al 1996; Hammer et al 1997; Balogh et al 1998). Other studies focus on additional lines, in particular the H line, which is believed to be a more robust tracer of star formation than [O ii] (e.g. Gallego et al 1995; Tresse & Maddox 1998; Tresse et al 1999; Barton, Geller & Kenyon 2000).
Kennicutt (1998; hereafter K98) reviewed a number of traditional diagnostic methods for inferring star formation rates from galaxy spectra. The two methods that are applicable to redshift survey data are based on the H recombination line and the [O ii] forbidden-line doublet. As discussed by K98, the derived SFRs are subject to errors because of attenuation by dust. In the case of [O ii], variations in excitation, metallicity and diffuse gas fraction will also contribute to the uncertainty in the derived SFRs. Both methods ignore the absorption of ionizing photons by dust in H ii regions, which could play an important role (Petrosian, Silk & Field 1972; Mathis 1986; Charlot & Fall 2000).
Recently, Charlot & Longhetti (2001, hereafter CL01) quantified the uncertainties in these SFR estimators. They constructed physically realistic models describing the propagation of the photons emitted by stars through the interstellar medium (ISM) and their absorption by dust in galaxies. These models combine the latest version of the Bruzual & Charlot (1993) population synthesis code with the Ferland (1996) photoionization code for modelling nebular emission. Stars are assumed to form in interstellar birth clouds (i.e. giant molecular clouds). After yr, young stars disrupt their birth clouds and migrate into the ambient ISM. The line emission from a galaxy arises both from the H ii regions surrounding young stars and from the diffuse gas ionized by photons that have leaked into the ambient ISM. In the CL01 model, the depletion of heavy elements onto dust grains, the absorption of ionizing photons by dust, and the contamination of Balmer emission lines by stellar absorption are all included in a self-consistent way. The absorption of photons from H ii regions and from older stars is described by a dust model developed by Charlot & Fall (2000). In this prescription, line and continuum photons are attenuated differently because of the finite lifetimes of the clouds in which stars form.
CL01 showed that in models that include absorption by dust and that match the observed ionized-gas properties of local galaxies, SFR estimates based purely on the H or [O ii] luminosities of galaxies can be in error by more than an order of magnitude. On the other hand, with the help of other lines such as H, [O iii], [N ii] and [S ii], these errors can be substantially reduced. CL01 presented a number of new estimators of the SFRs, gas-phase oxygen abundances and dust absorption optical depths of galaxies based on combinations of these lines.
This paper presents the first application of the CL01 model to a magnitude-limited sample of galaxies drawn from the Stromlo-APM (SAPM) redshift survey (Loveday et al 1996). Tresse et al (1999) have measured the fluxes and equivalent widths of H, [O ii], [N ii] and [S ii] for the galaxies in this survey. We compare the SFRs derived using standard estimators based on the H and [O ii] lines to those derived using the CL01 models, which make use of all four lines. We show that the CL01 SFR estimates are typically a factor of higher than those derived using just H or [O ii], even after the usual mean attenuation correction of mag is applied to the data. We show that the reason for this discrepancy is that the standard H estimator neglects the absorption of ionizing photons by dust in H ii regions and the contamination of H emission by stellar absorption.
Observations from the Infrared Astronomical Satellite (IRAS) are available for 149 galaxies in the sample and provide an independent check on the derived star formation rates. We find that the CL01 SFR estimates agree surprisingly well with those based on the 60 and 100 m IRAS fluxes.
Within the subset of the Stromlo-APM survey which we study, we find that the star formation rate per unit luminosity is independent of galaxy absolute magnitude. We derive gas-phase oxygen abundances and dust absorption optical depths for this sample. Bright, galaxies have O/H values close to solar, while fainter galaxies are found to be less metal-rich on average. The distribution of H attenuations is similar to that found for other samples of nearby star-forming galaxies.
We describe the properties of the SAPM galaxy sample in Section 2 below. In Section 3, we illustrate the inconsistencies obtained when estimating star formation rates of galaxies using different traditional diagnostic methods (H, [O ii], UV and FIR luminosities). Readers familiar with the uncertainties affecting star formation measures in galaxies may skip at least the first part of this section. In Section 4, we describe how the new models developed by CL01 can help us better constrain the star formation, metallicity and dust properties of SAPM galaxies using a combination of different spectral diagnostics. In Section 5, we present the results of this analysis and identify the important weaknesses affecting the traditional H estimator. Our conclusions are summarized in Section 6.
2 Description of the sample
Our sample is drawn from the the Stromlo-APM (SAPM) redshift survey (Loveday et al. 1996). The SAPM survey consists of 1797 galaxies brighter than covering 4300 deg2 of the south galactic cap. The mean redshift of the galaxies in the survey is . The spectra were taken with the Dual-Beam Spectrograph of the Australian National University 2.3-m telescope at Siding Spring. The wavelength range is 3700–5000 Å in the blue and 6300–7600 Å in the red, and the dispersion is Å/pixel. The fibre-coupling of each beam to two CCD chips introduced additional small gaps in the wavelength coverage in the regions 4360–4370 Å and 7000–7020 Å. The spectra were taken with 8 arcsec slits and the spectral resolution was 5 Å (FWHM).
Tresse et al. (1999) measured the 4000 Å breaks and emission-line properties of 1671 galaxies with in the sample (the other 126 galaxies in the original sample were either brighter than , or their spectra were blue-shifted, or they had published redshifts). They measured the fluxes of all lines with emission equivalent widths larger than 2 Å, corresponding to a detection limit. Because of the wavelength gaps in the spectra, different lines were measured for galaxies at different redshifts.
We first exclude 79 galaxies with , which are likely to be AGN. The fluxes of H, [O ii], [N ii] and [S ii] could be measured for 416 galaxies. The fluxes of subsets of these lines are available for 588 additional galaxies. Of these, 289 galaxies have measurements of H, [O ii], and either [N ii] or [S ii]. Finally, 588 galaxies have no fluxes in emission with equivalent widths larger than 2 Å. We note that since H and [O iii] fall in between the blue and red beams of the spectrograph for most objects, they are generally not observed. In this paper, we focus on the subsample of 705 non-Seyfert galaxies for which H, [O ii], and at least one of [N ii] or [S ii] were measured.
The absolute flux calibration of the original SAPM spectra is only accurate to per cent because of the limited number of standard stars observed each night (Singleton 2001). However, the relative flux calibration, which is more critical for our analysis of emission line ratios and equivalent widths is accurate to per cent (Tresse et al. 1999). The 8 arcsec-wide and 7 arcmin-long slit used in the observations samples typically 45 per cent of the rest-frame projected area of a galaxy at a surface brightness level of 25 mag arcsec-2. To correct for this effect, Singleton (2001) computed the flux in the band in each spectrum and derived an aperture correction for each galaxy using the ratio of the spectral flux to the total band flux of the galaxy.
The above aperture correction should be accurate so long as the line emission and the blue light are correlated over the entire galaxy. One worry is that redshift surveys that use limited spectroscopic apertures may be biased as a function of morphological type, because spectroscopic properties vary significantly from the inner (bulge-dominated) to the outer (disc-dominated) regions of galaxies. Kochanek, Pahre & Falco (2001) have shown, however, that the long-slit SAPM spectra sample the overall light distribution of a galaxy far better than the small-aperture (e.g. 2–3 arcsec fibre) spectra of other nearby spectroscopic surveys. They conclude that the spectral classification of SAPM galaxies should not suffer from aperture bias. Also, Tresse et al. (1999) showed that the average properties of galaxies in the SAPM sample are similar, in terms of line ratios (e.g. [N ii]/H and [O ii]/H), to those in the integrated-spectrum sample of Kennicutt (1992b). As found by Kennicutt (1992b), the main effect of disc undersampling is to reduce the strengths of the various emission lines in roughly equal proportion. Thus, the aperture corrections derived by Singleton (2001) should be appropriate. We expect, therefore, that the spectral analysis of the SAPM galaxy sample presented below does not suffer from any significant aperture bias.
Observations from IRAS are also available for 279 galaxies in the sample (Singleton 2001). Only 149 of these belong to our subsample of 705 non-Seyfert galaxies with measurements of H, [O ii], and one or both of [N ii] and [S ii].
In summary, we consider two samples in this paper: (1) a restricted sample of 149 non-Seyfert galaxies with IRAS detections, for which fluxes and equivalent widths of H, [O ii], and one or both of [N ii] and [S ii] are available. We use this sample to compare star formation rates derived using different estimators based on the H, [O ii] and far-infrared (FIR) luminosities of galaxies; (2) a larger sample of 705 non-Seyfert galaxies for which fluxes and equivalent widths of H, [O ii], and one or both of [N ii] and [S ii] are available. We use this sample to study trends in star formation rate and metallicity as a function of galaxy absolute luminosity.
In this paper, we adopt a Hubble constant km s-1Mpc-1.
3 Star Formation rates Derived using Standard Estimators
In this section, we adopt the formulae given in K98 to convert H, [O ii], UV and FIR luminosities into star formation rates, and we check the results for consistency.
3.1 Standard SFR estimators
The K98 calibration of the H luminosity emitted per unit SFR is derived by using standard population synthesis models to calculate the ionizing radiation produced by young stars and by applying dust-free case B recombination to this. For solar abundances and a Salpeter IMF (0.1–100 M⊙), K98 derives the following transformation between H luminosity and SFR:
| (1) |
This calibration does not include the effects of attenuation by dust. Kennicutt (1983) and Niklas, Klein & Wielebinski (1997) have used observations of the integrated H and thermal radio fluxes of nearby spiral galaxies to derive a mean attenuation mag for these objects. Unless otherwise specified, we apply a ‘standard’ attenuation correction mag to all galaxies in the sample. We emphasize that this corrects for only part of the effects of dust on the H line, namely the absorption by dust of H photons outside the H ii regions in which they are produced. The correction neglects the diminution of the H line caused by the absorption of ionizing photons by dust inside H ii regions (Petrosian, Silk & Field 1972; Mathis 1986; Charlot & Fall 2000). More refined attenuation corrections based on the departure of the observed H/H ratio of each galaxy from dust-free case B recombination would suffer from the same limitation (we recall that H luminosities are not available for SAPM galaxies).
The luminosities of forbidden lines such as [O ii] are not directly coupled to the ionization rate, and their excitation is known to be sensitive to the abundance and the ionization state of the gas. However, it is claimed that the excitation of [O ii] is sufficiently well behaved in observed galaxies that it can be calibrated empirically through H as a quantitative SFR tracer (Gallagher et al 1989; Kennicutt 1992b). K98 gives the formula
| (2) |
It is worth noting that, because this estimator is based on an empirical calibration, the relative attenuation of the H and [O ii] lines is automatically accounted for. We also apply a standard attenuation correction mag to the [O ii]-derived SFR estimates.
The non-ionizing ultraviolet (UV) radiation from young stars is another standard SFR estimator, especially in high-redshift galaxies where optical emission lines are not always accessible. K98 gives the following transformation between UV luminosity and SFR:
| (3) |
This formula includes no dust correction and assumes that the SFR has remained constant over timescales that are long compared to the lifetimes of the dominant UV emitting population ( yr). For the choice of a Salpeter (0.1–100 M⊙) IMF, the UV luminosity is practically independent of wavelength. In Section 3.2 below, we address the uncertainty in the above relation that arises as a result of the absorption of UV radiation by dust.
The FIR emission should provide an excellent measure of the SFR in dusty, circumnuclear starbursts. As discussed by K98, in the optically thick limit, it is sufficient to model the bolometric luminosity of the stellar population, the greatest uncertainty being the assumed age of the starburst. K98 quote the following relation for continuous bursts of age 10–100 Myr:
| (4) |
where refers to the luminosity integrated over the full mid-infrared to submillimeter spectrum (8–1000 m).
In more normal star-forming galaxies, the relation between SFR and FIR emission is more complex. As discussed by K98, the contribution to dust heating from older stars will lower the effective coefficient in Equation (4), whereas the lower optical depth of the dust will tend to increase the coefficient. Buat & Xu (1996) computed the total FIR luminosity emitted per unit SFR in spiral galaxies of type Sb to Irr using ultraviolet and IRAS observations of 152 nearby disc galaxies. For this sample, they derived a mean coefficient a factor larger than that given in Equation (4). Furthermore, Misiriotis et al. (2001) have carried out a detailed study of the optical to FIR spectral energy distributions of nearby, edge-on galaxies of type Sb-Sbc. Their data also indicate that naive application of Equation (4) to these galaxies will underestimate the SFRs by a factor of . [Note that despite these considerations, we will always adopt the expression in Equation (4) above when computing .]
3.2 Comparison of SFRs derived using different standard estimators
The SFR estimators above are valid in opposite limits for the transfer of line and continuum radiation through the ISM of galaxies. Equation (1) assumes that the galaxies are transparent. Standard attenuation corrections are at best very approximate remedies. Equation (2) simply rewrites Equation (1) using an empirically derived proportionality constant, and so applies in the same limit (although with significant additional uncertainties). Equation (3), which also applies to transparent galaxies, traces the emission from stars that live longer than those dominating the ionizing radiation. Equation (4), on the other hand, is valid only for opaque galaxies. It would thus be surprising if the four estimators agreed, even for galaxies with perfect measurements of , , and .
To compare the star formation rates obtained using these different estimators, we first estimate the total FIR luminosity for the 149 galaxies in our restricted SAPM sample with IRAS flux densities at 60 and 100 m. We adopt the following standard procedure (see for example Meurer et al. 1999). We first calculate the quantity erg cm-2s-1 defined by Helou et al. (1988) and then compute the total far-infrared flux from and using the relation appropriate for dust with a single temperature and an emissivity proportional to frequency . This prescription has been shown work well for starburst galaxies (see Fig. 2 of Meurer et al. 1999). It is expected to a good approximation for all galaxies in which the infrared emission peaks at wavelengths between m and m (Helou et al. 1988). The uncertainties that arise from the conversion of IRAS fluxes to total FIR flux are likely to be modest in comparison to the uncertainties in the conversion from to star formation rate.
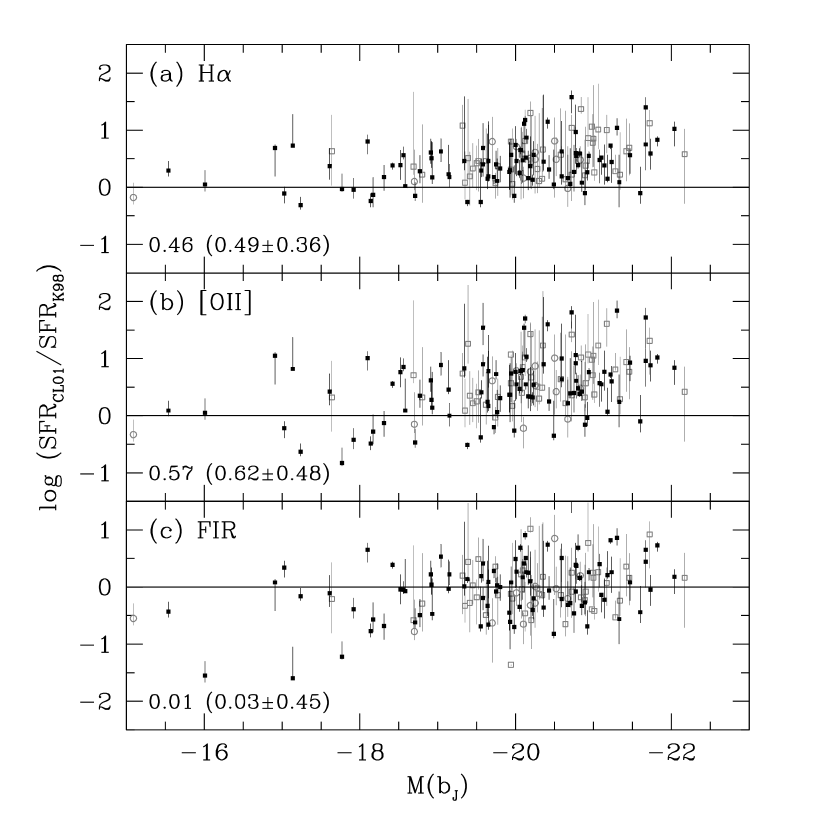
Fig. 1 shows the logarithmic difference between , and for the 149 SAPM galaxies in this sample as a function of absolute rest-frame magnitude. In each panel, we indicate the median offset for galaxies with (representing 80 per cent of the sample), along with the associated mean offset and the rms scatter (in parentheses). For both H and [O ii], we have included the ‘recommended’ mean attenuation correction mag. As expected, the three estimators yield inconsistent results.
Fig. 1a is consistent with the recent result by Jansen, Franx & Fabricant (2001; see also Carter et al. 2001) that bright galaxies tend to have lower [O ii]/H ratios than less luminous galaxies. We find that, for , [O ii]-derived SFR estimates are typically 40 per cent smaller than H-derived ones, while at fainter magnitudes, the two estimators give similar results. At fixed magnitude, the rms scatter in / is a factor of , although discrepancies between H- and [O ii]-derived SFR estimates can reach a factor of 7. The scatter in this plot and the weak trend with magnitude can probably be explained by variations in the effective gas parameters (ionization, metallicity, dust content) of the galaxies. We note that corresponds to the mean magnitude of the galaxies which K98 used to calibrate [O ii] as a SFR estimator.
The differences between the SFRs estimated using optical lines and those estimated using the total FIR luminosity are much more severe. Figs. 1b–1c show that H- and [O ii]-derived SFR estimates are typically a factor of lower than FIR-derived ones, even though we have applied an attenuation of 1 mag at H to the data. We note that, as discussed above, the K98 formula given in Equation (4) may well underestimate the true star formation rate in normal star-forming galaxies. As we shall see in Section 5, the discrepancy in Figs. 1b–1c is likely to arise from the conversion of optical emission-line luminosities into star formation rates.
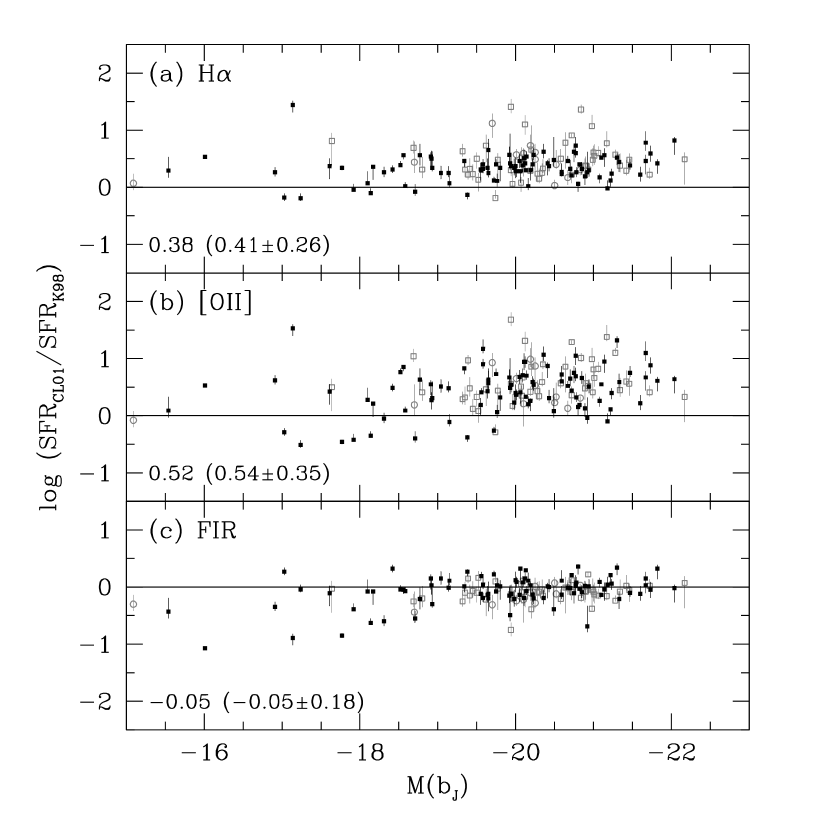
Ultraviolet luminosities are not available for the SAPM galaxies. To compare and to the star formation rates derived using UV luminosities, we have analyzed 37 UV-selected, normal star-forming galaxies from the sample of Bell & Kennicutt (2001) and 18 UV-selected starburst galaxies from the sample of Meurer et al. (1999). We selected in the original samples all the galaxies with H, UV and IRAS m and m fluxes. The published restframe UV fluxes correspond to the mean flux density over a passband with a central wavelength of Å and a width of a few hundred angstrom.
Fig. 2 shows the logarithmic difference between , and for the galaxies in these samples as a function of absolute rest-frame magnitude. For consistency, the H-derived SFRs in Fig. 2a are not corrected for the attenuation of H photons by dust. Starburst galaxies follow roughly the same trends as normal star-forming galaxies in these diagrams, although they have somewhat lower UV-derived SFRs at fixed -band magnitude. This may be explained if UV photons are more strongly attenuated by dust in starburst galaxies, or if long-lived stars with ages –yr contribute a larger fraction of the UV-luminosity in normal star-forming galaxies. Fig. 2b is also consistent with an increase of attenuation by dust with increasing luminosity in nearby starburst galaxies (e.g. Heckman et al. 1998). Overall, the similarity between the properties of starburst and normal star-forming galaxies in Fig. 2 suggests that the starbursts do not strongly influence the global ISM parameters of galaxies.
The median difference between the UV- and H-derived SFRs, both uncorrected for dust, is small, i.e. less than a factor of 2. This was already noted by Bell & Kennicutt (2001) for their sample. This means that even though the overall attenuation by dust can be large (as Fig. 2b demonstrates), it is similar for H and ultraviolet photons. Ultraviolet photons are expected to be more attenuated than H photons for a normal extinction curve. On the other hand, the stars dominating the H emission are more obscured than those dominating the UV emission, because they have lifetimes (yr) shorter than the typical timescale for the dispersal of clouds in which they form [the dispersal timescale of giant molecular clouds in the Milky Way is estimated to be about yr; Blitz & Shu (1980)]. Similar results are found for nearby starburst galaxies, where the attenuation inferred from the H/H ratio is typically higher than that inferred from the ultraviolet and optical spectral continuum (e.g., Fanelli, O’Connell & Thuan 1988; Calzetti, Kinney & Storchi-Bergmann 1994; Calzetti 1997; Poggianti et al. 1999; see Charlot & Fall 2000). In summary, our results show that even when the attenuation is strong, the ratio of the emergent ultraviolet to H luminosities can be close to that in the dust-free case, leading to small apparent discrepancies between the uncorrected UV- and H-derived SFRs.
4 The Charlot & Longhetti Model
In the previous section, we investigated a number of standard SFR estimators based on the H, [O ii], UV and FIR luminosities of galaxies. The different estimators give inconsistent results. These results highlight the need for a physically realistic model to interpret the combined signatures of stars, gas, and dust in the integrated spectra of galaxies. Such a model was recently developed by Charlot & Longhetti (2001; hereafter CL01).
4.1 Description of the model
The CL01 model is based on a combination of the latest version of the Bruzual & Charlot (1993) population synthesis code and the Ferland (1996, version C90.04) photoionization code. Stars are assumed to form in interstellar ‘birth clouds’ (i.e. giant molecular clouds). After yr, young stars are assumed to disrupt their birth clouds and migrate into the ‘ambient ISM’. The line emission from a galaxy arises both from the H ii regions surrounding young stars and from the diffuse gas ionized by photons that have leaked into the ambient ISM. In the CL01 model, these different gas components are combined and are described in terms of ‘effective’ gas parameters. This is motivated by the fact that the optical-line ratios in the integrated spectra of nearby spiral galaxies are similar to those in the spectra of individual H ii regions (Kobulnicky et al. 1999; see CL01 for more detail). The spectral evolution of a galaxy is obtained by convolving the spectral evolution of a single stellar generation with the SFR function. Only stars younger than about yr contribute significantly to the line emission.
The main adjustable parameters that affect the emission from the stars in a galaxy are the IMF, the SFR and the stellar metallicity . The main parameters affecting the emission from the photoionized gas are the effective interstellar metallicity , the zero-age effective ionization parameter , the effective dust-to-heavy element ratio and the effective gas density . , which was originally called ‘effective gas metallicity’ in CL01, includes all the heavy elements in the gas and solid (i.e. dust) phases. It is taken to be the same as the metallicity of the ionizing stars, i.e. . describes the typical ionization state of photoionized gas in the galaxy. is defined as the mass fraction of heavy elements locked into dust grains in the ionized gas. The other main parameter of the model is the age of the galaxy . In all models, we adopt a Salpeter IMF truncated at 0.1 and 100 and we fix cm-3, a value that is typical of the gas density in Galactic and extragalactic H ii regions. Changes in have a minor effect on the conversion between line luminosities and SFR (see CL01). CL01 calibrated the emission-line properties of their model using the observed [O iii]/H, [O ii]/[O iii], [S ii]/H and [N ii]/[S ii] ratios of a representative sample of 92 nearby spiral and irregular, starburst and H ii galaxies.
The CL01 model also includes the prescription for the absorption of photons from H ii regions and from older stars that was introduced by Charlot & Fall (2000). In this prescription, line and continuum photons are attenuated differently because of the finite lifetimes of the stellar birth clouds. The effective absorption curve is given by the following formula222In Charlot & Fall (2000), is used to denote the total effective -band optical depth, i.e. the sum of the effective optical depths in the H ii regions, the surrounding H i regions of the birth clouds and the ambient ISM (). In the CL01 model, the absorption in the H ii regions is computed by the photoionization code, and the Charlot & Fall (2000) model is used with to compute the subsequent absorption in the surrounding H i regions of the birth clouds and the ambient ISM. Thus, in CL01 and here, represents the effective -band optical depth in the ‘neutral’ ISM, i.e. .
| (5) |
where is the age of any single stellar generation. The wavelength dependence of the effective absorption curve is constrained by the observed relation between the ratio of FIR to UV luminosities and the UV spectral slope for starburst galaxies. The age yr corresponds to the typical lifetime of a stellar birth cloud (i.e. giant molecular cloud). The adjustable parameter defines the fraction of the total dust absorption optical depth of the galaxy contributed by the ambient ISM. Charlot & Fall (2000) showed that is needed to reproduce the observed mean relation between H/H ratio and ultraviolet spectral slope (defined near 1600 Å) for starburst galaxies. The scatter in the relation is reproduced if ranges from values of (i.e., all the radiation from the H ii regions leaks into the ambient ISM) to in different galaxies. In this prescription, the attenuation of the H line radiation, which is produced by stars younger than yr, can be expressed simply as (). The attenuation of the 5500 Å continuum radiation, which is produced by stars both younger and older than yr, depends on the star formation history.
The different parameters of the CL01 model each have a specific influence on the various line and continuum spectral features of galaxies. This allows one to derive ‘physical’ quantities such as star formation rates, gas-phase oxygen abundances and effective dust absorption optical depths from the optical spectra. The constraints will be more accurate if more spectral features are available.
4.2 Application to the SAPM survey
For the SAPM galaxies, the spectral features available to constrain physical quantities are the fluxes and equivalent widths of H, [O ii], and one or both of [N ii] and [S ii]. For a subset of the galaxies, the total FIR luminosity is also available. The parameters we wish to constrain are the following. For the gas, they are the interstellar metallicity, the ionization parameter, the dust-to-heavy element ratio, the effective dust absorption optical depth of the ‘neutral’ ISM (i.e. the birth clouds plus the ambient ISM), and the fraction of this contributed by the ambient ISM. For the stars, they are the age of the galaxy and the star formation history (see Table 1).
For the SAPM sample, the primary constraint on the interstellar metallicity comes from the [N ii]/[S ii] ratio, if both metal lines are available. If only one line is available, the metallicity will be set by [N ii]/H or by [S ii]/H. The [S ii]/H ratio also constrains the dust-to-heavy element ratio , and the [O ii]/[S ii] ratio constraints the ionization parameter . The effective absorption optical depth of the dust is constrained primarily by the [O ii]/H ratio. As can be seen, there are at most 3 independent line ratios available to constrain 4 gas parameters, so the resulting errors on some of these parameters will be large. The constraints on the effective dust absorption optical depth, for example, would be far tighter if the H/H ratio were available. In fact, for the subset of galaxies with far-infrared luminosities, the / ratio greatly improves the constraints on . The parameters and and the history of star formation SFR(t) are constrained only weakly by the measured equivalent widths of the various lines, the absolute magnitude and the 4000 Å break. This is why we do not show any results for the parameters pertaining to long-lived stars in this paper. The specific influence of the various parameters on observables allows one to construct ‘optimal’ estimators of the star formation rate, the gas-phase oxygen abundance and the dust absorption optical depth based on observed spectral features. This was the approach adopted by CL01 (their table 2).333We note that the CL01 model reproduces equation (1) to within a few percent if (i.e. in the case of a completely transparent galaxy), and if the effects of stellar H absorption are ignored. Equation (4) is recovered if . More accurate constraints and better estimates of the errors in the derived quantities may be obtained if the models are used to fit the spectral properties of each individual galaxy. This is the procedure we adopt in this paper.
Following CL01, we first select a set of models that span the full range of observed optical-line ratios, ultraviolet and far-infrared luminosities of nearby star-forming galaxies. The parameters of these models are listed in Table 1. They are the same as those listed in table 1 of CL01, except that we have now extended the ranges of metallicities and of effective dust absorption optical depths. We construct a grid of models by systematically varying the parameters listed in Table 1. In practice, this is done by interpolating from the coarse grid of models computed by CL01 (with extensions in and ). For each galaxy in our sample, we evaluate the goodness of fit of all the models in the grid. The SFR, O/H and of the mininum- model define our best estimates of the star formation rate, the gas-phase oxygen abundance and the effective optical depth of the dust in the galaxy. The maximum ranges in SFR, O/H and among the models within of the minimum provide estimates of the uncertainties in these quantities.
| Parameter | Range |
|---|---|
| – | |
| 0.2–4.0 | |
| 0.1–0.5 | |
| 0.01–4.0 | |
| 0.2–1.0 | |
| SFR | constant, exponentially declining |
| /yr | – |
5 Results
We now present the star formation rates, gas-phase oxygen abundances and dust absorption optical depths we derive for the SAPM sample using the CL01 model described in Section 4.
In Fig. 3, we present results for the 149 SAPM galaxies with fluxes and equivalent widths of H, [O ii], and one or both of [N ii] and [S ii], as well as IRAS 60 and 100 m fluxes. In this plot, we do not use the IRAS fluxes to constrain the SFRs. We compare the SFRs derived using all available optical lines with those derived from the H, [O ii] or FIR luminosities alone using the K98 formulae given in Equations (1), (2) and (4). The filled squares represent galaxies with measurements of all four optical lines, while the open circles and the open squares are galaxies for which H, [O ii], and either [N ii] or [S ii] were measured. The error bars indicate the uncertainties in the SFRs derived using the CL01 models, as discussed in Section 4.2. Once again we have applied a standard attenuation mag to the SFRs estimated using the K98 formulae for H and [O ii].
We find that the SFRs derived using H are lower than those obtained using the CL01 model. The median discrepancy tends to increase with absolute luminosity and amounts to a factor of at (Fig. 3a). The discrepancy is similar, but the scatter is larger for the SFRs derived using [O ii] (Fig. 3b). Interestingly, the CL01 SFRs are in much better agreement with those derived from the FIR luminosities, even though we did not use these measurements to constrain the models (Fig. 3c).
Fig. 4 shows what happens if we add the requirement that models reproduce the observed FIR luminosities of the galaxies. The uncertainties are much smaller in this case because fewer models fit the data. The median error on the SFR decreases from a factor of in Fig. 3 to a factor of in Fig. 4. The SFRs derived using the CL01 model now agree surprisingly well with those derived using the K98 FIR-luminosity estimator, with a scatter of only 50 per cent.
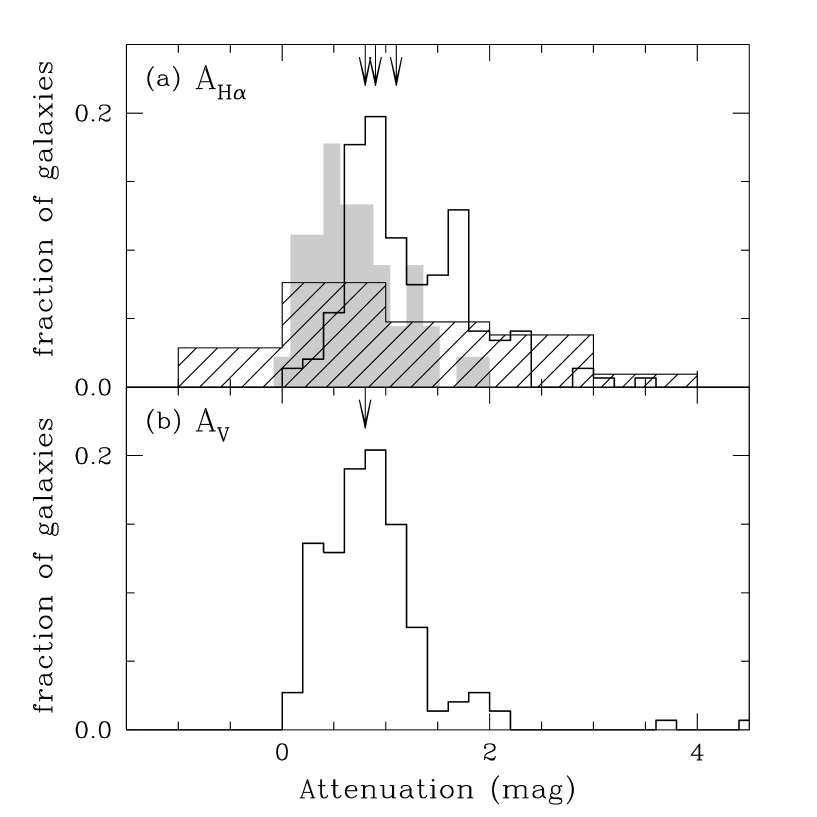
Why are the CL01 SFR estimates so different from the SFRs derived using the K98 H formula plus a standard attenuation correction of mag? Why are they so similar to those derived using the K98 FIR-luminosity formula for optically thick starburst galaxies? The distribution of H attenuations that we derive for the SAPM galaxies is similar to that found in other samples of nearby star-forming galaxies. To illustrate this, Fig. 5a compares the distribution of with those derived by Sullivan et al. (2000) and Bell & Kennicutt (2001) using H, H and thermal radio continuum observations of nearby, UV-selected star-forming galaxies [we have converted from figure 1 of Sullivan et al. (2000) into , consistent with the recipe these authors used in the first place to compute based on the H/H ratio]. The median H attenuation in our sample, , is only slightly larger than those of the Sullivan et al. (0.8) and Bell & Kennicutt (0.9) UV-selected samples.
It is important to distinguish here between H and -band attenuation. Although most galaxies in our sample are optically thick at H, they are generally not in the band. This is because the -band continuum emission is dominated by stars that live longer, and hence, that are less obscured, than those dominating the H line emission (Section 4.1). Fig. 5b shows the distribution of -band attenuations for our sample. This has a median . The results of Fig. 4c then suggest that dust heating by long-lived stars roughly compensates the relatively low dust optical depths of the galaxies, in such a way that the ratio of FIR luminosity to SFR is similar to that predicted by the K98 formula for optically thick starburst galaxies.
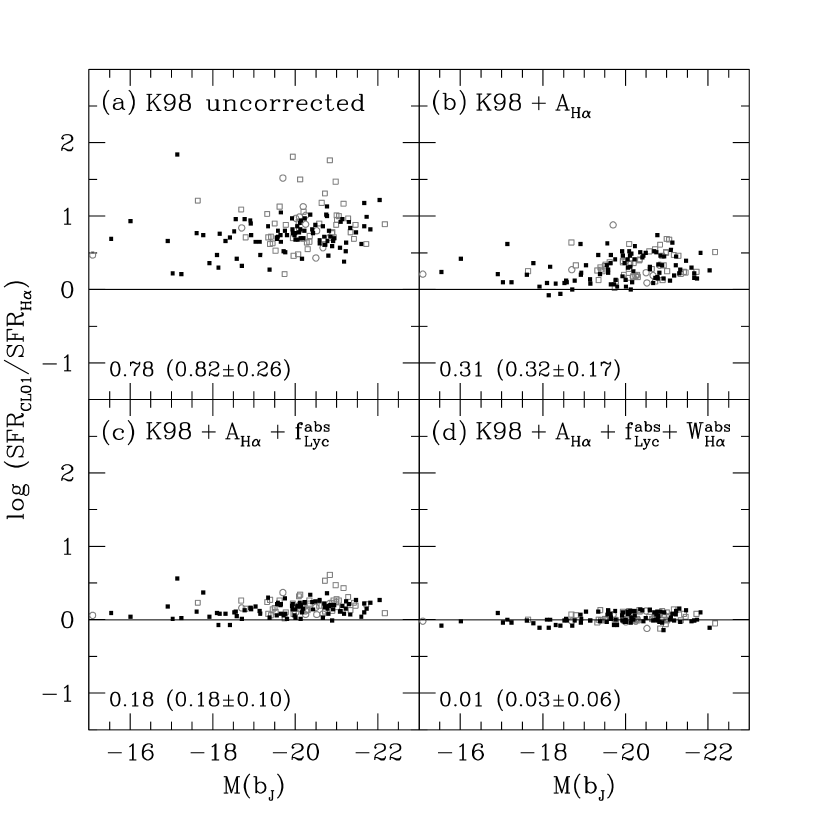
We now show that differences between the CL01 and the K98 H estimates of the SFR arise as a result not of one, but of several simplifying approximations in the K98 formula. It is useful to step back and compare the CL01 SFRs with those derived from Equation (1), before applying any correction for H attenuation. This is shown in Fig. 6a. Rather than applying a standard attenuation correction of 1 mag, we now correct the H-derived SFRs of individual galaxies using our estimated attenuations shown in Fig. 5 above. As expected, this reduces the scatter in the diagram, but an offset of a factor of remains between the CL01 and K98 estimates (Fig. 6b). A similar discrepancy would presumably be found if attenuation were derived, for example, using the H/H ratio.
An effect that is included in the CL01 model, but not in the K98 formula, is the absorption of ionizing photons by dust inside H ii regions (Section 4.1 above). We find that, for the 149 galaxies in Fig. 6, the mean and rms scatter of the fraction of ionizing photons absorbed by dust correspond to per cent. This is constrained primarily by the [S ii]/H and [O ii]/[S ii] ratios of the galaxies, which control the dust-to-heavy element ratio and ionization parameter of the gas (Section 4.2 and CL01). For reference, Degioia-Eastwood (1992) finds per cent based on optical, far-infrared and radio observations of 6 H ii regions in the Large Magellanic Cloud. In Fig. 6c, we show the effect of correcting the H-derived SFRs of individual galaxies in Fig. 6b for the fraction of ionizing photons lost to dust. Both the scatter and the offset relative to the CL01 estimates of the SFR are reduced, but there remains an offset of a factor of .
Another effect that is included in the CL01 model, but ignored by the K98 formula, is the contamination of H emission by stellar absorption. For the galaxies in Fig. 6, the mean and rms scatter of the equivalent width of H-Balmer absorption correspond to Å. This compares well with the rough estimate by Kennicutt (1992b) of Å for a sample of 90 nearby spiral galaxies. The correction for stellar absorption is therefore quite important for galaxies with small observed H emission equivalent widths. This is shown in Fig. 6d, where we correct the H-derived SFRs of individual galaxies in Fig. 6c for stellar absorption. This additional correction brings the H-derived SFRs into agreement with the CL01 model. Some minor scatter remains ( per cent), mainly because the CL01 model also accounts for the decrease in the ionization rate for increasing stellar metallicity (stars are assumed to have the same metallicity as the gas; see Section 4.1 above). The K98 prescription, on the other hand, assumes fixed solar metallicity. We conclude from Fig. 6, therefore, that the neglect of several important physical effects in the derivation of the K98 H SFR estimator leads to significant underestimates of the true rate of star formation occurring in typical galaxies.
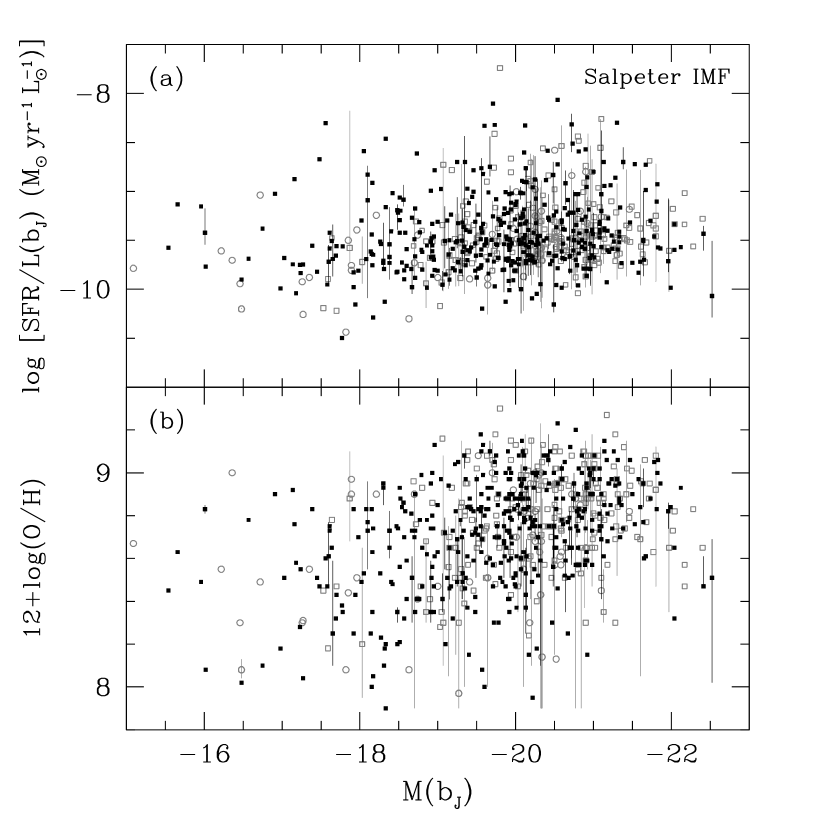
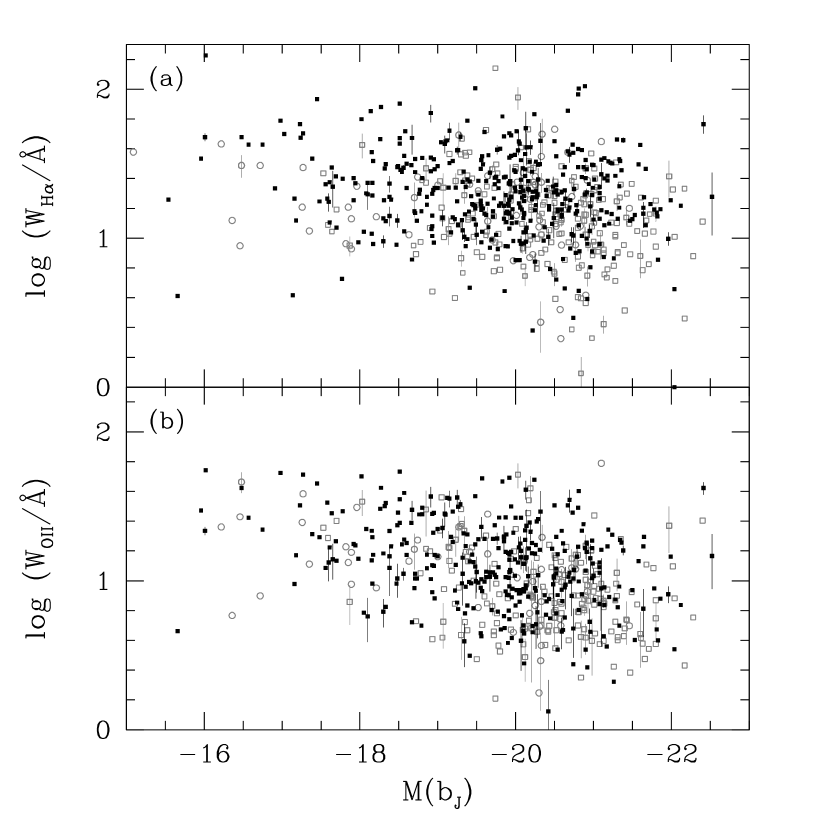
Fig. 7 presents the estimated SFRs and gas-phase oxygen abundances of the 705 SAPM galaxies with fluxes and equivalent widths of H, [O ii], and one or both of [N ii] and [S ii]. The SFR in Fig. 7a is plotted per unit luminosity. The median error in SFR/ is about 80 per cent, consistent with the results of Fig. 3. Unlike the H and [O ii] equivalent widths (Fig. 8), the quantity SFR/ exhibits no dependence on galaxy absolute luminosity. Many previous studies have noted that galaxies with strong H or [O ii] equivalent widths dominate the faint end of the galaxy luminosity function (e.g., Zucca et al 1997; Loveday, Tresse & Maddox 1999; Bromley et al 1998; Blanton & Lin 2000; Christlein 2000; Balogh et al. 2001). Our results show that this effect must arise in part because the emission lines in low-luminosity galaxies are less attenuated by dust, rather than because faint emission-line galaxies form stars at higher relative rates than their more luminous counterparts. The gas-phase oxygen abundances of the galaxies in our sample increase from at to (i.e. solar abundance) at , indicating that more luminous galaxies are more metal-rich, although with a large scatter. This is agreement with other studies of trends in galaxy metallicity from observations of H ii regions in nearby star-forming systems (e.g. Zaritsky, Kennicutt & Huchra 1994).
6 Summary and Discussion
We have compared a number of different methods for estimating the star formation rates of galaxies using a variety of spectral indicators. Our primary sample is drawn from the Stromlo-APM redshift survey and consists of 149 galaxies with fluxes and equivalent widths of H, [O ii], and one or both of [N ii] and [S ii], as well as IRAS 60 and 100 m fluxes.
We first compared the star formation rates obtained using standard estimators based on the H, [O ii] and FIR luminosities of the galaxies. These estimators were derived in inconsistent limits using incomplete models of the reprocessing of radiation from young stars, but they have, nevertheless, been used by many authors to study star formation as a function of galaxy luminosity, morphological type, environment and redshift. Not surprisingly, the three estimators give discrepant results. The star formation rates estimated using the far-IR fluxes are a factor of higher than those estimated using H or [O ii], even after the usual mean attenuation correction of mag is applied to the data.
We then derived star formation rates for the same galaxies using estimators constructed from new models developed by CL01, which include a physically consistent treatment of the effects of stars, gas and dust. The CL01 star formation rates agree much better with those derived from the FIR fluxes than with those derived from the H or [O ii] fluxes. We showed that the discrepancy between the CL01 and H estimates of star formation arises primarily because the standard H estimator does not include the absorption of ionizing photons by dust in H ii regions and the contamination of H emission by stellar absorption. The strengths of these two effects as estimated by the models are in good agreement with independent observations of normal, nearby star-forming galaxies. The agreement with the FIR estimates is at least in part a fluke; in this case the two major deviations from the assumed opaque-starburst limit have opposite sign and approximately cancel for our SAPM sample.
Our results have important implications for estimates of the total integrated star formation density and its evolution with redshift (Madau et al 1996). Most estimates of star formation rate densities at low redshift are based on H measurements (Gallego et al. 1995; Tresse & Maddox 1998). If these studies underestimate the total amount of star formation in the local Universe by factors of , the resulting increase of the SFR density to high redshifts, which is generally inferred using different estimators, could be considerably less than commonly believed (see also Cowie, Songaila & Barger 1999). We plan to investigate this in more detail in a future paper.
Finally, we have applied the CL01 models to 705 SAPM galaxies with fluxes and equivalent widths of H, [O ii], and one or both of [N ii] and [S ii] to study trends in star formation rate and in metallicity as a function of galaxy absolute magnitude. For this sample, we find that the star formation rate per unit luminosity is independent of absolute magnitude. The gas-phase oxygen abundance does increase with galaxy absolute luminosity, although the scatter in metallicity at fixed magnitude is large. We find that luminous galaxies have abundances close to solar on average.
We note that the star formation rate and metallicity estimates derived using the CL01 models are based on emission-line ratios. In order to obtain reliable estimates of these quantities, it is critical that the spectra be accurately flux-calibrated. The large wavelength coverage and the expected spectro-photometric accuracy of the galaxy spectra in the Sloan Digital Sky Survey (York et al 2000) and the Two Degree Field survey (Folkes et al 1999) are ideally suited to this kind of analysis. These surveys include measurements of key emission lines not available for the SAPM (e.g. [O iii] and H), which will greatly strengthen the constraints on the effective ionization parameter and the effective dust absorption optical depth, even for galaxies that do not have measured far-infrared fluxes. In addition, it will be possible to test the CL01 models in detail using the additional spectral information.
In summary, both the models and the data are now available that will allow detailed quantitative studies of the physical properties of galaxies as a function of luminosity, type and environment. This can only lead to an improved understanding of the processes that were important in the formation of the galaxies we see today.
Acknowledgments
We thank R. Genzel and R. Kennicutt for valuable discussions that helped shape this work. We also thank C. Singleton for making his data available before publication.
References
- [1] Baldi, A., Bardelli, S., Zucca, E., 2001, MNRAS, in press (astro-ph/0101416)
- [2] Balogh, M.L., Schade, D., Morris, S.L., Yee, H.K.C., Carlberg, R.G., Ellingson, E., 1998, ApJ, 504, L75
- [3] Balogh, M.L., Christlein, D., Zabludoff, A., Zaritsky, D., 2001, ApJ, in press (astro-ph/0104042)
- [4] Barton, E., Geller, M.J., Kenyon, S.J., 2000, ApJ, 530, 660
- [5] Bell, E.F., Kennicutt, R.C., 2001, ApJ, 548, 681
- [6] Blanton, M. , Lin, H., 2000, ApJ, 543, L125
- [7] Blitz, L. , Shu, F. H., 1980, ApJ, 238, 148
- [8] Bromley, B.C., Press, W.H., Lin, H., Kishner, R.P., 1998, ApJ, 505, 25
- [9] Bruzual A. G., Charlot S., 1993, ApJ, 405, 538
- [10] Buat V., Xu C., 1996, A&A, 306, 61
- [11] Calzetti D., 1997, AJ, 113, 162
- [12] Calzetti D., Kinney A. L., Storchi-Bergmann T., 1994, ApJ, 429, 582
- [13] Carter, B. J., Fabricant, D. G., Geller, M. J., Kurtz, M. J. 2001, AJ, in press (astro-ph/0107258)
- [14] Charlot S., Fall S. M., 2000, ApJ, 539, 718
- [15] Charlot S., Longhetti, M., 2001, MNRAS, 323, 887
- [16] Christlein, D., 2000, ApJ, 545, 145
- [17] Cowie, L.L., Songaila, A., Hu, E.M., Cohen, J.G., 1996, AJ, 112, 839
- [18] Cowie, L.L., Songaila, A., Barger, A.J., 1999, AJ, 118, 603
- [19] Degioia-Eastwood, K., 1992, ApJ, 397, 542
- [20] Edmunds, M. G., Pagel, B. E. J. 1984, MNRAS, 211, 507
- [21] Ellis, R.S., Colless, M., Broadhurst, T., Heyl, J., Glazebrook, K., 1996, MNRAS, 280, 235
- [22] Fanelli M. N., O’Connell R. W., Thuan T. X., 1988, ApJ, 334, 665
- [23] Ferguson A. M. N., Wyse R. F. G, Gallagher J. S., Hunter D. A., 1996, AJ 111, 2265
- [24] Ferland G., 1996, Hazy, A Brief Introduction to Cloudy. Internal Report, Univ. Kentucky, USA
- [25] Folkes, S., Ronen, S., Price, I., Lahav, O., Colless, M., Maddox, S., Deeley, K., Glazebrook, K. et al, 1999, MNRAS, 308, 459
- [26] Gallagher J. S., Hunter D. A., Bushouse H., 1989, AJ, 97, 700
- [27] Gallego, J., Zamorano, J., Aragon-Salamanca, A., Rego, M., 1995, ApJ, 455, L1
- [28] Hammer, F., Flores, H., Lilly, S.J., Crampton, D., Le Fevre, O., Rola, C., Mallen-Ornelas, G., Schade, D., Tresse,L., 1997, ApJ, 481, 49
- [29] Hashimoto, Y., Oemler. A., Lin, H., Tucker, D.L., 1998, ApJ, 499, 589
- [30] Jansen R. A., Franx M., Fabricant D., 2001, ApJ, in press (astro-ph/0012485)
- [31] Heckman, T. M., Robert, C., Leitherer, C., Garnett, D. R., van der Rydt, F. 1998, ApJ, 503, 646
- [32] Helou, G., Khan, I.R., Malek, L., Boehmer, L., 1988, ApJS, 68, 151
- [33] Hoopes C. G., Walterbos R. A. M., Greenwalt B. E., 1996, AJ, 112, 1429
- [34] Hunter D. A., Gallagher J. S, 1990, ApJ, 362, 480
- [35] Kennicutt R. C., 1983a, ApJ, 272, 54
- [36] Kennicutt R. C., 1983b, A&A, 120, 219
- [37] Kennicutt R. C., 1984, ApJ, 287, 116
- [38] Kennicutt R. C., 1992a, ApJS, 79, 255
- [39] Kennicutt R. C., 1992b, ApJ, 388, 310
- [40] Kennicutt R. C., 1998, ARA&A, 36, 189
- [41] Kennicutt R. C., Tamblyn P., Congdon C. E., 1994, ApJ, 435, 22
- [42] Kobulnicky H. A., Kennicutt, R.C., Pizagno J.L. 1999, ApJ, 514, 544
- [43] Kochanek, C. S., Pahre, M. A., Falco, E. E. 2001, ApJ, submitted (astro-ph/0011458)
- [44] Leitherer C., Heckman T. M., 1995, ApJS, 96, 9
- [45] Loveday J., Peterson B. A., Maddox S. J., Efstathiou G., 1996, ApJS, 107, 201
- [46] Loveday. J., Tresse, L., Maddox, S. J. 1999, MNRAS, 310, 281
- [47] Madau, P., Ferguson, H.C., Dickinson, M.E., Giavalisco, M., Steidel, C.C., Fruchter, A., 1996, MNRAS, 283, 1388
- [48] Martin C. L., 1997, ApJ, 491, 561
- [49] Mathis S. J., 1986, PASP, 98, 995
- [50] Meurer G. R., Heckman T. M. Calzetti D., 1999, ApJ, 521, 64
- [51] Misiriotis, A., Popescu, C.C., Tuffs, R., Kylafis, N.D., 2001, A&A, in press (astro-ph/0104346)
- [52] Niklas, S., Klein, U., Wielebinski, R., 1997, A&A, 322, 19
- [53] Peterson B. A., Ellis R. S., Efstathiou G., Shanks T., Bean A. J., Fong R., Zen-Long Z., 1986, MNRAS, 221, 233
- [54] Petrosian, V., Silk, J., Field, G. B. 1972, ApJ, 117, L69
- [55] Poggianti, B. M., Smail, I., Dressler, A., Couch, W. J., Barger, A. J., Butcher, H., Ellis, R. S., Oemler, A. 1999, ApJ, 518, 576
- [56] Singleton C., 2001, PhD thesis, Univ. of Nottingham
- [57] Sullivan, M., Treyer, M. A., Ellis, R. S., Bridges, T. J., Milliard, B., Donas, J., 2000, MNRAS, 312, 442
- [58] Spitzer L., 1978, Physical Processes in the Interstellar Medium. Wiley, New York, p. 333
- [59] Tresse L., Maddox S.J., 1998, 495, 691
- [60] Tresse L., Maddox S.J., Loveday J., Singleton C., 1999, MNRAS, 310, 262
- [61] York, D.G., Adelman, J., Anderson J.E., Anderson, S.F., Annis, J., Bahcall, N.A., Bakken, J.A., Barkhouser, R. et al, 2000, AJ, 120, 1579
- [62] Zaritsky, D., Kennicutt, R. C., Huchra, J. P. 1994, ApJ, 420, 87
- [63] Zucca, E., Zamorani, G., Vettolani, G, Cappi, A., Merighi, R., Mignoli, M., Stirpe, G.M., MacGillivray, H. et al., 1997, A&A, 326, 477