Intraday Variability in Northern Hemisphere Radio Sources
Abstract
We summarize results from flux density monitoring campaigns performed with the 100 m radio-telescope at Effelsberg and the VLA during the past 15 yrs. We briefly discuss some of the statistical properties from now more than 40 high declination sources (), which show Intraday Variability (IDV). In general, IDV is more pronounced for sources with flat radio spectra and compact VLBI structures. For 0917+62, we present new VLBI images, which suggest that the variability pattern is modified by the occurrence of new jet components. For 0716+71, we show the first detection of IDV at millimeter wavelengths (32 GHz). For the physical interpretation of the IDV phenomenon, a complex source and frequency dependent superposition of interstellar scintillation and source intrinsic variability should be considered.
1 Max-Planck-Institut für Radioastronomie, Auf dem Hügel 69, 53121 Bonn, Germany
e-mail: tkrichbaum@mpifr-bonn.mpg.de
Keywords:
quasars: general, quasars: individual (0716+71, 0917+62,
0954+65), radio continuum: ISM, scattering
1 Statistical Properties of IDV


A large fraction (about 20-30 %) of compact flat spectrum radio sources, mostly identified as Blazars (Quasars, BL Lac objects, etc.), show flux density and polarization variations on timescales of a few hours to a few days. These so called Intraday Variable (IDV) radio sources (see review of Wagner & Witzel, 1995 (WW95)) are defined via their structure function (SF), exhibiting pronounced maxima within time lags of days (‘type II’ sources; cf. Heeschen et al. 1987). The Fourier analysis of the IDV timescales shows in nearly all type II sources a quasi-periodic variability pattern, i.e. a concentration of the power (in a cleaned power spectrum) to a few () discrete timescales. In contrast, the so called ‘type I’ IDV sources vary slower, showing a quite monotonically increasing SF within the time of the observations, suggesting variability timescales of days. Although a day timescale seems to be common for the classical ‘type II’ IDV sources, ‘sudden’ changes of the variability timescales are observed eg. in 0716+71, which changed from quasi-periodic daily to less periodic weekly oscillations (cf. Qian 1995, WW95, Kraus et al. 2001). Extremely rapid ( days) and pronounced variations like the ones recently observed in PKS 0405-38 (Kedziora-Chudczer et al. 1997) or J1819+38 (Dennett-Thorpe & de Bruyn 2000) are not observed in our high declination sample. The fastest variation observed so far by us, also show variations on a 1 hr timescale, however with an amplitude of only 2 % (in 0716+71 at 5 GHz in April 1993). At the moment it is not clear, if J1819+38 or PKS 0405-38 should be classified as ‘type II’ IDV’s, or if it would be better to define another class of more extreme IDV sources, which would imply that it is at present unclear whether the physical process causing such extreme variability is the same as for the ‘classical’ IDV sources.

In the radio bands and for classical IDV’s, the peak-to-peak variations of the flux densities can reach up to % (eg. for 0804+49, 0917+62), more typically, however, are a few percent. In polarization, the variations are more pronounced ( %) and are about a factor of two faster than in total intensity. The variations in total (I) and polarized (P) flux density appear often either correlated (eg. in 0716+71) or anti-correlated (eg. in 0917+62). However transitions from correlated to anti-correlated variability are observed occasionally. Correlated with the variations in P, the polarization angle (PA) varies on the same timescale by typically a few to a few ten degrees (Kraus et al. 2001). Sometimes, polarization angle swings by are observed within hours (0917+62: Quirrenbach et al. 1989; 1150+81: Kochenov & Gabuzda, 1999). A direct conclusion drawn from the polarization IDV is a multiple component structure of the radio sources, with their sub-components being of different compactness and polarization. Although this is in good agreement with the observational findings from polarization VLBI (cf. Gabuzda et al., this conference), the short variability timescales indicate component sizes much smaller than the angular resolution of present day ground and space-based VLBI ( mas).
2 Intrinsic or Extrinsic ?
In Figure 1 (top), we plot the frequency dependence of the variability index (defined by (left) and (right), and are the rms amplitudes) for a small sample of sources observed with the VLA and the 100 m telescope at 5 frequencies (1.5 – 15 GHz). The observing interval and data sampling restrict the detection of characteristic variability timescales to days (5 days of data). Still, we use the rms-fluctuation index to illustrate the strength of variability at each frequency for these timescales. We note that for the given (limited) observing interval, might be only a coarse estimate of the actual variability pattern, particularly in view of the likely mixture of stochastical variations and variations on discrete times scales. A more detailed structure function analysis is beyond the scope of this paper and should be done in the future. Nevertheless, it is obvious that in polarization, the variability index for most sources peaks somewhere between 1.5 and 5 GHz, in contrast to the variations in total intensity, where the situation is more complicated. When looking at the change of the frequency dependence of the variability index with time in Figure 1 (bottom), it is seen that at least two types of variability exist: in 0716+71 the variability index peaks for most observing dates between 3-5 GHz, whereas in 0954+65 a clear minimum of appears in this frequency range. Above 8 GHz and in both sources the variability index increases with frequency!
The theory of interstellar scintillation (ISS) predicts most pronounced variations close to a critical frequency , where strong scattering changes into weak scattering. From Figure 1 it appears, as if this transition frequency is different for each source and also changes for a given source with time (since the data base is still small, this effect should be investigated in more detail). Also the strength of variability at seems to be time dependent. An increase of towards higher frequencies or a ‘double peaked’ appearance of is inconsistent with simple models of ISS, unless a source intrinsic contribution, with increasing dominance towards higher frequency, is assumed.
A stratified (multiple layer) or otherwise more inhomogeneous interstellar medium may also help to explain the complexity seen in Figure 1. As we will show in a moment, this has the potential to explain changes of with viewing direction (through our galaxy) and the occurrence of more than one characteristic variability timescale observed in a few sources (eg. 0716+71, 0917+62), but not the observed ‘sudden’ transitions between them111This should be not confused with the annual modulation of due to the Earth’s orbital motion (see Fuhrmann et al., this conference; and Rickett et al. 2001).. For refractive ISS (RISS), the variability timescale is , where scattering size, distance to scatterer, relative velocity of scatterer. Rapid changes of therefore imply similar rapid changes of at least one of the three parameters in this equation. This could perhaps indicate a very clumpy ISM, eg. with sharp edges of quite fast moving clouds at different distances. We however think, that this is not very likely. If on the other hand, the source size is of order of (‘quenched’ scattering), a ‘sudden’ ( 1 day) change of the characteristic variability timescale implies a similar ‘sudden’ change of the source size (). This, however, is nothing else but rapid intrinsic variability.
Thus, variability amplitudes increasing monotonically with frequency (from radio, infrared to optical (cf. 2007+77, Peng et al. 2000) and even to X- and Gamma-rays (0716+71, Wagner et al. 1996)), and the sudden transitions of IDV timescales, could also be regarded as sign for source intrinsic variations, which at least in the case of 0716+71 and 0954+65 appear not unlikely in view of the observed broad-band radio-optical correlations (Quirrenbach et al., 1991, Wagner et al. 1993, WW95). The recent finding of IDV in 0716+71 at 9 mm wavelengths (Fig. 2) strongly supports this view. At such short wavelength and high galactic latitude (), the interpretation of IDV as due to scintillation would appear more questionable. More evidence for the idea that IDV at cm-wavelengths is most likely a mixture of propagation and source intrinsic effects, also comes from a multi-frequency analysis of correlated I & P variations in 0917+62, in which correlated and anti-correlated I & P variability peaks were found at 20 and 6 cm (Qian et al. 2001). Owing to the frequency dependence of scattering and the fact that for a point source I & P should vary simultaneously, the correlated peaks were interpreted by ISS, resulting in reasonable parameters for the ISM and the source. However, also an anti-correlated I & P peak was seen in the same light curve, which – despite a multiple polarized component structure assumed for the source – did not at all fit into the standard scattering model used by Qian et al.. Since also the polarization angle variations could not be fitted within this scattering model (adding even more structure components or changing the ISM doesn’t help), the conclusion must be that (i) either the present ISS model isn’t yet developed enough to explain the polarization angle variations, or (ii) the IDV variations are a mixture of extrinsic and intrinsic effects, which only mutually can explain the observed radio light-curves.
3 VLBI observations of IDV’s
The extreme apparent brightness temperatures ( K) deduced from the light travel time argument require, in this source-intrinsic interpretation of IDV, relativistic Doppler-boosting factors . Recently, several authors claimed to have seen faster than previously known superluminal motion with speeds of up to c (Jorstad et al. 2001, adopting km s-1 Mpc-1, , ). In 0235+164, a Lorentz-factor of is likely (Qian et al. 2000, Romero et al. 2000). Therefore apparent brightness temperatures of up to a few times K could in principle be reached with source intrinsic relativistic jet physics. Much higher brightness temperatures probably indicate the presence of scattering or, if intrinsic mechanisms are at work, an exponent of the Lorentz-transformation for the intrinsic brightness temperature larger than 3 ( with ), which could appear in non-spherical geometries (Qian et al. 1991 & 1996, Spada et al. 1999). Also other (coherent) radiation mechanisms are not yet ruled out (cf. Benford & Tzach, 2000, but see also D. Melrose, this proceeding).
Even if the basic process causing IDV is extrinsic, the typical properties of IDV are affected by source intrinsic variations. A dramatic change in the variability behaviour of 0917+62, which slowed down and nearly stopped to vary in September 1998, but resumed to be rapidly variable in February 1999 (Kraus et al. 1999), was recently interpreted as due to orbital motion of the Earth relative to the ISM (Rickett et al. 2001, Jauncey & Macquart, 2001). In order to test the suggested annual modulation of the IDV pattern, we continued to monitor the source with the 100 m RT at Effelsberg. The results are shown in L. Fuhrmann’s paper (this conference), who could not confirm the annual modulation scenario.
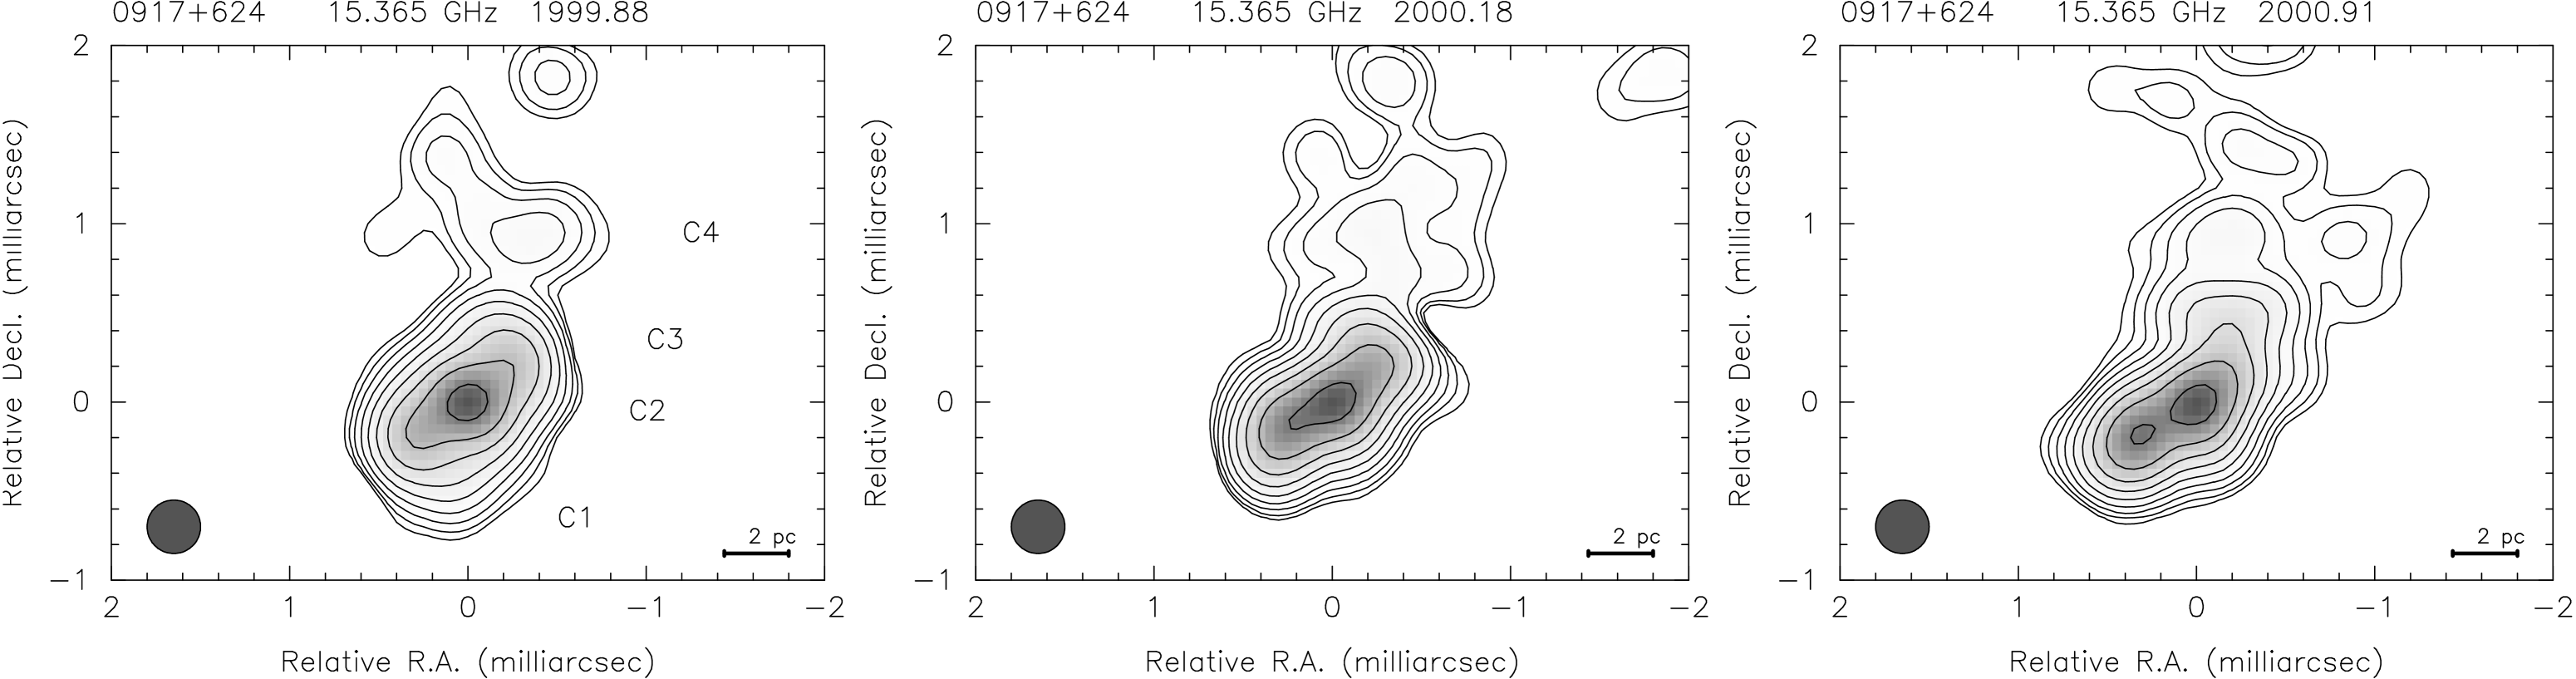
In Figure 3, we show some new VLBI maps of the bent milli-arcsecond jet of 0917+62 obtained at half year time sampling in 1999–2000. The flux density of the most compact VLBI component C1, the ‘VLBI core’ 222‘VLBI core’ is used in this context synonymous for the transition region at the jet base from optically thick to thin emission (–surface), or for the first visible shock near this base., is mJy (total flux: Jy). In order to explain the observed variability index of %, the core or its associated shock component has to vary with %. Such large amplitudes are only possible, if strong rather than weak scattering occurs.
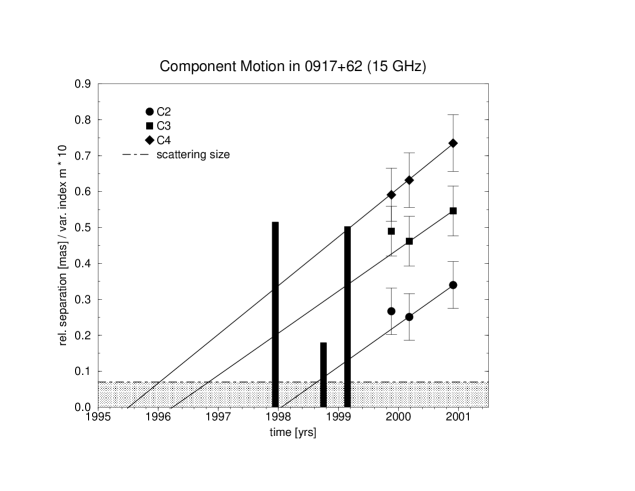
The 2 cm maps show component motion with . Back-extrapolation of the motion of the 3 inner jet components (C2, C3, C4, Fig. 3) to zero-separation from the stationary assumed VLBI core gives their ejection times (see Fig. 4). Component C2 was ejected in 1998.1, at a time when 0917+62 showed pronounced IDV. The variation of with time after ejection of C2 is indicated by thick bars in Figure 4. The low value of in September 1998 can be interpreted as due to ‘quenched’ scattering and source expansion: as long as the size of the core region (a blend of core C1 and moving secondary component C2) is larger than the scattering size, no IDV is observed. After a while, the secondary component (C2) moves further down the jet, expands and fades. The compact VLBI core becomes dominant again and the scintillation resumes.
In order to further test this idea, we searched for additional changes in the variability index of 0917+62, using IDV observations since 1988. One other particularly low value of % in April 1993 coincides nicely with an enhanced 2.8 cm flux density ( Jy excess) and a slightly increased size of the VLBI core at 1.3 cm at this time (Standke et al. 1996). This suggests that also in early 1993 a new jet component was born. Unfortunately we have no other high resolution VLBI data for the period 1993–1995 to test this idea.
4 Conclusion
We conclude that the physical interpretation of IntraDay Variability still poses problems, both to the source extrinsic (ISM) and source intrinsic (AGN related) scenarios. Most likely, the IDV observed in the radio regime is a quite complex mixture of both effects. The relative contribution of these two effects seem to depend on the properties of the ISM, the viewing direction, and the source size and internal sub-structure, which itself is frequency and time dependent. There is, however, hope that with multifrequency variability studies (in intensity and polarization, cf. Fig. 1) and simultaneous VLBI monitoring (cf. Fig. 4), the extrinsic and intrinsic contribution to IDV can be separated.
For 0917+62, we conclude that temporal variations of the source size, which are correlated with total flux density variations and the ejection of new VLBI components, are likely to modify the observed scintillation pattern of compact radio sources, depending on the ratio of actual source size and scattering size.
In many compact radio sources, new jet components (and flux density outbursts observed at high frequencies) appear quite regularly at one half to a few years time intervals. It is therefore possible to observe an annual modulation in the variability pattern (caused by orbital motion) only in those objects, which are quite inactive and whose nuclear sizes remain smaller than the scattering size for periods much longer than one year.
References
Benford, G., & Tzach, D., MN, 317, 497.
Dennett-Thorpe, J., & de Bruyn, A.G., 2000, ApJ, 525, 65.
Kochenov, P.Y., & Gabuzda, D.C., 1999, in: ‘BL Lac Phenomenon’, eds. L.O. Takalo & A. Sillanpaä, ASP Conf. Ser. Vol. 159, p. 460.
Heeschen, D.S., et al. 1987, AJ, 94, 1493.
Jorstad, S.G., et al. 2001, ApJS, 134, 181.
Kedziora-Chudczer, L.L., et al. 1997, ApJ, 490, L9.
Kraus, A. et al. 1999, AA, 352, 107.
Kraus, A., et al. 2001, AA, submitted.
Jauncey, D.L., Macquart, J.P., 2001, AA, 370, 9.
Peng, B., et al. 2000, AA, 353, 937.
Qian S.J., et al., 1996, in: ‘Energy Transport in Radio Galaxies and Quasars’, eds: P. Hardee et al., ASP Conf. Ser. Vol. 100, p. 55.
Qian, S.J., 1995, Chin. Astron. Astrophys. 19/1, p. 69.
Qian, S.J., et al. 2000, AA, 357, 84.
Qian, S.J., et al. 2001, AA, 367, 770.
Quirrenbach, A., et al. 1989, AA, 226, 1.
Quirrenbach, A., et al. 1991, AA, 372, 71.
Rickett, B.J., et al., 2001, ApJ, 550, 11.
Romero, G.E., Cellone, S.A., & Combi, J.A., 2000, AA, 360, 47.
Spada, M., Salvati, M., Pacini, F., 1999, ApJ, 511, 126.
Standke, K., et al., 1996, AA, 306, 27.
Wagner, S.J. et al., 1993, AA, 271, 344.
Wagner, S.J. et al., 1996, AJ, 111, 2187.
Wagner, S.J., & Witzel, A., 1995, ARA&A, 33, 163 (WW95).