H Flares from V404 Cyg in Quiescence
Abstract
We present a spectrophotometric study of short-term optical variability in the quiescent black hole X-ray transient V404 Cyg. This includes two nights of high time-resolution H spectroscopy with which we resolve much of the time-variability, and a further six nights of archival spectroscopy with lower time-resolution but higher spectral-resolution. We find significant variability in most of the data considered, with both the H line and the continuum often varying in a correlated way. This includes both dramatic flares lasting a few hours in which the line flux nearly doubles and lower-level flickering. The strongest flares involve development of asymmetry in the line profile, with the red wing usually strongest independent of orbital phase. It is unclear why this is the case, but we discuss several possible explanations. We consider the energetics of the flares and compare with plausible models including chromospheric activity on the companion star, local magnetic reconnection events within the disc and a varying irradiation from close to the black hole. Based on the line profile changes during the flares, we conclude that the most likely origin for the variability is variable photoionisation by the central source, although local flares within the disc cannot be ruled out.
keywords:
accretion, accretion discs – binaries: close – stars: individual: V404 Cyg1 Introduction
Quiescent black hole X-ray transients (BHXRTs) provide the best evidence we have for the existence of stellar mass black holes. These X-ray binaries contain a relatively low-mass star (usually, but not always, M⊙) accreting onto a likely black hole via Roche lobe overflow and an accretion disc. In their quiescent state the accretion flow becomes extremely faint and so the companion star can be directly observed. It is the companion, and in particular its radial velocity variations, which provide the key to measuring the black hole mass (Charles 1998).
One of the most secure cases for a black hole is for V404 Cyg, which contains a compact object with a mass function of M⊙ (Casares, Charles & Naylor 1992), twice the usually accepted upper limit to a neutron star mass (Rhoades & Ruffini 1974). The best estimate for the actual mass is 122 M⊙ (Shahbaz et al. 1994) and this system likely contains the most massive stellar mass black hole for which we have dynamical evidence. It has the longest orbital period of the BHXRTs, at 6.5 days, with a K0 IV companion star (Casares et al. 1993). V404 Cyg is the most luminous of these systems in quiescence with erg s-1, brighter than the prototypical BHXRT, A 0620–00 (Garcia et al. 2001). These extremes are unlikely to be coincidental and the high may be a consequence of the long orbital period, the evolved donor star, and/or the high mass of the black hole.
The high quiescent indicates that even in its quiescent state, V404 Cyg is not completely dormant, but that some accretion continues. This is also indicated by the substantial short-term (sub-orbital) variability that V404 Cyg exhibits. In the optical this has an amplitude of 0.1–0.2 mag (Wagner et al. 1992), at least partly due to a 6 hr quasi-periodic oscillation (Casares et al. 1993; Pavlenko et al. 1996). Short timescale infrared variations also appear to be present (Sanwal et al. 1996) and the H line profiles change significantly on short timescales (Casares & Charles 1992; Casares et al. 1993). At X-ray energies, Wagner et al. (1994) saw changes of a factor of 10 on timescales day with ROSAT and more recently Garcia et al. (2000) presented a Chandra lightcurve exhibiting a factor of variability in a few ksec. Finally V404 Cyg remains a variable radio source on timescales of days: Hjellming et al. (2000) reported typical variability in flux of 0.1-0.8 mJy with a maximum quiescent flux of 1.5 mJy.
V404 Cyg is not the only BHXRT to exhibit variability in quiescence. Haswell (1992) discovered significant optical flaring in A 0620–00 on timescales of minutes. Zurita et al. (in preparation) have found optical photometric variability in other systems: in addition to V404 Cyg and A 0620–00, they also identify strong variability in GRO J0422+32 and also in the neutron star system Cen X-4. This kind of behaviour thus seems to be common in quiescent BHXRTs.
| Date | Telescope | UT Range | Exposures | Number of | Wavelength | Resolution |
| Time (s) | Exposures | range (Å) | (Å) | |||
| La Palma Spectroscopy | ||||||
| 1992 Jul 5 | WHT | 00:51–04:43 | 1800 | 8 | 6200–6600 | 0.5 |
| 1992 Jul 6 | WHT | 00:38–05:04 | 1800 | 8 | 6200–6600 | 0.5 |
| 1992 Jul 8 | WHT | 00:33–04:58 | 1800 | 10 | 6200–6600 | 0.5 |
| 1992 Jul 9 | WHT | 00:56–04:24 | 1800 | 7 | 6200–6600 | 0.5 |
| 1992 Jul 10 | WHT | 00:20–04:53 | 1800 | 9 | 6200–6600 | 0.5 |
| 1992 Jul 11 | WHT | 23:46–03:43 | 1800 | 8 | 6200–6600 | 0.5 |
| 1999 Jul 6 | WHT | 21:27–04:02 | 180 | 98 | 6000–7400 | 4 |
| 1999 Jul 7 | WHT | 21:30–04:04 | 240 | 83 | 6000–7400 | 4 |
| La Palma Photometry | ||||||
| 1992 Jul 5 | JKT | 01:09–05:15 | 200 | 33 | ||
| 1992 Jul 6 | JKT | 00:34–05:17 | 200 | 50 | ||
| 1992 Jul 8 | JKT | 00:28–05:11 | 200 | 63 | ||
| 1992 Jul 9 | JKT | 00:56–04:31 | 200 | 44 | ||
| 1992 Jul 10 | JKT | 00:13–04:40 | 200 | 49 | ||
| 1992 Jul 11 | JKT | 23:40–04:10 | 200 | 45 | ||
| 1999 Jul 6 | JKT | 22:03–03:56 | 60 | 205 | ||
| 1999 Jul 7 | JKT | 21:54–03:57 | 60 | 259 | ||
| CrAO and SAI Photometry | ||||||
| 1999 Sep 11 | 38 cm | 20:53–00:45 | 120 | 84 | ||
| 1999 Sep 12 | 38 cm | 19:29–01:11 | 200 | 70 | ||
| 1999 Sep 16 | 38 cm | 20:36–21:58 | 180 | 23 | ||
| 1999 Sep 17 | 38 cm | 20:12–00:01 | 180 | 43 | ||
| 1999 Sep 18 | 38 cm | 19:26–20:24 | 180 | 11 | ||
| 1999 Sep 21 | 125 cm | 22:31–01:34 | 90 | 96 | ||
| 1999 Sep 22 | 125 cm | 22:43–00:45 | 90 | 56 | ||
| 1999 Sep 23 | 125 cm | 23:26–02:09 | 90 | 73 | ||
| 1999 Oct 16 | 38 cm | 20:52–22:04 | 180 | 23 | ||
| 1999 Nov 05 | 38 cm | 20:15–21:07 | 200 | 11 | ||
| 1999 Nov 11 | 125 cm | 19:21–19:26 | 20 | 2 | ||
| 1999 Nov 14 | 125 cm | 17:59–18:14 | 90 | 7 | ||
| 1999 Nov 19 | 60 cm | 18:28–18:33 | 120 | 3 |
It is important to understand these variations as the properties of the variability can yield important clues about the nature of the quiescent accretion flow and provide an observational test of models for this flow. For example, advection dominated accretion flow (ADAF) models for V404 Cyg have predicted that the non-stellar optical continuum is dominated by synchrotron emission from very close to the black hole (Narayan, Barret & McClintock 1997; Quataert & Narayan 1999). One would most naturally expect the ADAF temporal variability to be different to that of the emission lines which show a double peaked profile, indicative of an origin in the outer disc, although there is also a possibility that the lines could be photoionised by the ADAF. Alternatively, both line and non-stellar continuum emission could originate in the outer disc, with variability likely associated with local magnetic reconnection events. One would expect in this case rapid and kinematically localized enhancements in the line emission, although the flares might be broadened by motions within the flaring material. Another important source of variability may be the companion star. This is a K0 IV star, tidally locked in a 6.5 day orbit and likely similar to active stars in RS CVn binaries.
To investigate these issues, in 1999 July we obtained optical spectroscopy at high time-resolution so as to reveal the spectral signature of the short-term variability. We obtained simultaneous photometry to ensure a reliable flux calibration; hence we can accurately study both line and continuum variations. The low spectral resolution also provides us with kinematic resolution of emission line variations. To place these observations in a broader context we include longer term photometric monitoring observations taken during 1999. We also re-analysed high spectral resolution data from a spectrophotometric campaign on V404 Cyg performed in 1992 July. A preliminary analysis of the latter data appeared in Zurita, Casares & Charles (2000). We describe the observations in Section 2. Section 3 presents the average spectrum of V404 Cyg from 1999 together with that of the nearby blended star. In Section 4 we compare our line and continuum lightcurves. Section 5 examines the spectrum of the variability in more detail and in Section 6 we discuss our results in the light of current models for quiescent BHXRTs.
2 Observations
We observed V404 Cyg from the Observatorio del Roque de los Muchachos on La Palma on 1992 July 5–6 and 8–11 and 1999 July 6–8 using the 1.0 m Jacobus Kapteyn Telescope (JKT) for photometry and the 4.2 m William Herschel Telescope (WHT) for spectroscopy. Conditions on all nights were good, with little or no dust or cirrus and seeing typically arcsec. Further photometry was obtained with the 0.38 m telescope of the Crimean Astrophysical Observatory (CrAO) and the 1.25 m and 0.6 m telescopes of the Sternberg Astronomical Institute (SAI) from 1999 September 11 to November 19. A full log of observations used is given in Table 1.
2.1 JKT Photometry
To ensure accurate photometric calibration of the WHT spectroscopy, we obtained simultaneous band photometry. In 1999 we used the SITe2 CCD camera on the JKT. We used integration times of 60 s on both nights, obtaining a temporal resolution of 80 s. All images were corrected for bias and flat-fielded in the standard way using iraf. Although the seeing conditions were good, we were not able to cleanly separate the contribution of the target and its nearby contaminating star so we performed simple aperture photometry around both stars. The contribution of the blended star, assumed constant, was then subtracted assuming (Casares et al. 1993). We used an aperture of 9 pixel radius (3 arcsec) for our object and several comparison stars within the field of view, which were checked for variability during each night and during the entire data set. We also explored any correlation between the target differential variations and the seeing, but found none. The 1992 data were obtained with the GEC CCD camera on the same telescope. The typical integration time was 200 s. Aperture photometry was performed with an aperture of 11 pixel radius (3.6 arcsec). Further details of these observations can be found in Pavlenko et al. (1996).
2.2 WHT Spectroscopy
We obtained the 1999 time-resolved spectrophotometry using the ISIS dual-arm spectrograph on the WHT. To maximise efficiency and minimise readout time and noise, we used the single red-arm mode with the relatively low-resolution R316R grating and the TEK4 CCD. Cycle times were 203 s on 1999 July 6–7 and 263 s on 1999 July 7–8. A wide slit (4 arcsec) was used to maximise photometric accuracy, so our spectral resolution was determined by the seeing ( arcsec), and was typically Å. Bias correction and flat fielding were performed using standard iraf techniques.
Observations of V404 Cyg are made difficult by the presence of a fainter star 1.5 arcsec to the north and usually blended with it (Udalski & Kaluzny 1991; Casares et al. 1993). Because of this, we chose a slit alignment passing through the line of centres of the two stars. Fortunately this also coincided with a third, isolated, relatively bright star. Hence we could use the isolated star to define the spatial profile along the slit, and then deblend the spectra of V404 Cyg and the nearby star, following the method summarised in Hynes et al. (1999) and described in more detail by Hynes (1999,2001). For these data, we used the isolated star to construct a wavelength independent semi-analytical spatial profile for each spectrum. This comprised a Voigt profile with a numerical correction determined for the profile wings. The profile deblending optimal extraction method does reject most cosmic rays and bad pixels, but a few remained; these were corrected by hand.
Wavelength calibration was interpolated between contemporaneous exposures of a copper-neon/copper-argon arc lamp. The dominant residual error was caused by the uncertain positioning of the star within the wide slit. The sky lines could not be used to correct the wavelength solution because these fill the slit and the stars positioning relative to these is also uncertain; hence we must use spectral features of the objects. Unfortunately the template star shows no strong spectral features in this region. We experimented with using both the H absorption feature in the faint blended star and various stellar absorption features in V404 Cyg (over 6380–6520 Å) and found that the latter gave less scatter in the corrections, which were calculated by cross-correlating the individual spectra in this region with an average. Of course the photospheric features do move, so this correction represents a transformation into the companion rest frame. We then use the known radial velocity curve of Casares & Charles (1994) to transform into an inertial frame. Initial flux calibration was done relative to the template star. This was in turn calibrated relative to the spectrophotometric standard Cyg OB2, No. 9 (Massey et al. 1988). Finally we performed synthetic band photometry of the sum of calibrated spectra of V404 Cyg and the blended star and slit losses were corrected by comparing with the simultaneous JKT photometry.
V404 Cyg was also observed in the H region with the ISIS spectrograph on the WHT on the nights 1992 July 5–6 and 8–11. A total of 50 spectra were obtained using individual exposures times of 1800 s. The main aim of these observations was to measure the rotational broadening of the companion star, so a narrow (0.8 arcsec) slit was used in combination with a 1200 line mm-1 grating to yield a high spectral resolution of 0.5 Å (FWHM). The wavelength range covered was 6200–6600 Å. The spectra were calibrated using the flux standard BD (Oke & Gunn 1983). Further details of these observations can be found in Casares & Charles (1994). As the slit was narrower, the slit loss correction is more dramatic than in the 1999 observations. We made the correction, as is explained in the first part of this section, by comparing the simultaneous JKT photometric fluxes and the spectroscopic fluxes.
2.3 Contemporaneous Photometry
As part of an ongoing campaign to monitor V404 Cyg in quiescence, observations were carried out at the 0.38 m Cassegrain telescope of the Crimean Astrophysical Observatory (CrAO) and the 1.25 m and 0.6 m telescopes of the Sternberg Astronomical Institute (SAI) in a broad system, using SBIG ST-7 cameras. The images were dark-subtracted, flat-fielded and analysed with a profile/aperture photometry package developed by Goransky (SAI).
3 Average spectra

In Fig. 1 we show the average spectra of V404 Cyg and the nearby blended star from 1999. To our knowledge, this is the first time that the spectra of the two stars have been separated; most spectroscopic observations either yield a combined spectrum, or align the slit perpendicular to the line of centres to minimise the contribution from the blended star. Contamination by this star will distort the spectrum and must be considered (e.g. Shahbaz et al. 1996) so it is worthwhile to present the separated spectra for comparison.
Photometry of the blended star yielded , (Casares et al. 1993). For different trial reddenings, the best agreement with colours of main sequence stars comes for a K4–5 star with . The reddening line in a vs. plot is almost parallel to the main-sequence for spectral types earlier than K, however, so more reddened earlier types are also possible. The only strong feature visible in the blended star’s spectrum is H absorption. This is stronger than expected for a late K star and instead favours an F type identification; a higher resolution spectrum would be needed for a more precise classification. A weak 6495 Å absorption line also appears to be present; this feature can be present in F stars (see e.g. the templates used by Orosz & Bailyn 1997), so is consistent with this interpretation. For the photometric colours to agree with an F star requires , or . This implies a dereddened brightness of and a distance of kpc for a main sequence star. Both reddening and distance are similar to the values for V404 Cyg (Casares et al. 1993) so this is a plausible solution. Further support for a similar reddening to V404 Cyg is the presence of the 6284 Å diffuse interstellar band with a similar strength in both objects. If the blended star is an F star then we expect it to have no significant CO features in the infrared. Consequently the infrared disc contribution will be reduced further below the 14 per cent upper limit of Shahbaz et al. (1996).
For the following analysis we will require the H line luminosity. We observe an average line flux of erg cm-2 s-1, and Casares et al. (1993) estimate an optical extinction of . Assuming the gas to dust scaling of Bohlin, Savage & Drake (1978), this extinction corresponds to a neutral hydrogen column of cm-2, which is also consistent with that inferred from the Chandra spectra (Garcia et al. 2000). With and an average Galactic extinction curve (Seaton 1979) we infer an interstellar attenuation at H of a factor of . A distance of 3.5 kpc was adopted by Garcia et al. (2001) and to facilitate comparison with their X-ray results we adopt the same value. Finally, to convert observed fluxes into luminosities we also assume isotropic emission. This is probably not correct for emission from a disc, but as V404 Cyg appears to be an intermediate inclination system (Shahbaz et al. 1994), the difference in the ratio of observed flux to luminosity between isotropic and disc emission is likely to be small, and this is acceptable for a crude approximation. We finally derive an average, dereddened H luminosity of erg s-1.


4 Lightcurves
4.1 The orbital lightcurve
In Fig. 2 we present phase-folded photometric lightcurves from CrAO, SAI and the JKT in 1999. Scales have been chosen to facilitate comparison with Fig. 1 of Pavlenko et al. (1996). As with the 1992 data described there, the lightcurve is dominated by the double-humped ellipsoidal modulation, but superposed upon it are shorter term variations visible within a single night. The 1999 data were obtained in a redder bandpass () than those obtained in 1992, so are not directly comparable, but it does appear that the amplitude of both ellipsoidal and short-term variations is less. Apparent changes in the ellipsoidal lightcurve of V404 Cyg based on the monitoring campaign have already been noted by Pavlenko et al. (2001).
In the earlier data the short term variations appeared quasi-periodic (Pavlenko et al. 1996). We performed a period search on the 1999 data to test if this was still the case. Before doing the analysis we removed the 6.4714 d orbital modulation and its first two harmonics. The periodogram of the residuals showed several peaks and it is difficult to choose between them, or even prove that the variations are quasi-periodic. Formally the peak with the highest significance has period d, hr with mean amplitude mag. This is close to the period found in the earlier data, but other periods are possible and the case is inconclusive.
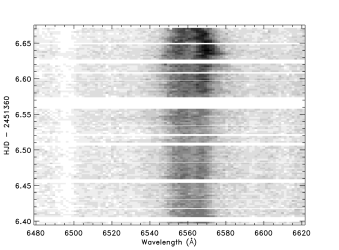
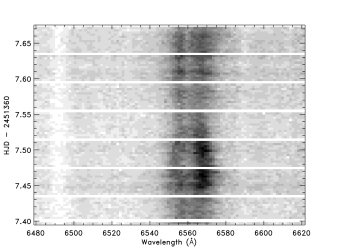
4.2 The high temporal resolution spectra
Light curves from the 1999 high temporal resolution spectra are shown in Fig. 3. On both nights we find the variability is dominated by a single large flare, although the profiles of these flares are complex. On the second night the flare is clearly seen in the continuum as well, with the same structure. The amplitude of the line flare is much larger than that in the continuum, but this is likely because the continuum is heavily diluted by light from the mass donor star; Casares et al. (1993) estimate 90 percent of the light in the band is from the mass donor. After correction for this, the fractional amplitudes of the flares in line and inferred accretion flow continuum are similar. On the first night, the continuum does not reflect the large flare, although finer structure does appear common to the lightcurves and a weak continuum flare does coincide with the peak of the H flare.
To test if the flaring is simultaneous, or if one lags the other, we calculated cross-correlation functions between them. The lightcurves are reasonably well sampled so we use the interpolation cross correlation function (Gaskell & Peterson 1987; White & Peterson 1994). We also calculated discrete correlation functions (Edelson & Krolik 1988) and the results were almost identical. Our CCFs for the two nights are shown in Fig. 4. As noted above, the correlation between line and continuum does not show up well on the first night, and at 3 confidence is not significant. On the second night a clear peak is seen, significant at the 3 level. The peak shows no large lag between line and continuum, but does appear asymmetric. This could correspond to line variations lasting longer than those in the continuum, perhaps due to a significant recombination timescale. The lack of correlation on the first night, and the strange structure of the CCF on the second night are at least partly due to low-frequency variations, in particular the absence of large continuum flares when large H flares occur. On the first night there is no prominent continuum flare, but some shorter timescale variations do appear correlated. On the second night only the peaks of the large flare are well reproduced by the continuum, not the broader base. To further explore this, we removed the poorly correlated low-frequency variations by applying a high-pass Fourier filter to the lightcurves with a cut-off at 1 hr-1. The CCFs of the filtered lightcurves are shown in the lower panel of Fig. 4. On the first night, there is still no prominent peak in the CCF, in spite of apparent similarities in the lightcurves. For the second night, the structure at negative lags has been removed, but the peak remains prominent and definitely appears significant. We estimate a delay of the line with respect to the continuum from the filtered lightcurves of s, consistent with zero at the 2 level. The error estimate follows Gaskell & Peterson (1987) and is defined for uniformly sampled data. Our data are close to, but not perfectly, uniform. Hence we believe this error estimate is not too far wrong. We also calculated discrete CCFs (Edelson & Krolik 1988) to check that the peak was not being pulled towards zero lag by correlated noise in the line and continuum lightcurves; this method eliminates correlated noise by only including the contribution of line and continuum from different spectra. The discrete CCF actually yielded a slightly shorter lag of s. Since the measured delay is not significant at the 3 level, and is below the time resolution used, it is probably not real. The 3 upper limit on the lag is then about 200 s. We note that important short timescales such as the light travel time across the binary ( s) are not resolved, so a smaller lag may be present; higher time-resolution observations would be required to test this, but would then require an 8–10 m class telescope.
For the analysis of the line profiles in Section 5.2, we divided the lightcurves up into segments, a convenient but artificial division of continuously varying behaviour. We identify the lowest region of each night with the ‘quiescent state’, Q. Isolated flickering regions, somewhat brighter than Q are labelled F. Within the flares we separate flare rise (fR), peak (fP) and decline (fD) segments. This nomenclature is summarised in Table 2.
For the two major flares we estimated the peak flare luminosity emitted in H and the total energy released in this line. We assumed that the lowest level reached on each night represents the base, persistent flux and integrate over the range actually observed. Since both flares extend beyond our coverage this is a lower limit to the total energy. For the first night we estimated a peak flare luminosity (at 3 kpc) of erg s-1 and a total observed H energy of erg. For the second night the values are erg s-1 and erg respectively. The peak luminosities of the flares are strikingly similar, although the total energies are likely different, since most of the decline of the flare on the first night was missed.


4.3 The high spectral resolution spectra
Light curves from the 1992 high spectral resolution spectra are shown in Fig. 5. Here we can see that variability is also dominated by single flares with changes in flux up to a factor of 2 on time scales of 1–2 hr, although due to the poorer time resolution, we cannot resolve any short-term structure. The largest flares are seen on the nights of 6, 9 and 11 July and both the amplitude of the events and the duration is similar to that found in 1999, seven years later. Generally the continuum lightcurve is correlated with the H one, although the amplitude of continuum variations is percent of the H variability.
![[Uncaptioned image]](/html/astro-ph/0111218/assets/x7.png)
![[Uncaptioned image]](/html/astro-ph/0111218/assets/x8.png)
![[Uncaptioned image]](/html/astro-ph/0111218/assets/x9.png)
![[Uncaptioned image]](/html/astro-ph/0111218/assets/x10.png)
![[Uncaptioned image]](/html/astro-ph/0111218/assets/x11.png)
![[Uncaptioned image]](/html/astro-ph/0111218/assets/x12.png)
5 Spectral Variability
Lightcurves are a good way to contrast line and continuum variability but information about velocities is lost. In this section we explore several methods to analyse the changes in the line morphology and constrain the binary region responsible for the H variability.
5.1 Trailed Spectra
Our trailed spectra from 1999 are presented in Fig. 6. It can be seen that the line profile varies with the flares, with strong red peaks seen at flare maxima. Other than this enhancement of the red wing relative to the blue, we find no evidence of velocity changes, or new velocity components or lines appearing during the flares. There is an apparent broadening of the profiles in the trailed spectra during the flares, but this is not real, as can be seen by the profiles in Fig. 7; it is due to the overall brightening of the profile.


5.2 Line profiles from the high temporal resolution spectra
We have constructed average line profiles from each of the lightcurve regions indicated in Fig. 3. These are shown in the left-hand panel of Fig. 7. During faint (Q) periods the H line is largely symmetric and exhibits a ‘classical’ double-peaked disc profile. During flickering (F) periods a similar symmetric disc profile is seen, but it is stronger. Profiles on the rise to a flare (fR) are mostly similar, the exception being the second fR period on the first night (the highest dashed line in Fig. 7, just before the peak of the flare.) In this case, a mild asymmetry had developed and the profile was clearly developing towards the fP form (see below). Excluding this case, F and fR profiles are indistinguishable. To test for more subtle differences between Q and F/fR profiles we combined all of the profiles of each type (excluding the anomalous fR from the first night) and normalised the averages to the same total line flux. These normalised profiles are plotted in the centre panel of Fig. 7. On both nights there is a tendency for F/fR profiles to be broader than Q ones. This suggests that the brightening mainly involves higher velocity material. In principal an average profile could also be broadened by errors in wavelength calibration which, as described in Section 2.2, is not very reliable. The rms scatter in the wavelength corrections was 0.5 Å and 1.2 Å on the first and second nights respectively corresponding to 20 and 50 km s-1 at H. To explain the observed broadening requires calibration errors of order 100–150 km s-1, however, so the broadening is likely real. The spectra at and after the peak of the flares (fP and fD) are qualitatively very different from those at lower levels. On both nights, a strong red peak developed during the flare; the asymmetry is most pronounced on the second night. The blue peak is clearly also enhanced, as can be seen in the difference profile (fP/fD – Q) shown in Fig. 7. There are changes in the asymmetry during the flares, but these are different on each night and there is no repeatable difference between fP and fD profiles. The velocity of the red peak is km s-1. The characteristics of profiles in different phases are summarised in Table 2.
| Abbrev. | Type | Line profile |
| Q | Quiescent | Weak, symmetric |
| F | Flickering | Medium, symmetric |
| fR | Flare rise | Medium, usually symmetric |
| fP | Flare peak | Strong, enhanced red wing |
| fD | Flare decline | Strong, enhanced red wing |
We also constructed continuum spectra for each of these periods to test if the spectrum becomes redder or bluer during the flares. We can find no convincing change in continuum colour between Q and fP/fD periods, although the quality of difference or ratio spectra between these periods is very poor.
5.3 The high spectral resolution spectra
For the 1992 data, the time-resolution is poorer making it hard to define regions of the lightcurves in the same way as was done in Section 5.2. These data do, however, benefit from a higher signal-to-noise ratio and better wavelength calibration. They are thus well suited to calculation of the root-mean-sqare (rms) spectrum, as is commonly employed in AGN studies (see e.g. Wandel, Peterson & Malkan 1999 for definition). We find that the line core, especially the red core (regions confined within km s-1), is the main contributor to the line variability (see Fig. 8) on July 5, 10 and 11, peaking at km s-1, comparable to the peak velocities in 1999. On July 6, however, it seems to be the blue core that varies strongest. The other two nights do not show pronounced changes in the symmetry of the lines. We cannot find any narrow components associated with the expected velocity of the secondary star or the hot-spot/gas-stream. The line appears to be more symmetric and narrower in the low states, as found in the higher time-resolution spectra discussed above.

6 Discussion
It is clear that significant variability is present in both the continuum and the H line. We note that with an average equivalent width of Å, H will make a small contribution to band photometry percent, so band photometric variability should be dominated by the continuum. Possibly there is more than one kind of variability present, with different physical origins. Very prominent are the large flares that dominate each night’s light curve. These last a few hours each and occur once per night, making it likely that these can be identified with individual events of the 6 hr QPO described by Pavlenko et al. (1996). In addition to these large extended flares, shorter timescale variability is present with a lower amplitude. While this may originate from the same mechanism responsible for the larger flares, it could also represent a different process. The timescales involved in this higher frequency variability are comparable to those found in shorter period BHXRTs (Haswell 1992; Zurita et al. in preparation). This minute timescale flickering may be typical of quiescent BHXRTs, but the more dramatic flares could be unique to V404 Cyg and associated with its longer orbital period, higher black hole mass, higher X-ray luminosity and/or some other factor. Alternatively, if the variability timescale scales with orbital period, then the variations seen in other BHXRTs correspond to the large flares in V404 Cyg, and the counterparts of the short-term variation seen in the latter have yet to be found.
Several variability sites are possible. An obvious candidate would be local magnetic flares (reconnection events) within or above the disc. Other possibilities include instabilities in the accretion stream, resulting in variability at the stream-impact point, chromospheric activity on the companion star and instabilities in the inner accretion flow resulting in variable photoionisation by a central X-ray source.
6.1 Kinematic evidence for the flare location
An obvious diagnostic of the flare location is the line velocities, as these should show a radial velocity modulation corresponding to the flare site. The asymmetry seen in the flare profiles obviously complicates matters; this is discussed in Section 6.5. We would expect this asymmetry to be applied relative to the motion of the flaring component, so the underlying radial velocity modulation should still be apparent. Fig. 9 shows the peak velocities of observed flares together with several predicted radial velocity curves. The companion star’s curve is taken from Casares & Charles (1994). The compact object’s curve is also derived from this assuming (Casares & Charles 1994). For the stream impact point we calculate ballistic stream velocities corresponding to impacts at 0.5, 0.6, 0.7, 0.8 and 0.9 times the effective lobe radius (Eggleton 1983). We assume , M⊙ and (Shahbaz et al. 1994). These parameters obviously have some uncertainty, but at least illustrate the range of velocities which should be present. The relative constancy of the flare velocities at the range of orbital phases observed is evidence against the flares originating in the companion star’s corona, and a hotspot origin is similarly unlikely. Instead the flares appear to originate in or above the disc. In fact the lack of scatter in the flare velocities is also difficult to reconcile with localised flares in the disc; these should be scattered across its surface, with a spread in peak velocities comparable to the width of the double peaked profile. This uniformity of flare velocity, together with the apparent participation of the whole double peaked profile in the flare (clearly visible in the difference profiles in Fig. 7) argues that the H flare emission is spread over the whole disc. If this is true then the flares most likely originate in photoionisation by variable X-rays. Unfortunately, given the limited number of flares observed, none of these arguments are statistically conclusive, so we now examine other evidence to support or reject this interpretation.

6.2 An active companion star?
During quiescence the optical emission of BHXRTs is dominated by light from the secondary; hence the observed variability could be due to chromospheric flare activity on the companion star. High levels of activity can be best maintained via tidal locking in tight binaries, as occurs in RS CVn systems, so we can expect the same behaviour in LMXBs. Comparisons with RS CVn stars have already been made by Bildsten & Rutledge (2000) to explain the quiescent X-rays. They conclude that the X-ray luminosities seen in most quiescent BHXRTs are consistent with an origin in coronal activity on the companion star ( up to erg s-1 is seen in RS CVn systems; Dempsey et al. 1993), but explicitly exclude V404 Cyg from this as its X-ray luminosity is too high. Lasota (2000), however, goes further and argues that coronal X-ray emission is expected to be too faint to wholly explain quiescent X-rays in any BHXRTs. Chandra spectroscopy supports this, indicating that the X-ray spectra of BHXRTs in general, and V404 Cyg in particular, are harder than those of stellar coronae (Kong et al., in preparation). It remains likely that the companion stars are active and that they do make some contribution to the X-ray emission, but this probably does not dominate. We should then also ask if activity in the chromosphere of the companion star could be responsible for the optical variability observed. Although it has been generally assumed that optical flares on RS CVn stars are a rare phenomenon, very high levels of activity have been reported in a few of these systems. For example, UX Ari is a double-lined spectroscopic binary with spectral type G5V/K0IV and 6.44 day orbital period. It exhibits chromospheric emission originating from the cooler component. H flares with peak line luminosities ranging between 0.7 and erg s-1 have been observed (Montes et al. 1996). These are of the same order of magnitude as the maximum H luminosity observed in the H flares of other RS CVn systems such as V711 Tau (Foing et al. 1994) and HK Lac (Catalano & Frasca 1994). The dereddened peak luminosities in the V404 Cyg flares are erg s-1 on 1999 July 6–8, two orders of magnitude higher than in these RS CVn systems and so apparently not consistent with an origin in the chromosphere of the companion star, if it is comparable to an RS CVn star. This is open to question, however, as the companion star to V404 Cyg may be a stripped giant (King 1993). In this case the internal structure will be very different to a ‘normal’ RS CVn star with the same orbital period and spectral type. Of course, given the line profile of the flares (Fig. 7), with an enhancement of both wings, the kinematics of the flares are also not consistent with an origin on the companion star, and overall we feel this interpretation can be rejected.
6.3 Variable photoionisation from the central source?
The most likely site for the H flares is then the disc. We next ask how are they powered? The most likely possibilities are i) variations in the central X-ray source producing a variable photoionisation, or ii) local flares within the disc or disc corona powering the flares directly.
Support for the variable photoionisation interpretation is provided by Casares et al. (1993) who find H/H/H ratios consistent with case B recombination and conclude that the emission lines are photoionised. To further test this, we estimate the photon flux in H and compare with observations reported by Garcia et al. (2001). The H luminosity estimated in Section 3 is erg s-1, corresponding to phot s-1.
While a straightforward comparison with the observed is possible it would not be very meaningful. Any photons above 13.6 eV could ionise hydrogen, and the absorption cross-section is highest for the lowest-energy photons; these will cause ionisations at lower optical depths where the recombination spectrum is less thermalised. Further, the X-ray spectrum has photon-index (Garcia et al. 2000), so low-energy photons can be expected to be much more numerous than their more energetic counterparts. Consequently, if photoionisation is important in powering H emission at all, it will be dominated by the unobservable EUV photons, and to estimate these we must either adopt a model or extrapolate from the X-ray data. Extrapolating from the spectrum (, erg s-1), we expect a luminosity of erg s-1 above 13.6 eV or phot s-1. This is extremely uncertain; for example modest changes in the photon-index of can change these numbers by a factor of two. We feel that at present there is no definitive model for the high-energy spectra of quiescent BHXRTs that is more reliable in the EUV than an extrapolation. Simple ADAF models do make definite spectral predictions for V404 Cyg; for example those presented by Narayan et al. (1997) predict an EUV flux above a pure extrapolation of the X-ray power-law due to an EUV bump from inverse Compton scattering of synchrotron photons. Theoretical doubts about the possible presence of outflows and convection call these models into question, however (Narayan & Yi 1994; Igumenshchev, Chen & Abramowicz 1996; Blandford & Begelman 1999). Models of ADAFs with winds for V404 Cyg have been considered by Quataert & Narayan (1999). By suppressing the central accretion rate, these increase the importance of bremsstrahlung radiation from the outer flow relative to inverse Compton emission and consequently harden the spectrum. This gives a poorer fit to observations than a wind-free ADAF, although this can be rectified by changing assumptions about the microphysics. In convection dominated accretion flow (CDAF) models emission is also expected to be dominated by bremsstrahlung radiation from large radii in the flow and spectral predictions are rather similar to those of ADAFs with winds (Ball, Narayan & Quataert 2001). While the unbroken power-law of the original ADAF models is in good agreement with the spectral data, these latter models require some fine tuning of parameters to achieve a satisfactory fit. Completely different scenarios exist, for example X-ray emission from a corona above a cold disc (Nayakshin & Svensson 2001) but these make no spectral predictions at all. Finally, we should remember that the X-ray flux is known to vary by up to a factor of ten on timescales longer than the 10 ks Chandra observation (Wagner et al. 1994). Consequently, the numbers above are only order of magnitude estimates at best.
Adopting this (with large uncertainties) we require that the disc trap of order percent of the emitted EUV photons, if one H photon is produced per photoionisation. This is an extremely simplistic assumption, however, as many of the photoionisations considered will produce rather energetic photoelectrons. These could go on to collisionally ionise another atom, or produce bremstrahlung photons that produce more photoionisations. A more secure limit is provided by comparing the input and output energies; we expect that the reprocessed emission from a disc element must be less than the input ionising flux, and so:
where is the fraction of the high-energy emission which is input into the disc and is the fraction of the input energy emitted in H. depends on both the geometry and the local conditions, as any photons which are Compton scattered off the disc will escape without causing a photoionisation. We can estimate an upper limit on in the case B recombination limit (supported by observations of V404 Cyg; Casares et al. 1993). In this case all Lyman line and continuum emission is assumed to be reabsorbed and the H emission is 20–30 percent of the total Balmer and Paschen line and continuum emission for temperatures of 5000–20000 K (Osterbrock 1987). Hence . In reality could be significantly below this limit, as energetic photoelectrons may lose energy by other processes besides collisional ionisation: scattering off other electrons and bremsstrahlung may both be significant and will tend to thermalise the input energy. This problem will be more severe for the higher energy photons which will tend to deposit energy at higher optical depths within the disc and ultimately give rise to thermal continuum emission. For we then require , although due to the uncertainty in the incident ionising flux this number is rather uncertain.
In principal, photoionisation could occur on the companion star or the disc. For V404 Cyg, however, the mass ratio is small (; Casares & Charles 1994) and the companion star will absorb percent of the emitted flux from near the central source. For the disc, the calculation is straightforward for the simplest ADAF models with emission from close to the black hole. For an isotropic point source illuminating a thin, but somewhat flared disc we expect a fraction to be absorbed; hence we require for an ADAF radiating from the centre. ADAFs with winds or CDAFs, however, are expected to emit most of their radiation from larger radii and hence can more efficiently irradiate the disc. The difference is probably not huge, however, perhaps a factor of a few higher. Unfortunately, given the large uncertainties in extrapolating the X-ray spectrum into the EUV region and the variability in the X-ray flux, none of these possibilities can be ruled out and it appears that it is energetically possible for all of the advective models considered to produce sufficient photoionisation on the disc to account for the observed H flares, provided that not too much of the input energy is thermalised at large optical depths. Equally if X-ray emission originates from a corona above the disc (Nayakshin & Svensson 2001) then a large fraction ( percent) will be incident upon the surface, so this model is also plausible, even with emission of a significant fraction of the energy in the continuum.
6.4 Local magnetic reconnection events?
An alternative interpretation of the flares would be that they originate in local magnetic reconnection events in or above the disc. It is widely believed that a dynamo mechanism operates in accretion discs, driven by the strong shear produced by differential rotation (see e.g. Tout & Pringle 1992). There is limited observational evidence for this, but it is known that Balmer line emissivity in quiescent dwarf novae seems to follow the same power law with rotation rate () as in chromospherically active stars (Horne & Saar 1991). Consequently it has been proposed that the mechanism powering the H emission lines is the same in both active stars and discs, a dynamo. The effect of the strong shear is that regions of oppositely directed magnetic fields can develop within the disc (Tajima & Gilden 1987). These fields can reconnect explosively (Haswell, Tajima & Sakai 1992) giving rise to a flare. We also expect flux tubes to rise from the accretion disc surface into its corona because of the magnetic buoyancy (Parker) instability as occurs in chromospherically active stars, so reconnection and flaring could originate there.
In solar flares, it is commonly accepted that every H flare is accompanied by a soft X-ray event, hence the effects of X-ray irradiation have to be taken into account and the ionisation and excitation of hydrogen together with the thermalisation of the background electrons will be two important processes. Simultaneous H/soft X-ray (0.05–2 keV) observations of solar flares show a H to soft X-ray energy ratio of 5% [Acton et al. 1982]. The same ratio has been observed in the chromospherically active dMe star Gl644AB [Doyle et al. 1987], where the total H flare energy is 6 percent of the X-ray energy in the the 0.05–2 keV range. Although in V404 Cyg no simultaneous observations are available, a factor of 2 variability in the X-ray flux has been observed [Garcia et al. 2000], so the peak flare luminosity is of the same order of magnitude as the average luminosity, assuming similar spectra. We can estimate the total energy in the 0.05–2 keV range by extrapolating the observed X-ray power-law () to be erg s-1. The observed luminosity in H is erg s-1, that is 2.5 percent of the X-ray energy. This is a similar order of magnitude to that seen in solar and stellar flares, although obviously very uncertain since a large extrapolation of the X-ray spectrum is involved. The X-ray observations could therefore be consistent with a magnetic reconnection scenario, assuming that the ratio of H to X-ray emission does not radically rescale for flares in or above a disc. Given the uncertainties, an additional X-ray component from close to the black hole is certainly still possible even with this interpretation of the variability.
A major problem for this model is that the timescales involved, with flare rise times of a few hours, are rather short. The line profile enhancements and the large amplitude of the flares suggest that these are not localised events but that the whole disc brightens on this timescale. Given the long period (6.5 d) of V404 Cyg it is hard to see how this could happen, as viscous timescales in the disc will be much longer than this, and hence the whole disc should not be coupled on this timescale.
6.5 Line profile variations
The development of asymmetry in the line profile is a further interesting issue, especially as it is usually the red wing that is affected; only one night, 1992 July 6 shows preferential enhancement of the blue wing. In addition to the peaks summarised in Fig. 9 the single night of spectroscopy from 1990 July 20 presented by Casares & Charles (1992) shows a red flare at orbital phase and in 1991, strong red wings were seen on August 8 and 9, corresponding to phases and (Casares et al. 1993). This suggests that the enhancement in the red wing is not dependent on orbital phase, so does not indicate kinematics of localised flares. It is also notable that it only occurs when the line is strongest; during fP, fD and high fR periods in the nomenclature of Section 4. During F and low fR periods, the line profile is enhanced, but symmetrically.
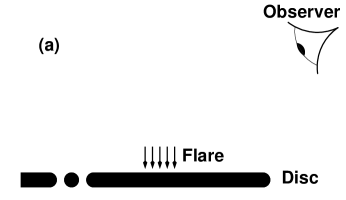
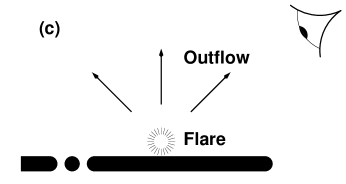
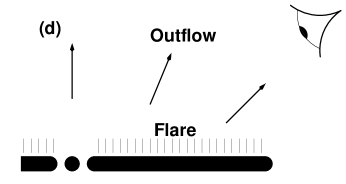
It has long been known that solar flares commonly exhibit a red asymmetry in the H profile (Ellison 1943; see S̆vestka 1962 for a more comprehensive dataset). The asymmetry abruptly increases at the onset of the flare, attains a maximum velocity of 40–100 km s-1 and decreases before the H line reaches its maximum (Ichimoto & Kurokawa 1984). Early papers interpreted it as due to absorption of the blue wing of the emission profile, but Ichimoto & Kurokawa (1984) associate it with a downward motion in the flare chromospheric region. The analogue for an accretion disc would be a flare above the disc accompanied by a collapse downwards (Fig. 10a). The velocities we observe in V404 Cyg are larger than in solar flares, but these likely will rescale in a very different environment. There is a qualitative difference, however, in that our asymmetry persists well after the flare peak, and appears to be more pronounced on the decline than on the rise.
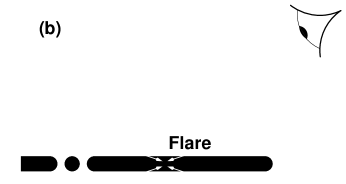
Another mechanism emerges from the model of Haswell, Tajima & Sakai (1992). This model predicts explosive reconnection of wound-up magnetic fields, accompanied by a bulk motion of plasma towards the reconnection point. In this case material closest to the observer will be red shifted and emission is expected over a range of velocities (Fig. 10b). The temporal properties might be expected to be similar to solar flares, however, with the asymmetry most prominent on the flare rise; this is not supported by our observations.
Strong red peaks are actually not uncommon in BHXRTs, but are usually a feature of the outburst. Wu et al. (2001) have discussed the formation of lines in X-ray binaries and suggest that the asymmetric profiles seen in outburst are a consequence of absorption by a relatively slow disc wind driven by external irradiation. These asymmetric profiles are often accompanied by broad absorption troughs which are attributed to absorption by higher velocity material. In one case, GRO J1655–40, we may also have seen P Cygni profiles in the ultraviolet, also indicative of a disc wind (Hynes et al. 1998). In the case of V404 Cyg, we only see the asymmetric profile without the broad absorption component. A plausible interpretation of this would be that a disc wind, or some other outflow, can be formed during strong flares. This could originate either in a flare in the central source which photoionises the disc, or in outward moving material from a reconnection event. In these flares, the whole profile is enhanced, but the blue wing is absorbed by approaching material (Fig. 10c,d). No higher velocity ejecta are present, so there is no broad absorption component. Given that V404 Cyg remains a variable radio source in quiescence, it is also possible that there may be connection between such ejecta and the radio variability, with continued ejection of matter driving the radio variability.
6.6 The quasi-periodicity
The final question to be considered is the origin of the 6 hr quasi-periodicity of the flaring (Pavlenko et al. 1996). This was clear in earlier data, but less conclusive in 1999, although it may still be present. If flares originate in local magnetic reconnection events it is very hard to envisage a mechanism which would make events in different parts of the disc coordinate on a 6 hr timescale.
Esin et al. (1997) suggested that interactions between an ADAF and the outer thin disc might produce quasi-periodic variations with a characteristic timescale of a multiple of the Keplerian period at the transition radius. If we identify 6 hr with the Keplerian period at the transition radius, , then for a 12 M⊙ black hole this corresponds to in units of the Schwarzschild radius. This is much larger than assumed in ADAF models and indeed the high velocity wings of H rule out such a large transition radius (; Narayan et al. 1997). There remains the possibility that the QPO period is a multiple (2 or 3) of the Keplerian period, although why this should be the case is not clear. Alternatively, 6 hr could be some instability timescale intrinsic to the inner flow.
7 Conclusion
We have found significant spectral variability in the BHXRT V404 Cyg in quiescence; most nights exhibit some variability. The variations are most dramatic in H, (and presumably other emission lines as well), with changes of nearly a factor of two in the line strength over a few hours. Similar behaviour is seen in the continuum and this is usually correlated with line changes. The continuum variations show smaller amplitude, as expected if the dominant continuum source, the companion star, does not vary. The variability can be phenomenologically divided into two types. Low level flickering involves changes in the line flux, without dramatic changes in the profile shape. Large flares seen approximately once per night, and may be associated with the hr QPO, involve the development of pronounced asymmetry in the line profile with the red wing strongest.
We have considered several interpretations of the variability. Chromospheric activity is seen on other rapidly rotating late-type stars and this gives rise to H flares. The energy released by the flares in V404 Cyg, however, is two orders of magnitude higher than in such systems, and the line profile changes are hard to reconcile with this interpretation so we consider it unlikely. Variability could originate from variations in the mass transfer rate from the companion star and be manifested by flickering at the stream impact point. The kinematics of the observed flares do not appear consistent with this either, however.
Variability could originate locally within the disc due to magnetic reconnection events, and may involve photoionisation by X-ray flares in the corona immediately above the disc. To explain the participation of the whole line profile in the events requires a large spread in velocity of material involved in the flare, but this would be expected from the explosive reconnection model of Haswell et al. (1992). In this interpretation the redward asymmetry could indicate either motion of the flaring material away from us or partial absorption by material moving towards us. It is unclear, however, why the flare peak velocities do not vary according to where in the disc the flare originates.
Instead the observed flare kinematics suggest that: i) the center of light of the flares does not move significantly over an orbital cycle and ii) the profile of the flare is quite similar to the disc profile, except for the stronger red wing. The most obvious interpretation of is that the whole disc, centred on the slowly moving compact object ( km s-1), participates in the flare. It is hard to see how a magnetic reconnection event could affect the whole disc in this way, so it is most likely that the flares are induced by variable photoionisation from the X-ray source. We have compared the luminosity of the flares with the expected photoionising flux and find that this interpretation is plausible; all advective-type models (ADAFs, ADAFs with winds, CDAFs) could produce the observed H emission, although models which predict most of their emission from large radii in the flow can more efficiently irradiate the disc. In this interpretation the redward asymmetry of the flare profiles can best be explained by absorption of the blue wing, either by an irradiation-driven disc wind or an outflow from the central source. The correlation between the line and continuum which we observe is expected for ADAF models which predict that the optical accretion continuum is self-absorbed synchrotron from near the compact object. In CDAF models, continuum emission is attributed to the outer disc, but it could then result from reprocessed irradiation and so be correlated with variations in photoionised lines. The mechanism responsible for the 6 hr characteristic timescale in the flaring remains unidentified.
If this interpretation is correct then H flares should be accompanied by correlated X-ray flares; this can readily be tested with simultaneous observations. If such a correlation is not seen then a local flare hypothesis becomes more likely. A possible test of the magnetic recombination flare hypothesis, would be to measure linear polarisation in the H profiles during the impulsive phase of the flares since H and H have been found to be linearly polarised in solar flares [Firstova & Boulatov 1996], with a degree of polarisation 20 percent.
Acknowledgements
RIH would like to thank Kinwah Wu, Mike Garcia and members of the Astronomical Institute ‘Anton Pannekoek’ for constructive discussion on the interpretation of these results. RIH, CAH and PAC acknowledge support from grant F/00-180/A from the Leverhulme Trust. The William Herschel and Jacobus Kapteyn Telescopes are operated on the island of La Palma by the Isaac Newton Group in the Spanish Observatorio del Roque de los Muchachos of the Instituto de Astrofísica de Canarias. This research has made use of the SIMBAD database, operated at CDS, Strasbourg, France and the NASA Astrophysics Data System Abstract Service.
References
- [Acton et al. 1982] Acton L. W., Canfield R. C., Gunkler T. A., Hudson H. S., Kiplinger A. L., Leibacher J. W., 1982, ApJ, 263, 409
- [1] Ball G. H., Narayan R., Quataert E., 2001, ApJ, 552, 221
- [2] Bildsten L., Rutledge R. E., 2000, ApJ, 541, 908
- [3] Blandford R. D., Begelman M. C., 1999, MNRAS, 303, L1
- [4] Bohlin R. C., Savage B. D., Drake J. F., 1978, ApJ, 224, 132
- [5] Casares J., Charles P. A., 1992, MNRAS, 255, 7
- [6] Casares J., Charles P. A., 1994, MNRAS, 271, L5
- [Casares, Charles & Naylor 1992] Casares J., Charles P. A., Naylor T., 1992, Nat, 355, 614
- [Casares et al. 1993] Casares J., Charles P. A., Naylor T., Pavlenko E. P., 1993, MNRAS, 265, 834
- [Catalano & Frasca 1994] Catalano S., Frasca A., 1994, A&A, 287, 575
- [7] Charles P. A., 1998, in Theory of Black Hole Accretion Disks, eds. M.A. Abramowicz, G. Bjornsson, and J.E. Pringle, Cambridge Univ. Press, Cambridge, p. 1
- [8] Dempsey R. C., Linsky J. L., Fleming T. A., Schmitt J. H. M. M., 1993, ApJS, 86, 599
- [Doyle et al. 1987] Doyle J. G., Butler C. J., Callanan P. J., Tagliaferri G., de la Reza R., White N. E., Tores C. A., Quast G., 1987, A&A, 191, 79
- [Edelson & Krolik 1988] Edelson R. A., Krolik J. H., 1988, ApJ, 333, 646
- [9] Eggleton P. P., 1983, ApJ, 268, 368
- [10] Ellison M. A., 1943, MNRAS, 103, 3
- [11] Esin A. A., McClintock J. E., Narayan R., 1997, ApJ, 489, 865
- [Firstova & Boulatov 1996] Firstova N. M., Boulatov A. V., 1996, Sol. Phys. 164, 361
- [Foing et al. 1994] Foing B. H., et al., 1994, A&A, 292, 543
- [Garcia et al. 2000] Garcia M. R., McClintock J. E., Murray S. S., Callanan P., Narayan R., 2000, Poster presented at 2000 HEAD Meeting
- [12] Garcia M. R., McClintock J. E., Narayan R., Callanan P., Murray S. S., 2001, ApJ, 533, L47
- [Gaskell & Peterson 1987] Gaskell C. M., Peterson B. M., 1987, ApJS, 65, 1
- [13] Haswell C. A., 1992, Ph. D. Thesis, University of Texas
- [14] Haswell C. A., Tajima T., Sakai J. -I., 1992, ApJ, 401, 495
- [15] Hjellming R. M., Rupen M. P., Mioduszewski A. J., Narayan R., 2000, ATEL 54
- [Horne & Saar 1991] Horne K., Saar S. H., 1991, ApJ, 374, L55
- [Hynes 1999] Hynes R. I., 1999, Ph.D. Thesis, The Open University
- [Hynes 2001] Hynes R. I., 2001, A&A, submitted
- [16] Hynes R. I., et al., 1998, MNRAS, 300, 64
- [Hynes et al. 1999] Hynes R. I., Roche P. D., Charles P. A., Coe M. J., 1999, MNRAS, 305, L49
- [17] Ichimoto K., Kurokawa H., 1984, Sol. Phys., 93, 105
- [18] Igumenshchev I. V., Chen X., Abramowicz M. A., 1996, 278, 256
- [19] King A. R., 1993, 260, L5
- [20] Lasota J. -P., 2000, A&A, 360, 575
- [21] Massey P., Strobel K., Barnes J. V., Anderson E., 1988, ApJ, 328, 315
- [Montes et al. 1996] Montes D., Sanz-Forcada J., Fernández-Figueroa M. J., Lorente R., 1996, A&A, 310, L29
- [22] Narayan R., Yi I., 1994, ApJ, 428, L13
- [23] Narayan R., Barret D., McClintock J. E., 1997, ApJ, 482, 448
- [24] Nayakshin S., Svensson R., 2001, ApJ, 551, L67
- [25] Oke J. B., Gunn J. E., 1983, ApJ, 266, 713
- [26] Osterbrock D. E., 1974, Astrophysics of Gaseous Nebulae, Freeman, San Francisco
- [Pavlenko et al. 1996] Pavlenko E. P., Martin A. C., Casares J., Charles P. A., Ketsaris N. A., 1996, MNRAS, 281, 1094
- [27] Pavlenko E. P., Kuznetsova Y. G., Shugarov S. Y., Petrov V. S., 2001, in Microquasars, eds. A. J. Castro-Tirado, J. Greiner, J. M. Paredes, Kluwer, Ap&SS, 276 (supplement), 65
- [28] Quataert E., Narayan R., 1999, ApJ, 520, 298
- [29] Rhoades C. E., Ruffini R., 1974, Phys. Rev. Lett., 32, 324
- [30] Sanwal D., Robinson E. L., Zhang E., Colome C., Harvey P. M., Ramseyer T. F., Hellier C., Wood J. H., 1996, ApJ, 460, 437
- [31] Seaton M. J., 1979, MNRAS, 187, 73P
- [Shahbaz et al. 1994] Shahbaz T., Ringwald F.A., Bunn J.C., Naylor T., Charles P.A., Casares J., 1994, MNRAS, 271,L10
- [32] Shahbaz T., Bandyopadhyay R., Charles P. A., Naylor T., 1996, MNRAS, 282, 977
- [33] S̆vestka Z., 1962, Bull. Ast. Inst. Czechoslovakia, 13, 37
- [34] Tajima T., Gilden D., 1987, ApJ, 320, 741
- [35] Tout C. A., Pringle J. E., 1992, MNRAS, 259, 604
- [36] Udalski A., Kaluzny J., 1991, PASP, 103, 198
- [37] Wagner R. M., Kreidl T. J., Howell S. B., Starrfield S. G., 1992, ApJ, 401, L97
- [Wagner et al. 1994] Wagner R. M., Starrfield S. G., Hjellming R. M., Howell S. B., Kreidl T. J., 1994, ApJ, 429, L25
- [38] Wandel A., Peterson B. M., Malkan M. A., 1999, ApJ, 526, 579
- [White & Peterson 1994] White R. J., Peterson B. M., 1994, PASP, 106, 879
- [39] Wu K., Soria R., Johnston H., Hunstead R., 2001, to appear in proc. IX Marcel Grossmann Meeting on General Relativity, World Scientific, astro-ph/0101390
- [40] Zurita C., Casares J., Charles P. A., 2000, in Proc. 19th Texas Symposium on Relativistic Astrophysics and Cosmology, eds. E. Aubourg, T. Montmerle, J. Paul, P. Peter, Elsevier, CD-ROM Edn.