Chandra Observation of the Globular Cluster NGC 6440 and the Nature of Cluster X-ray Luminosity Functions
Abstract
As part of our campaign to determine the nature of the various source populations of the low-luminosity globular cluster X-ray sources, we have obtained a Chandra X-ray Observatory ACIS-S3 image of the globular cluster NGC 6440. We detect 24 sources to a limiting luminosity of erg s-1 (0.5–2.5 keV) inside the cluster’s half-mass radius, all of which lie within 2 core radii of the cluster center. We also find excess emission in and around the core which could be due to unresolved point sources. Based upon X-ray luminosities and colors, we conclude that there are 4–5 likely quiescent low-mass X-ray binaries and that most of the other sources are cataclysmic variables. We compare these results to Chandra results from other globular clusters and find the X-ray luminosity functions differ among the clusters.
Accepted by the Astrophysical Journal
1 Introduction
NGC 6440 is a globular cluster near the center of our Galaxy, at a distance of kpc and reddened by (Ortolani, Barbuy, & Bica, 1994). It is one of the twelve globular clusters in which a bright ( erg s-1) X-ray source has been detected so far. The source in NGC 6440 is a transient, first detected during an outburst which lasted more than a month, in December 1971 and January 1972 (Markert et al., 1975; Forman, Jones, & Tananbaum, 1976). During the outburst, the 2–11 keV luminosity was more or less constant, at erg s-1. A second outburst was detected in August 1998. The observed luminosity was erg s-1 (in ’t Zand et al., 1999) at peak and dropped by a factor of 400 in less than 17 days (Verbunt et al., 2000). A third outburst was recently detected in August 2001 with the All Sky Monitor (ASM) on the Rossi X-ray Timing Explorer and announced by the ASM team at http://xte.mit.edu. A Chandra observation showed the luminosity to be erg s-1 (in ’t Zand et al., 2001). The difference in the properties of the outbursts raises the question whether they were indeed from the same source or different sources, and, if the former, how outbursts of the same source can be so different.
Comparison of optical images of NGC 6440 taken before and during the 1998 outburst show one star that was brighter in , but not in , during the outburst. This star, estimated at and near the end of the outburst, is a viable optical counterpart to the X-ray transient (Verbunt et al., 2000).
Between outbursts, the core of NGC 6440 was detected by the Einstein and ROSAT satellites (Hertz & Grindlay, 1983; Johnston, Verbunt, & Hasinger, 1995). A longer ROSAT observation showed that the core contains (at least) two X-ray sources (Verbunt et al., 2000).
The high incidence of bright X-ray sources in globular clusters is likely explained by the formation of binaries containing a neutron star via tidal capture and/or exchange encounters. In a tidal capture, a neutron star passing close to another star transfers enough of its kinetic energy to the tidal bulge of the other star to keep it bound. In an exchange encounter, a neutron star takes the place of a binary member by expelling it (for a review of these processes, see Hut et al. 1992). To first order, both processes scale with the number of collisions in a cluster, i.e., with the product of the volume of the core (where most close encounters occur) and the square of the number density of stars in the core. NGC 6440 has one of the highest collision numbers, exceeding that of 47 Tuc, according to the best current values of cluster parameters (Table 1). In dense clusters like NGC 6440 and 47 Tuc, the formation of cataclysmic variables is also dominated by close encounters.
In this paper, we describe our observation of NGC 6440 with Chandra, aimed at discovering how many and what type of X-ray sources it contains and at finding out whether any of these corresponds to the star that is a possible counterpart for the 1998 transient. Similar results from Chandra have been reported for the other clusters 47 Tuc (Grindlay et al., 2001a), Cen (Rutledge et al., 2001), NGC 6397 (Grindlay et al., 2001b), and NGC 6752 (Pooley et al., 2001).
2 X-ray Observations and Analysis
NGC 6440 was observed for 23 ks on 2000 July 4 with the Advanced CCD Imaging Spectrometer (ACIS) on the Chandra X-ray Observatory with the telescope aimpoint on the back-side illuminated S3 chip. The data were taken in timed-exposure mode with the standard integration time of 3.24 s per frame and telemetered to the ground in faint mode.
Data reduction was performed using the CIAO 2.1 software provided by the Chandra X-ray Center (http://asc.harvard.edu). We used the CALDB 2.8 set of calibration files (gain maps, quantum efficiency, quantum efficiency uniformity, effective area). Bad pixels were excluded. Intervals of background flaring were searched for, but none were found.
Starting with the raw (level 1) event list, we processed the data (using acis_process_events) without including the pixel randomization that is added during standard processing. This method slightly improves the point spread function (PSF). We then applied the good-time intervals supplied with the standard data products and filtered the data to include only events with ASCA grades of 0, 2, 3, 4, or 6 (this is the “standard” choice that generally optimizes the signal-to-background ratio; see the Chandra Proposer’s Observatory Guide available from the website for more information). We also excluded software-flagged cosmic ray events. We used this filtered event list (level 2) for the subsequent analysis.
2.1 Source Detection
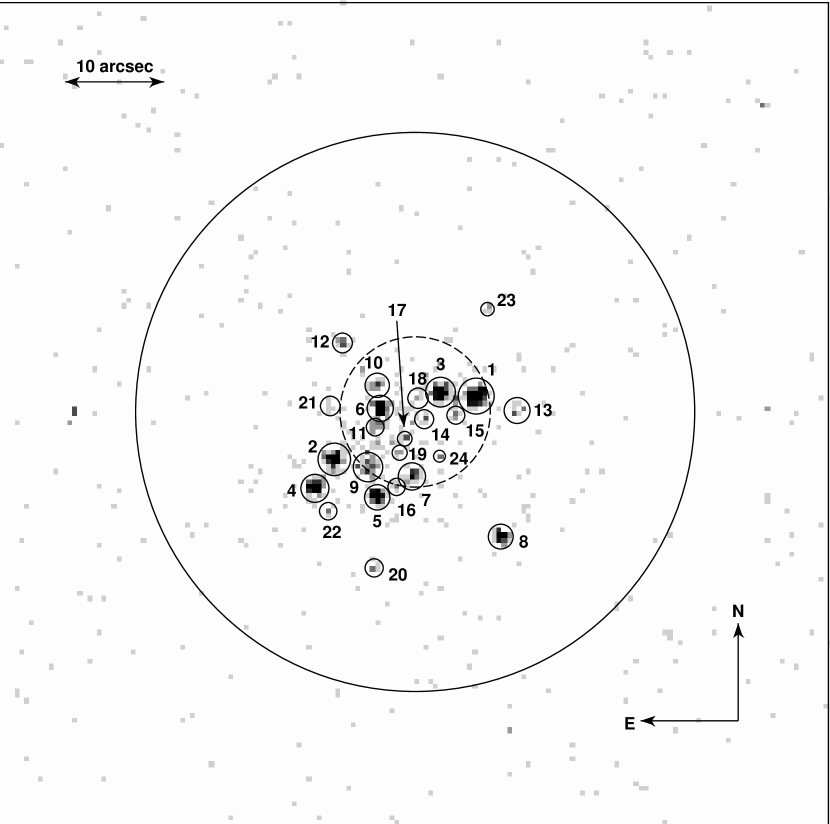
The wavelet-based PWDetect tool (Damiani et al., 1997) was employed for source detection in the 0.5–6.0 keV band. We found 24 point sources within the 282 cluster half-mass radius (Trager, Djorgovski, & King, 1993) and another 64 on the rest of the S3 chip. Table 2 lists the cluster sources. We have numbered the sources in order of detected counts in the 0.5–6.0 keV band. Our detection threshold was 3 counts (10-15 erg cm-2 s-1). The density of sources outside the half-mass radius implies that 0.5 sources within the half-mass radius are not associated with the cluster. This is in agreement with the expected number of background sources from the relationships of Giacconi et al. (2001). All 24 possible cluster sources are consistent with being point sources, with the exception of CX9, which is inconsistent at . It is likely a blend of multiple sources.
A region centered on the core is shown in Fig. 1. The extraction regions for each source are shown, as are circles indicating the core radius (758; Trager et al. 1993) and half-mass radius. We note that there is excess emission in and around the core. The residual count rate (i.e., the total rate minus the rate due to all PWDetect sources) in the 0.5–6 keV band inside a 15″ radius region in the center of the cluster is cts pixel-1 ks-1, which is a factor of higher than the rate from source-free regions outside the cluster. This emission is probably due to many unresolved point sources.
2.2 Astrometry
We have reanalyzed 1.5 GHz data from the Very Large Array (VLA; Napier, Thompson, & Ekers 1983) taken on 1990 April 20 at in A configuration and 1990 July 8 in BnA configuration. We detect three point sources in the region covered by the ACIS-S3 chip (Table 3); their positions are in agreement with the sources found by Knapp et al. (1996) and Fruchter & Goss (2000). The two sources outside the cluster both lie near PWDetect sources. The third source, PSR B174520, falls in between two X-ray sources (CX7 and CX19) in the core of NGC 6440.
Using the two sources outside the cluster to align the frames, we find that a small shift of (03, 01) brings the X-ray and radio positions into agreement for both sources. However, PSR B174520 is still inconsistent with either X-ray source and is thus undetected in this Chandra observation. This is not surprising as its spin-down luminosity is erg s-1 (Taylor, Manchester, & Lyne, 1993). This implies an X-ray luminosity erg s-1 (Verbunt et al., 1996), which is well below our detection threshold of erg s-1.

2.3 Count Rates
We extracted source counts in the following bands: 0.5–1.5 keV (Xsoft), 0.5–4.5 keV (Xmed), and 1.5–6.0 keV (Xhard). The detected count rate was corrected for background, exposure variations, and foreground photoelectric absorption. We make these corrections in order to produce an X-ray color-magnitude diagram (CMD) that can be meaningfully compared to the X-ray CMDs that have resulted from Chandra observations of other globular clusters. In addition, however, attention must be given to differences in detector responses and, of course, exposure times.
The background count rate in each band was estimated from an annulus around the core sources. The inner radius was 31 pixels, and the outer radius was 64 pixels. No detected sources were present within the annulus. The density of background counts in each band (for 23 ksec) was found to be 0.006 counts per pixel (Xsoft), 0.011 counts per pixel (Xmed), and 0.007 counts per pixel (Xhard). The background count rate in the core may be somewhat higher, but even factors of a few greater than this estimate have negligible effects on our analysis.
To account for the 1% variations in exposure among the sources, we applied multiplicative corrections based on the ratio of a source’s average effective area in each of the three bands to the average effective area in the same band of CX12, which had the highest average exposure. The individual effective area curves for the sources were made using the CIAO tool mkarf. The average effective area of CX12 in each of the bands was 580 cm2 (Xsoft), 455 cm2 (Xmed), and 368 cm2 (Xhard).
While the previous corrections were relatively minor (at the few percent level or less), the correction for photoelectric absorption is rather large for NGC 6440. The conversion of optical reddening to column density (Predehl & Schmitt, 1995) gives a value of . We investigated the effects of such an absorption on three characteristic spectra: a 3 keV thermal bremsstrahlung, a 0.3 keV blackbody plus power law with photon index of , and a power law with a photon index of . The effects were most dramatically seen in the Xsoft band, where the absorbed count rate was a factor of 4.8–6.1 lower than the unabsorbed one (depending on the spectrum). Averaging the results of each spectrum in each band, we use the following correction factors: 5.43 (Xsoft), 3.06 (Xmed), and 1.24 (Xhard). Table 2 lists both the observed and fully corrected counts in each band. The effect of the absorption correction on the X-ray color-magnitude diagram (Fig. 2) is a uniform shift of all points 0.48 units on the left axis and 0.64 units on the bottom axis. The top and right axes give the X-ray color and magnitude without this shift (they do, however, include the small corrections for background subtraction and exposure variations).
2.4 Spectral Fitting
We used the CIAO tool dmextract to extract spectra of sources CX1–CX11 in the 0.3–8 keV range. Because even the brightest source (CX1) had relatively few counts, we chose to fit the unbinned spectra using the -statistic in XSPEC (Arnaud, 1996). This statistic is insensitive to the number of counts per bin and is thus a good choice when fitting low-count data. It should be noted, however, that the -statistic is only applicable when the background is negligible, which is the case with these data. To determine the goodness of the fits, we ran Monte Carlo simulations of each best-fit spectrum for each source and compared with the observed spectra. For a good fit, the simulations should give lower values of the fit statistic than the data give about 50% of the time.
Three different models were fit: thermal bremsstrahlung (TB), blackbody plus power-law (BB+PL), and power law (PL). We fixed NH to the value from optical reddening. As expected for such low-count spectra, very few fits could be formally ruled out. We estimated the unabsorbed source luminosities for CX1–CX11 by averaging the results from the three best-fit models for each source. The spread in of the three models was 20% for each source. Fitting a linear relation to these luminosities versus detected Xmed counts, we have estimated the unabsorbed luminosities for sources CX12–CX24 based on their Xmed counts. These are listed in Table 2.

Fitting a hydrogen atmosphere spectral model to the securely identified quiescent neutron star CX1, in ’t Zand et al. (2001) find an X-ray luminosity of erg s-1 in the 0.5–7 keV range. In the 0.5–2.5 keV band, the hydrogen atmosphere model gives , which is 50% more than our estimate. However, the results are consistent with each other within errors.
3 Results and Discussion
As shown in Fig. 1, the sources detected by Chandra are concentrated towards the center of NGC 6440, and all lie well within the half-mass radius of the cluster. This and the estimate that we expect only 0.5 background sources in this region suggests that all sources are cluster members. Because of the large distance and high reddening to NGC 6440, there is little suitably deep optical imaging available. In the absence of optical identifications – with one notable exception discussed below – we try to classify the sources on the basis of their X-ray properties.
In the Galactic disk, cataclysmic variables have X-ray luminosities up to erg s-1 in the 0.5–2.5 keV range (see e.g. Fig. 8 in Verbunt et al. 1997; the single outlier in that figure is the DQ Her type system V1223 Sgr at erg s-1). Low mass X-ray binaries (LMXBs) in the Galactic disk reach higher luminosities, even in quiescence, and have X-ray spectra that are soft (blackbody color temperatures of 0.3 keV). The faintest known quiescent LMXB (qLMXB) with a neutron star has erg s-1 (Cen X-4; Campana et al. 1997), but binaries with a black hole may reach lower X-ray luminosities (e.g., A062000 dropped to 1030 erg s-1, McClintock, Horne, & Remillard 1995). RS CVn systems in the Galactic disk reach luminosities in the range of the sources detected with Chandra in NGC 6440. However, the brightest Chandra sources optically identified with RS CVn systems (in the wide definition which includes BY Dra binaries) in globular clusters have erg s-1 in 47 Tuc, NGC 6397, and NGC 6752, respectively (Grindlay et al., 2001a, b; Pooley et al., 2001).
Bringing this information to bear on the sources in NGC 6440, we conclude that CX1, CX2, CX3, and CX5 are qLMXBs, that CX4, CX6, and CX7 could be either qLMXBs or cataclysmic variables, and that most other sources that we have detected are cataclysmic variables. This is further clarified by comparing Fig. 2 to the X-ray CMDs of 47 Tuc, NGC 6397, and NGC 6752 (Grindlay et al., 2001a, b; Pooley et al., 2001). The X-ray colors of CX1, CX2, CX3, CX5, and CX7 are all 1, as is the X-ray color of the probable qLMXB in NGC 6397 (its listed X-ray color of 2.6 includes multiplication by a factor of 2.5 which Grindlay et al. use to define their X-ray colors and magnitudes). The two probable qLMXBs in 47 Tuc have X-ray colors of 0.6 (again, without the factor of 2.5). In contrast, the brightest CVs in 47 Tuc, NGC 6397, and NGC 6752 all have X-ray colors of 0, and the vast majority of identified CVs in these three clusters have X-ray colors in the range 0.5 to 0.5, suggesting that CX7 is a qLMXB and that CX4 and CX6 are CVs. Because of their relatively soft X-ray colors, CX10, CX12, and CX13 might be quiescent transients with a black hole, but they are more likely cataclysmic variables.
Some of the faintest sources that we detected may be RS CVn systems or millisecond pulsars, which have X-ray luminosities in this range (see Fig. 8 in Verbunt et al. 1997).
CX1 coincides within the positional error with the optical variable V2, the suggested counterpart for the transient in NGC 6440 that went into a short faint outburst in August 1998 (Verbunt et al., 2000). Since CX1 shows the X-ray characteristics of a transient in quiescence, and V2 the optical characteristics (magnitude and color) of such a source in outburst, we consider the identification secure. The transient showed X-ray bursts (in ’t Zand et al., 1999, 2001), indicating that the accretor in CX1 is a neutron star. This association of CX1 and V2 confirms the suggested optical identification (Verbunt et al., 2000) of this first qLMXB to be identified in outburst.
Based on the secure CX1/V2 identification, we shift the optical frame of Verbunt et al. (2000) into the Chandra frame of this observation. After this small (037) shift, we find that CX24 is coincident to 01 with star V0 of Verbunt et al. (2000), a suggested Mira type variable. Since Mira’s are cool giants, they are not expected to be X-ray sources. Remarkably, Belloni, Verbunt, & Mathieu (1998) tentatively identify an X-ray source in the old open cluster M67 with an X-ray luminosity very similar to that of CX24 with a star near the tip of the giant branch (X19/S364 in their Table 3). We therefore do not discard offhand the possible identification of CX24 with V0.

The number of close encounters in a globular cluster scales with , where is the central density of the cluster and its core radius. The number of low-mass X-ray binaries, and the number of cataclysmic variables are both thought to scale with the number of close encounters in clusters with dense cores like 47 Tuc and NGC 6440. This implies that the numbers of these sources in NGC 6440 should be 1.7 times that in 47 Tuc. Two of the 20 X-ray sources in 47 Tuc with erg s-1 are probably qLMXBs, 17 of the other sources are cataclysmic variables, and one is a BY Dra system. The number of 4 or 5 qLMXBs in NGC 6440 is compatible with this prediction, but the number of 19 or 18 cataclysmic variables in the same luminosity range is somewhat lower than predicted. However, the excess flux above background (see §2.1) in and around the core corresponds to a luminosity of erg s-1, and has a corrected X-ray color of 0.5. This emission could be due to unresolved point sources.
At the same time, destruction of close binaries by multiple close encounters depresses the numbers of X-ray sources in the densest clusters, according to theory. From a study of the ROSAT data, Johnston & Verbunt (1996) found that the number of faint sources actually scales with , not , which appears to confirm this prediction. As Chandra data of more clusters become available, it will be interesting to verify this in more detail; the possible relatively low number of X-ray sources in NGC 6440 may be a first hint. However, given the uncertainty in the collision numbers and the possibility of many unresolved sources, we refrain from drawing premature conclusions.
From the ROSAT data, Johnston & Verbunt (1996) also derive a power-law luminosity function with . The Chandra observations have resolved several ROSAT sources into multiple sources and have also detected sources with lower luminosities. As a result, the number of faint sources is already larger in the few clusters observed with Chandra than in the complete ROSAT data set described by Verbunt (2001). We plot the cumulative luminosity functions of four clusters observed with Chandra in Fig. 3. Following the statistical method of Johnston & Verbunt (1996), we derive the best-fit luminosity function by forming the quantities and finding the that most uniformly distributes the along the segment [0,1]. Here, is the limiting to which cluster has been searched, and is the of source in cluster . In order to reduce errors in the analysis due to incompleteness of the sample at the low end of the luminosity range, we have taken each to be 3 times the of the faintest observed source in each cluster and have restricted the data accordingly. We examined the uniformity of the distribution for a range of through Kolmogorov-Smirnov tests. The results of these tests are shown in Fig. 4. The best-fit and the corresponding probabilities of the fits are given in Table Chandra Observation of the Globular Cluster NGC 6440 and the Nature of Cluster X-ray Luminosity Functions.
To further investigate the luminosity functions, we collect in Table Chandra Observation of the Globular Cluster NGC 6440 and the Nature of Cluster X-ray Luminosity Functions the numbers of faint sources detected with Chandra in four clusters, as a function of their luminosity. The surveyed area in each cluster is well within the half-mass radius, and most sources are expected to be associated with the clusters. According to the Johnston-Verbunt result, the number of sources in a logarithmic bin, corresponding to one decade of luminosities, increases by a factor between adjacent bins. Table Chandra Observation of the Globular Cluster NGC 6440 and the Nature of Cluster X-ray Luminosity Functions shows that the current data tend to a somewhat slower increase towards lower luminosities in three of the four clusters. This trend is especially significant in NGC 6397, in marked contrast to the cluster 47 Tuc in which the increase towards lower luminosities is slightly faster than a factor 10 over two bins. In Table Chandra Observation of the Globular Cluster NGC 6440 and the Nature of Cluster X-ray Luminosity Functions we note an anticorrelation between the slope of the luminosity function and the central cluster density. We investigate two possible explanations. First, in the densest clusters, mass segregation may enhance the neutron-star capture rate (e.g., Verbunt & Meylan 1988) and thus enhance the more luminous population of qLMXBs. The numbers of such sources, however, are too small in the clusters observed to strongly affect the luminosity function. Indeed, the numbers in Table Chandra Observation of the Globular Cluster NGC 6440 and the Nature of Cluster X-ray Luminosity Functions show that the difference between NGC 6397 and 47 Tuc, the most and least dense clusters, lies mainly in the low-luminosity sources, i.e., presumably the RS CVn and CV systems. This difference may be due to the destruction of RS CVns and CVs (or CV progenitors) in the densest clusters by encounters with neutron stars. Observations of a larger number of clusters may help in confirming the variation in luminosity function among globular clusters and in explaining it as a function of the initial cluster properties. Chandra observations combined with simulations with the GRAPE-6 (Makino, 2001) could be instrumental in understanding the dynamical evolution of globular clusters.
References
- Arnaud (1996) Arnaud, K. A. 1996, in ASP Conf. Ser. 101, Astronomical Data Analysis Software and Systems V, ed. G. Jacoby & J. Barnes, 17
- Belloni, Verbunt, & Mathieu (1998) Belloni, T., Verbunt, F., & Mathieu, R. D. 1998, A&A, 339, 431
- Campana et al. (1997) Campana, S., Mereghetti, S., Stella, L., & Colpi, M. 1997, A&A, 324, 941
- Damiani et al. (1997) Damiani, F., Maggio, A., Micela, G., & Sciortino, S. 1997, ApJ, 483, 350
- Forman, Jones, & Tananbaum (1976) Forman, W., Jones, C., & Tananbaum, H. 1976, ApJ, 207, L25
- Fruchter & Goss (2000) Fruchter, A. S., & Goss, W. M. 2000, ApJ, 536, 865
- Gehrels (1986) Gehrels, N. 1986, ApJ, 303, 336
- Giacconi et al. (2001) Giacconi, R., Rosati, P., Tozzi, P., Nonino, M., Hasinger, G., Norman, C., Bergeron, J., Borgani, S., Gilli, R., Gilmozzi, R., Zheng, W. 2001, ApJ, 551, 624
- Grindlay et al. (2001a) Grindlay, J. E., Heinke, C., Edmonds, P. D., & Murray, S. S. 2001, Science, 292, 2290
- Grindlay et al. (2001b) Grindlay, J. E., Heinke, C. O., Edmonds, P. D., Murray, S. S., & Cool, A. M. 2001, astro-ph/0108265
- Harris (1996) Harris, W. E. 1996, AJ, 112, 1487
- Hertz & Grindlay (1983) Hertz, P. & Grindlay, J. E. 1983a, ApJ, 267, L83
- Howell, Guhathakurta, & Gilliland (2000) Howell, J. N., Guhathakurta, P., & Gilliand, R. L. 2000, PASP, 112, 1200
- Hut et al. (1992) Hut, P., McMillan, S., Goodman, J., Mateo, M., Phinney, E. S., Pryor, C., Richer, H. B., Verbunt, F., & Weinberg, M. 1992, PASP, 104, 981
- in ’t Zand et al. (1999) in ’t Zand, J. J. M., Verbunt, F., Strohmayer, T. E., Bazzano, A., Cocchi, M., Heise, J., van Kerkwijk, M. H., Muller, J. M., Natalucci, L., Smith, M. J. S., & Ubertini, P. 1999, A&A, 345, 100
- in ’t Zand et al. (2001) in ’t Zand, J. J. M., van Kerkwijk, M. H., Pooley, D., Verbunt, F., Lewin, W. H. G., & Wijnands, R. 2001, ApJ, in press
- Johnston, Verbunt, & Hasinger (1995) Johnston, H. M., Verbunt, F., & Hasinger, G. 1995, A&A, 298, L21
- Johnston & Verbunt (1996) Johnston, H. M. & Verbunt, F. 1996, A&A, 312, 80
- Knapp et al. (1996) Knapp, G. R., Gunn, J. E., Bowers, P. F., & Vasquez Porítz, J. F. 1996, ApJ, 462, 231
- Makino (2001) Makino, J. 2001, in ASP Conf. Ser. 228, Dynamics of Star Clusters and the Milky Way, ed. S. Deiters, B. Fuches, A. Just, R. Spurzem, & R. Wielen
- Manchester et al. (1989) Manchester, R. N., Lyne, Johnston, S., D’Amico, N., Lim, J., Kniffen, D. A., Fruchter, A. S., & Goss W. M. 1989, IAU Circ., 4905, 2
- Markert et al. (1975) Markert, T. H., Backman, D. E., Canizares, C. R., Clark, G. W., Levine, A. M. 1975, Nature, 257, 32
- McClintock, Horne, & Remillard (1995) McClintock, J. E., Horne, K., & Remillard, R. A. 1995, ApJ, 442, 358
- Napier, Thompson, & Ekers (1983) Napier, P. J., Thompson, A. R., & Ekers, R. D. 1983, IEEE, 71, 1295
- Ortolani, Barbuy, & Bica (1994) Ortolani, S., Barbuy, B., & Bica, E. 1994, A&A Supp., 108, 653
- Pooley et al. (2001) Pooley, D., Lewin, W. H. G., Homer, L., Verbunt, F., Anderson, S. F., Gaensler, B. M., Margon, B., Miller, J. M., Fox, D. W., Kaspi, V. M., & van der Klis, M. 2001, ApJ, submitted, also at astro-ph/0110192
- Predehl & Schmitt (1995) Predehl, P., & Schmitt, J. H. M. M. 1995, A&A, 293, 889
- Rutledge et al. (2001) Rutledge, R. E., Bildsten, L., Brown, E. F., Pavlov, G. G., & Zavlin, V. E. 2001, ApJ, submitted, also at astro-ph/0105405
- Taylor, Manchester, & Lyne (1993) Taylor, J. H., Manchester, R. N., & Lyne, A. G. 1993, ApJS, 88, 529
- Trager, Djorgovski, & King (1993) Trager, S. C., Djorgovski, S., & King, I. R. 1993, in ASP Conf. Ser. 50, Structure and Dynamics of Globuler Clusters, ed. S. Djorgovski & G. Meylan, 347
- Verbunt & Meylan (1988) Verbunt, F., & Meylan, G. 1988, A&A, 203, 297
- Verbunt et al. (1996) Verbunt, F., Kuiper, L., Belloni, T., Johnston, H. M., de Bruyn, A. G., Hermsen, W., & van der Klis, M. 1996, A&A, 311, L9
- Verbunt et al. (1997) Verbunt, F., Bunk, W. H., Ritter, H., & Pfeffermann, E. 1997, A&A, 327, 602
- Verbunt et al. (2000) Verbunt, F., van Kerkwijk, M. H., in ’t Zand, J. J. M., & Heise, J. 2000, A&A, 359, 960
- Verbunt (2001) Verbunt, F. 2001, A&A, 368, 137
| Cluster | ( pc-3) | ||
|---|---|---|---|
| 47 Tuc | 4.77 | 23″ | -9.42 |
| NGC 6397 | 5.68 | 3″ | -6.63 |
| NGC 6440 | 5.28 | 76 | -8.75 |
| NGC 6752 | 4.91 | 105 | -7.73 |
Note. — Central density, core radius, and integrated visual magnitude for four globular clusters. Values are from the catalog of Harris (1996) except for the core radii of 47 Tuc (Howell, Guhathakurta, & Gilliland, 2000), NGC 6440 (Trager, Djorgovski, & King, 1993), and NGC 6752 (Trager, Djorgovski, & King, 1993).
| SrcaaSources are numbered according to their detected counts in the 0.5–6 keV band. | RA (J2000)bbNominal Chandra positions from PWDetect. The pointing uncertainty is 0.6″. | Dec (J2000)bbNominal Chandra positions from PWDetect. The pointing uncertainty is 0.6″. | Detected Counts/Corrected CountsccCorrections are described in §2.3. X-ray bands are 0.5–1.5 keV (Xsoft), 0.5–4.5 keV (Xmed), and 1.5–6.0 keV (Xhard). | (erg s-1)ddFor sources CX1–CX11, comes from an average of the unabsorbed luminosities of the best-fit models for each source. A linear relation between and Xmed counts for these sources was derived and used to estimate for sources CX12–CX24 based upon their Xmed counts. Uncertainties for CX1–CX11 come mainly from the spread in from the three best-fit models; the distance and reddening uncertainties are negligible in comparison. For CX12–CX24, the uncertainties are a combination of the -Xmed fit uncertainty and the Poisson uncertainty for each source. | ||
|---|---|---|---|---|---|---|
| Xsoft | Xmed | Xhard | [0.5–2.5 keV] | |||
| CX1 | 17 48 52.163 | 20 21 32.40 | 147/800 | 242/740 | 100/120 | (13%) |
| CX2 | 17 48 53.181 | 20 21 38.78 | 120/660 | 172/530 | 52/65 | (19%) |
| CX3 | 17 48 52.419 | 20 21 32.00 | 82/450 | 115/350 | 34/42 | (14%) |
| CX4 | 17 48 53.320 | 20 21 41.70 | 22/120 | 97/300 | 88/110 | (14%) |
| CX5 | 17 48 52.874 | 20 21 42.61 | 69/380 | 89/270 | 21/26 | (15%) |
| CX6 | 17 48 52.852 | 20 21 33.64 | 21/110 | 68/210 | 59/73 | (30%) |
| CX7 | 17 48 52.625 | 20 21 40.50 | 29/160 | 43/130 | 14/17 | (21%) |
| CX8 | 17 48 51.987 | 20 21 46.57 | 18/98 | 39/120 | 23/29 | (20%) |
| CX9 | 17 48 52.939 | 20 21 39.56 | 14/76 | 33/100 | 25/31 | (20%) |
| CX10 | 17 48 52.874 | 20 21 31.31 | 15/81 | 17/52 | 2/2 | (25%) |
| CX11 | 17 48 52.888 | 20 21 35.53 | 10/54 | 17/52 | 7/9 | (27%) |
| CX12 | 17 48 53.123 | 20 21 27.03 | 10/54 | 12/36 | 2/2 | (39%) |
| CX13 | 17 48 51.870 | 20 21 33.85 | 8/43 | 11/33 | 3/4 | (40%) |
| CX14 | 17 48 52.537 | 20 21 34.73 | 2/11 | 9/27 | 7/9 | (45%) |
| CX15 | 17 48 52.310 | 20 21 34.33 | 2/11 | 8/24 | 6/7 | (47%) |
| CX16 | 17 48 52.734 | 20 21 41.56 | 5/27 | 8/24 | 3/4 | (47%) |
| CX17 | 17 48 52.676 | 20 21 36.70 | 2/11 | 6/18 | 5/6 | (54%) |
| CX18 | 17 48 52.581 | 20 21 32.62 | 3/16 | 5/15 | 3/4 | (60%) |
| CX19 | 17 48 52.712 | 20 21 38.24 | 1/5 | 5/15 | 4/5 | (60%) |
| CX20 | 17 48 52.896 | 20 21 49.85 | 2/11 | 5/15 | 3/4 | (60%) |
| CX21 | 17 48 53.210 | 20 21 33.39 | 2/11 | 4/12 | 3/4 | (67%) |
| CX22 | 17 48 53.225 | 20 21 44.01 | 0/– | 4/12 | 5/6 | (67%) |
| CX23 | 17 48 52.083 | 20 21 23.63 | 1/5 | 4/12 | 3/4 | (67%) |
| CX24 | 17 48 52.427 | 20 21 38.46 | 1/5 | 3/9 | 2/2 | (78%) |
| SrcaaSrc A corresponds to source 2 from Knapp et al. (1996) and src B to their source 3. Src C is PSR B174520; the first Chandra position listed for src C is CX7, and the second is CX19, neither of which is consistent with the pulsar’s position (i.e., the offset is inconsistent with zero within errors). | VLA Position | Chandra Position | Offset | ||
|---|---|---|---|---|---|
| RA (J2000)bbSeconds of time added to 17h48m. | Dec (J2000)ccArcminutes and arcseconds subtracted from 20°. | RA (J2000)bbSeconds of time added to 17h48m. | Dec (J2000)ccArcminutes and arcseconds subtracted from 20°. | After ShiftddThe shift is described in §2.2. | |
| A | 21 | 21 | (, ) | ||
| B | 19 | 19 | (, ) | ||
| C | 21 | 21 21 | (, ) (, ) | ||
| Cluster | A | B | C | K-S Prob. | Ref. | ||||
|---|---|---|---|---|---|---|---|---|---|
| 47 Tuc | 86″ | 33.0 | 5 | 15 | 74 | 4.77 | 99.8% | 1 | |
| NGC 6397 | 119″ | 32.3 | 5 | 8 | 12 | 5.68 | 99.3% | 2 | |
| NGC 6440 | 16″ | 33.0 | 9 | 14 | 5.28 | 96.7% | 3 | ||
| NGC 6752 | 109″ | 32.3 | 7 | 12 | 4.91 | 98.8% | 4 |
Note. — The source with the largest distance to the cluster center provides a measure of the surveyed area. For each cluster, we give this distance , the (logarithm of the) X-ray luminosity (in erg s-1) of the brightest source detected, and the numbers of sources with (A) , with (B) , and (where possible) with (C) . We list the logarithm of the central luminosity density (in pc-3) as given by Harris (1996). We also give the index of the best-fit luminosity function () and the Kolmogorov-Smirnov probability of the fit for the data in Fig. 3.