The Parallax and Proper Motion of RX J1856.53754 Revisited
Abstract
RX J1856.53754, a bright soft X-ray source believed to be the nearest thermally emitting neutron star, has commanded and continues to command intense interest from X-ray missions. One of the main goals is to determine the radius of this neutron star. An integral part of the determination is an accurate parallax. wal01 analyzed Hubble Space Telescope (HST) data and derived a parallax, mas. Combining this distance with the angular radius derived from blackbody fits to observations of RX J1856.53754 with ROSAT, EUVE, HST, pwl+01 derived an observed radius (“radiation radius”), km. This value is smaller than the radii calculated from all proposed equations-of-state (EOS) of dense baryonic matter (hae01). Here, we have analyzed the same HST data and find mas. We have verified our result using a number of different, independent techniques, and find the result to be robust. The implied radius of RX J1856.53754 is km, falling squarely in the range of radii, 12–16 km, expected from calculations of neutron star structure for different equations of state. The new distance also implies a smaller age for RX J1856.53754 of 0.4 Myr, based on its association with the Upper Sco OB association.
1 Introduction
The ROSAT all-sky survey identified six neutron stars that are radio-quiet but bright in the soft X-ray band. These sources, unlike the well studied radio pulsars, lack significant non-thermal emission and are thus excellent candidates for X-ray spectroscopic studies of the atmospheres of neutron stars (for reviews, see m00; ttzc00).
The brightest of these sources is RX J1856.53754 (wwn96). A faint, blue optical counterpart was identified from Hubble Space Telescope (HST) data (wm97). RX J1856.53754 has been intensively studied by most major facilities, especially ROSAT, EUVE, ASCA and HST. The broad-band data can be well fitted by thermal emission from a neutron star, which has resulted in the determination of the effective temperature, eV, and angular radius of the neutron star, (pztn96; pwl+01).
wal01 used HST data spanning three years to measure the astrometric parameters of RX J1856.53754, finding a parallax of mas and a proper motion of at a position angle of (, ).
Combining this parallax with the broad-band modeling yields a radiation radius of km. For the canonical mass of a neutron star, this radius is smaller than the minimum radiation radius of km allowed by General Relativity (lp00). For the radius to exceed the mass has to be less than (pwl+01).
The importance of RX J1856.53754 as a laboratory for dense matter physics has motivated deep observations by Chandra (bzn+01), XMM and the Very Large Telescope (VLT). Results from the first 50-ksec Chandra observations111In early October, 2001, Chandra observed RX J1856.53754 for an additional 450-ksec under the aegis of the Director’s discretionary program. can be found in bzn+01; the blackbody fits are similar to those of pwl+01. Using the VLT, vkk01 discovered an unusual H nebula around RX J1856.53754, from which they infer properties of RX J1856.53754’s energetics and emission characteristics (vkk01b).
Parallax or distance is essential to obtaining the radius, the key physical parameter (since it now appears that X-ray and optical observations yield reliable values for and the angular radius). In view of the perplexing radius inferred from the parallax measurement of W01 we undertook an analysis of the publicly available HST data. Here we present a detailed description of our analysis followed by our measurement of the parallax.
2 Observations, Analysis & Results
We analyzed the publicly available HST/WFPC2 observations described by W01 and wm97; see Table 1 for a log of the observations. As noted by W01, the observations took place near the times of parallactic maximum (3 October and 30 March). RX J1856.53754 is always on the Planetary Camera (PC) detector so we only analyzed those data.
| Epoch | aaThe dither pattern was in sets of four images, with ,(0,0), (0,0), (5.5,5.5), and (5.5,5.5) pixels. | Sky Level | Nominal | bbDefined as the difference between the fitted position angle and the nominal position angle (from the image header and Table 1). | Scale | cc and pixel coordinates of the pointing center, which has and ; see §2.3. | cc and pixel coordinates of the pointing center, which has and ; see §2.3. | |
|---|---|---|---|---|---|---|---|---|
| (UT) | (s) | PA (deg) | (deg) | (mas pixel) | pixels | |||
| 1996 Oct 6 | 4800 | 4 | 0.006 | 129.38 | 0.012(2) | |||
| 1999 Mar 30 | 7200 | 8 | 0.006 | 51.75 | ||||
| 1999 Sep 16ddThe values for this epoch were assumed to be correct. | 5191 | 4 | 0.005 | 124.97 | 0 | 417.948 | 436.803 | |
Note. — See Eqn. 2 for the sense of the transformation.
2.1 Relative Astrometry
We used the effective point-spread function (ePSF) fitting technique to perform the astrometry, as described by ak00. We did not have sufficient numbers of stars to derive our own ePSF for each data set, so we used a previously determined ePSF (from archival data) for the HST/WFPC2 F555W filter. While the parallax data were taken with the F606W filter, we feel that using the F555W ePSF was appropriate, as it was of superior quality to the F606W ePSF that we have (also derived from other data). The difference in ePSFs should not bias the data, as the wavelength dependence of the ePSF is not strong, especially across the nm difference in effective wavelength between the filters. Furthermore, the blue color of RX J1856.53754 brings its ePSF closer to the F555W ePSFs of normal stars. In any case, we also performed the analysis with the F606W ePSF. Since the latter ePSFs were of inferior quality (owing to a less ideal data set), we obtained larger errors, but the results were entirely consistent with those obtained using the F555W ePSF.
We fit the F555W ePSF to the raw images, uncorrected for dithering or cosmic rays. For each epoch, we used a -minimization, as described by AK00, to derive a position for each star in each of the raw images. We corrected this position for the 34th-row anomaly222It is a common error to apply the 34th-row correction after shifting and combining the data. This procedure is incorrect, as the 34th-row correction should be applied to the raw image coordinates and not those that have been shifted and rebinned. (ak99) and geometric distortions in the PC detector using new coefficients (Anderson 2002, in preparation). For each epoch, this yielded four (or eight) positions for each star.
We then solved for the shifts (due to dithering) between the four (or eight) images in a given epoch; these shifts are given in Table 2. We rejected sources which had significantly higher residuals than other sources of their magnitude (see Figure 1), ascribable to the source being extended or saturated. For the remaining sources we used an iterative -clipping (with threshold at 2.5) to reject outlier position determinations. Following this the remaining position measurements were used to derive the average position for each source. The final distortion-corrected source positions in image coordinates as well as the number of accepted measurements are listed in Table 3.
| Epoch | Image | ||
|---|---|---|---|
| Number | (pixels) | ||
| 1996 Oct 6 | 1 | 0.000 | 0.000 |
| 2 | 0.049 | 0.112 | |
| 3 | 5.451 | 5.417 | |
| 4 | 5.416 | 5.270 | |
| 1999 Mar 30 | 1 | 0.000 | 0.000 |
| 2 | 0.022 | 0.115 | |
| 3 | 5.456 | 5.455 | |
| 4 | 5.465 | 5.476 | |
| 5 | 0.066 | 0.142 | |
| 6 | 0.097 | 0.064 | |
| 7 | 5.368 | 5.628 | |
| 8 | 5.399 | 5.532 | |
| 1999 Sep 16 | 1 | 0.000 | 0.000 |
| 2 | 0.159 | 0.027 | |
| 3 | 5.515 | 5.542 | |
| 4 | 5.386 | 5.422 | |
In the limit of a large number of independent observations that are well dithered, the measured rms would have yielded reliable uncertainties. However, we are limited by the meager number of available frames at each epoch. With a maximum of four (or even eight) measurements of each position we were not able to search for systematic errors. Furthermore, the data were taken with non-optimal dithering333For astrometric purposes, a dithering grid is minimal for optimal removal of pixel-phase errors; a 15-point dither pattern is even better. See AK00., with the fractional pixel portions of the dither often repeating from one image to the next (Table 2). This increases the likelihood of systematic pixel-phase errors. We therefore adopted a semi-empirical approach for the measurement uncertainties along the following lines.
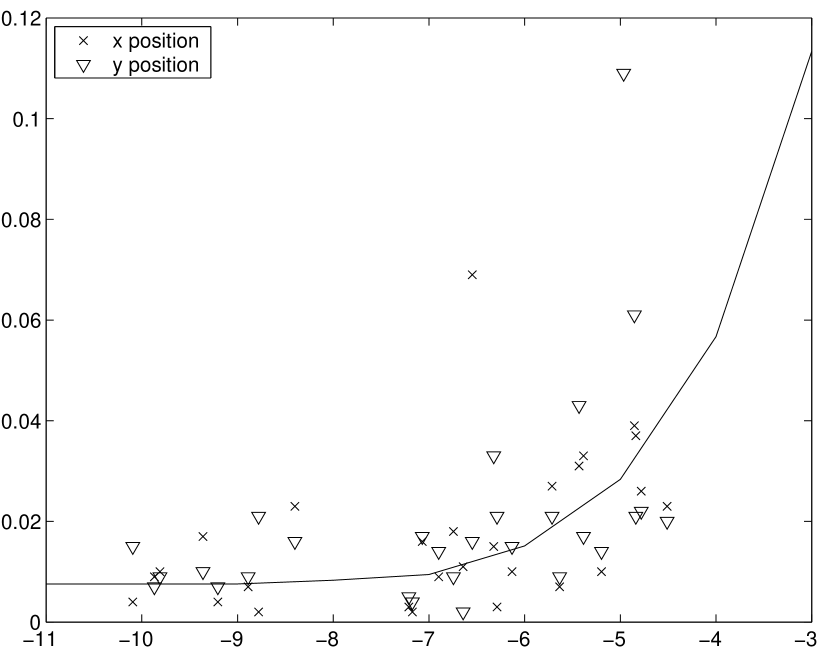
As the first approximation of the uncertainty for each position, we take the rms variation between the positions used to construct the average. As the next level, we used the expected precision in the positions as a function of the signal-to-noise ratio (SNR) of stars. To this end, we utilized an astrometric database that one of us (J.A.) has built up over the last several years. In particular, we used 18 well-dithered PC images that were obtained under similar conditions (filter, background, crowding) to those discussed here. In Figure 1 we display a fit (obtained from the measurements of about 5000 stars) to the astrometric precision as a function of the SNR of stars. The relation from Figure 1 is reasonably well fit by
| (1) |
where (within a pixel area) is the magnitude measured in a single exposure and is the 1-D position uncertainty. For well-dithered exposures, the uncertainty is , as expected (AK00).
We see that the raw uncertainties generally follow the expected trend, but that there is substantial scatter. This is not surprising, given that we may be computing the uncertainties from four or fewer than four measurements. Therefore, in our analysis we use the maximum of the empirically determined uncertainty for an individual star and the uncertainty from the relation in Figure 1 corrected to the appropriate magnitude; the stars that have uncertainties larger than those inferred from this relation do so due to cosmic rays or proximity to bright sources.
The above analysis gives us reliable and accurate measurements of stellar positions, but while these stars are in the background relative to RX J1856.53754 they can still have their own motions that will bias our determinations. Therefore, to have some idea of the absolute motion of the stars in the image, we included in the data measurements of the positions of two slightly extended sources (presumed to be galaxies) present on the HST images (see Table 4). As these sources are non-stellar, we could not use the AK00 technique to measure their positions. Instead we fitted Gaussian profiles and then applied the same distortion corrections as with the other technique. Gaussian fitting is inherently less accurate than ePSF fitting (AK00), but the errors are important primarily for sources that are undersampled by the WFPC2 pixels (i.e. where pixel-phase errors are important). The galaxies were reasonably well resolved ( pixels for source #20, pixels for source #104), so they should not suffer from systematic errors related to undersampling.
| ID | Epoch | ||||||||||
|---|---|---|---|---|---|---|---|---|---|---|---|
| 1996 Oct | 1999 Mar | 1999 Sep | |||||||||
| aaThe number of independent measurements used to determine the mean position; see §2.1. | aaThe number of independent measurements used to determine the mean position; see §2.1. | aaThe number of independent measurements used to determine the mean position; see §2.1. | |||||||||
| (pixels) | (pixels) | (pixels) | |||||||||
| 100 | 3 | 8 | 4 | ||||||||
| 102 | 4 | 8 | 4 | ||||||||
| 103 | 4 | 8 | 4 | ||||||||
| 104 | 4 | 8 | 4 | ||||||||
| 105 | 4 | 8 | 3 | ||||||||
| 106 | 4 | 8 | 4 | ||||||||
| 107 | 4 | 8 | 4 | ||||||||
| 108 | 4 | 7 | 4 | ||||||||
| 110 | 4 | 8 | 4 | ||||||||
| 111 | 4 | 8 | 4 | ||||||||
| 112 | 4 | 8 | 4 | ||||||||
| 113 | 4 | 8 | 3 | ||||||||
| 114 | 4 | 8 | 3 | ||||||||
| 116 | 4 | 8 | 1 | ||||||||
| 117 | 4 | 8 | 3 | ||||||||
| 118 | 4 | 8 | 3 | ||||||||
| 119 | 4 | 8 | 3 | ||||||||
| 127 | 4 | 8 | 4 | ||||||||
| 128 | 4 | 7 | 3 | ||||||||
| 129 | 4 | 8 | 4 | ||||||||
| 201 | 4 | 8 | 4 | ||||||||
| J | 4 | 8 | 4 | ||||||||
| 19 | 4 | 8 | 4 | ||||||||
| 20 | 4 | 8 | 4 | ||||||||
| 21 | 4 | 8 | 4 | ||||||||
| 23 | 4 | 8 | 4 | ||||||||
| 25 | 4 | 8 | 4 | ||||||||
| 26 | 4 | 8 | 4 | ||||||||
| 28 | 4 | 8 | 4 | ||||||||
| X | 4 | 8 | 4 | ||||||||
2.2 Registration of Epochs
To determine the transformation of the background sources (all sources except for RX J1856.53754) between epochs, we proceeded iteratively. Our basic input data set was the 27 stellar sources that had consistent measurements in each epoch plus the two galaxies (§2.1), given in Table 3. The faintest of these sources were as faint as RX J1856.53754, and the brightest were times as bright as RX J1856.53754 (the brightest non-saturated sources on the WFPC2 images). First, we set the fiducial positions of the sources to their measured positions at epoch 1999.7. We chose this epoch as the effects of parallax between it and epoch 1996.8 are minimized (due to similar parallactic angles) and the effects of proper motion between it and epoch 1999.3 are minimized (due to close proximity in time), thus yielding the best matches to the other epochs given the limited information that we have. We assumed that the position angle, scale, and pointing center of this fiducial epoch are known. The pointing center has no impact on the results, and is simply a dummy parameter. The position angle and scale are known to reasonable precision ( for the position angle, and % for the scale). For our nominal values, we take the values from the HST image headers (listed in Tables 1). If these values are wrong at certain levels, they would introduce errors on those levels into our measurements (i.e. if the fiducial scale were wrong by 0.1%, our proper motions would be wrong by the same amount) but these are systematic effects that are well below the measurement precision of the current data.
For our transformation between the epochs, we assumed a simple rotation, scale, and offset. This is valid if the distortion correction (§2.1) removed all nonlinear terms. The transformation equation between the measured positions of star at epoch , , to the celestial position is
| (2) |
where is the plate scale (arcsec per pixel), are the offsets, and is the position angle of epoch , all of which are given in Table 1.
We performed a fit between the fiducial positions and the positions at the three measured epochs, varying the scale, position angle, and offsets of the other epochs. This fit gave relatively large values, due to proper motion between the epochs.
We then fit for updated fiducial positions and proper motions of the background sources based on a linear least-squares technique (for the galaxies, the proper motion was forced to be 0). These positions and proper motions were used to re-calculate the expected positions in the non-reference epochs, which dramatically lowered the values. We iterated this procedure (fitting for the transformation between the epochs, then fitting for the individual positions and proper motions) making sure that the solution was converging. After five iterations, changed by 0.2; we considered the solution to have converged. The results of the fitting (the fiducial positions and proper motions) are given in Table 4.
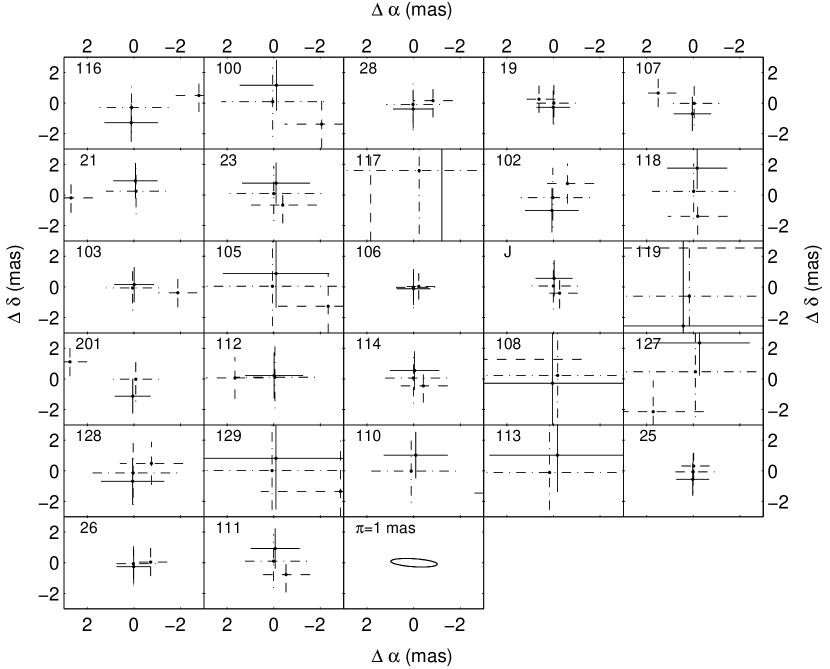
For our analysis we did not fit for the parallaxes of the background sources as they are primarily at distances of kpc (see Appendices LABEL:sec:detl and LABEL:sec:bg). Our final value for the fit was 228 for 50 degrees of freedom. The reduced deviates significantly from 1, indicating that we may be missing some source of error in our analysis. We have determined, though, that the majority of the excess comes from four objects: the stars #21 and #201, and the galaxies #20 and #104. Without these sources, we obtain a value of 56 for 38 degrees of freedom, or a reduced of 1.5. This value is much more acceptable. The question, then, is why these four sources contributed so much to the . For the galaxies, they were not measured with the ePSF technique of AK00, and are therefore subject to systematic errors not addressed here; we only include them to provide an “inertial” reference frame in the analysis. The stars, #21 and #201, are among the brightest of the sources measured (Table 4) and may be among the closest (except for RX J1856.53754, of course). As can be seen from their position residuals (Figure 2) they may have parallaxes of mas and therefore would not be expected to register well. They are also close to extremely bright stars (Figure LABEL:fig:pmbg) that may bias the position measurements. Together, these effects (non-zero parallax and mis-measuring positions) significantly increase the for the fit. Neither of these effects is important for the majority of the stars, which typically have residuals consistent with zero parallax (also see Appendix LABEL:sec:bg). For the results of the registration, the inclusion or exclusion of these sources does not matter.
| IDaaID’s are as in W01 where possible; source 201 was not present in W01; X is RX J1856.53754. | bbPositions are measured at equinox J2000, epoch 1999.26. | bbPositions are measured at equinox J2000, epoch 1999.26. | cc Position offsets at epoch 1999.7, relative to the pointing center, for which our absolute astrometry yields and ; see §2.3. | cc Position offsets at epoch 1999.7, relative to the pointing center, for which our absolute astrometry yields and ; see §2.3. | |||
|---|---|---|---|---|---|---|---|
| (s) | (arcsec) | (mag) | (arcsec) | (mas yr) | |||
| 100 | 34.28 | 29.2 | 25.0 | ||||
| 102 | 34.60 | 21.6 | 24.5 | ||||
| 103 | 34.85 | 16.2 | 23.9 | ||||
| 104ddExtended source, probably a galaxy. | 34.96 | 15.6 | 25.2 | 0 | 0 | ||
| 105 | 35.49 | 20.6 | 26.0 | ||||
| 106 | 35.56 | 24.5 | 22.4 | ||||
| 107 | 34.50 | 42.3 | 23.7 | ||||
| 108eeRejected from the analysis due to poor position measurements; see Table 3. | 35.83 | 46.5 | 25.0 | ||||
| 110 | 36.05 | 45.9 | 25.1 | ||||
| 111 | 37.07 | 28.7 | 24.6 | ||||
| 112 | 36.38 | 23.8 | 23.6 | ||||
| 113 | 36.12 | 33.1 | 23.8 | ||||
| 114 | 35.94 | 30.4 | 24.2 | ||||
| 116 | 33.71 | 35.5 | 24.0 | ||||
| 117eeRejected from the analysis due to poor position measurements; see Table 3. | 34.57 | 22.4 | 25.8 | ||||
| 118 | 34.97 | 25.1 | 24.6 | ||||
| 119eeRejected from the analysis due to poor position measurements; see Table 3. | 35.68 | 23.6 | 25.7 | ||||
| 127 | 35.37 | 48.5 | 26.3 | ||||
| 128 | 35.28 | 47.2 | 24.9 | ||||
| 129 | 35.09 | 43.5 | 26.3 | ||||
| 201 | 36.44 | 21.1 | 20.4 | ||||
| J | 35.32 | 28.7 | 21.0 | ||||
| 19 | 34.22 | 39.4 | 21.9 | ||||
| 20ddExtended source, probably a galaxy. | 35.05 | 38.3 | 23.7 | 0 | 0 | ||
| 21 | 34.81 | 36.4 | 21.0 | ||||
| 23 | 35.20 | 35.4 | 23.8 | ||||
| 25 | 36.51 | 31.3 | 22.0 | ||||
| 26 | 36.84 | 28.9 | 21.5 | ||||
| 28 | 34.89 | 28.9 | 21.7 | ||||
| XffFor proper motions, see Table 5. | 35.60 | 36.2 | 26.1 | ||||
We performed additional analyses to determine how robust our measurements are, and included information from these analyses in the final estimates (see §2.4 and Appendix LABEL:sec:detl).
The deviations of the scales and position angles from the nominal value were small but significant (see Table 1), unlike stated by W01. We find that the scale changed by % from one epoch to another, and that the position angle changed by . This is reasonable, given the fluctuations seen in other WFPC2 observations (due to thermal fluctuations in the detector and telescope assembly; AK00).
2.3 Absolute Astrometry
Absolute astrometry was done relative to the USNO-A2.0 catalog (m98). We first determined centroids for all 571 USNO-A2.0 stars that overlapped with the average R-band image obtained in 2000 using FORS2 on UT#2 (Kueyen) at the Very Large Telescope (see vkk01; the image is composed of 29 exposures of 135 s). We rejected 63 objects that were badly overexposed or had widths inconsistent with them being stellar. Next, the pixel coordinates were corrected for instrumental distortion using a cubic radial distortion function provided to us by T. Szeifert and W. Seifert (1999, private communication). Finally, the zero point position, the plate scale, and the position angle on the sky were determined, rejecting iteratively a further 87 objects for which the residuals to the solution were larger than (inspection of the images showed that virtually all of these were visual doubles, which are blended on the sky survey plates on which the USNO-A2.0 coordinates are based). For the 421 stars that pass our cuts, the inferred single-star measurement errors are in each coordinate, which is line with the uncertainties expected for the USNO-A2.0 catalogue (d99). Thus, we conclude that our astrometry is tied to the USNO-A2.0 system at about accuracy.
We used the solution to determine the positions in the VLT R-band image of 19 stars from Table 4 (for the remaining 7 – objects 105, 106, 112, 113, 118, 127, and 128 – it was not possible to determine accurate positions, either because they were too faint or because they were too close to brighter stars). Using these epoch 2000.3 positions and the fiducial epoch 1999.7 positions derived from the registration of the HST images above, we derived the pointing center for our reference HST image (we corrected for the difference in epoch using the observed proper motions). We solved for zero point offsets only, i.e., the scale and orientation were held fixed to the values listed in the header. The inferred single-star measurement errors are in each coordinate, and the zero-point should thus be tied to the R-band image to better than .444Leaving the position angle and scale free, we find changes of and 0.07%, respectively. The corresponding change in inferred pointing center is . With this pointing center, we determined the absolute positions for all stars listed in Table 4. These should be on the USNO-A2.0 system to about , and on the International Celestial Reference System to about .
2.4 Determination of Parallax and Proper Motion of RX J1856.53754
With the three epochs registered, we compared the positions of RX J1856.53754 in each (see Table 3). We combined the initial estimates of the position uncertainties in quadrature with the uncertainties introduced by the registration. We fit for the proper motion and parallax of RX J1856.53754 using a linear least-squares solution. The locations along the parallactic ellipse at each epoch were determined using the JPL DE200 ephemeris.
As noted in §2.1 and §2.2, our limited number of measurements means that the individual position uncertainties have limited accuracy. Because of this, the uncertainty on the parallax derived from strict statistical considerations (1.7 mas) may not be correct. We have therefore estimated the parallax uncertainty using a variety of techniques (see Appendix LABEL:sec:detl); these techniques have an rms of 0.4 mas, which we add in quadrature to find an rms of 1.8 mas. To be conservative we round this up, finding the overall 1- uncertainty to be 2 mas, similar to the value found by W01.
We present the results of the fitting for , , and in Table 5. We also present the values for the derived parameters of distance and transverse velocity . The best-fit parallax is mas. We can exclude a null-result for the parallax at the level. Our results are inconsistent with those of W01 at the % level. However, our best-fit values for the proper motions are entirely consistent with those presented in W01, and also agree with the orientation of the H nebula (vkk01b).
| Parameter | Best-fit Values |
|---|---|
| aaFiducial positions at epoch 1999.7, relative to offsets given in Table 1. | |
| aaFiducial positions at epoch 1999.7, relative to offsets given in Table 1. | |
| () | |
| () | |
| (mas) | |
| (pc) | |
| () | |
| PA (deg) | |
| () |
Note. — Best-fit values for , , are determined directly from a linear least-squares solution, and errors are 1-/68% confidence. Best-fit values and errors for the other parameters are derived from those for , and .