Clues about the Star Formation History of the M31 Disk from WFPC2 Photometry11affiliation: Based on observations with the NASA/ESA Hubble Space Telescope obtained at the Space Telescope Science Institute, which is operated by the Association of Universities for Research in Astronomy, Inc., under NASA contract NAS5-26555.
Abstract
Over the past several years, the Hubble Space Telescope (HST) has acquired many broad-band images of various regions in the M31 disk. I have obtained 27 such fields from the HST data archive in order to produce color-magnitude diagrams (CMDs) of the stellar populations contained within these areas of the disk. I have attempted to reproduce these CMDs using theoretical stellar evolution models in conjunction with statistical tools for determining the star formation history which best fits the observations. The wide range of extinction values within any given field makes the data difficult to accurately reproduce; nevertheless, I have managed to find star formation histories which roughly reproduce the data. These statistically determined star formation histories reveal that, like the disk of the Galaxy, the disk of M31 contains very few old metal-poor stars. The histories also suggest that the star formation rate of the disk as a whole has been low over the past 1 Gyr.
1 Introduction
Galaxies are mainly classified by the spatial and color distribution of their constituent stars; therefore, understanding the evolution of galaxies requires the comprehension of their star formation histories (SFHs). The determination of such histories for several Local Group dwarf galaxies has been of significant use for understanding the circumstances under which these galaxies formed their stars (e.g. And I Da Costa et al. (1996), And II Da Costa et al. (2000), Carina Mighell (1997), Fornax Buonanno et al. (1999), the Large Magellanic Cloud ((Holtzman et al. (1999)) and (Olsen (1999))), Leo I Gallart et al. (1999), Leo A Tolstoy et al. (1998), NGC 185 Martínez-Delgado et al. (1999), Sculptor Monkiewicz et al. (1999), Sextans A Dohm-Palmer et al. (1997), Ursa Minor Mighell & Burke (1999), WLM Dolphin (2000a), and many others). One important example is the relatively recent discovery that the cluster formation history and the field star formation history of the Large Magellanic Cloud show significant differences, forcing a re-evaluation as to how star cluster formation and field star formation compliment each other in the evolution of galaxies. Measurements of the SFHs for Local Group dwarf spheroidal galaxies have also proven interesting, showing that these objects, once thought to contain a nearly coeval population, actually have rather diverse evolutionary histories. These observed histories have been useful to compare with SFHs that come from models of the Local Group to understand the effects of, for example, tidal strirring, on galaxy evolution (e.g. (Mayer et al. (2001))). Ideally one would like to generate similar measurements of the star and cluster formation histories of the large, more complex, spiral galaxy M31; however, such a project is daunting due to M31’s distance, size, inclination, and internal reddening.
Due to the seeing limitations of ground based observations of M31, deep photometry of its stellar populations was impossible before the technology of space telescopes. Integrated photometry provided some interesting information. For example, de Vaucouleurs (1958) found the integrated color of the disk to be quite red (B-V 0.9), suggesting that it was either heavily reddened or old or both. The limitation of achievable depth for stellar photometry meant that only the most recent star formation was able to be understood. Much stellar photometry has been performed on the brightest stars (see references in (Hodge (1992))). More recently, the photometry of brightest stars in many regions of the galaxy has been determined to the best of the ability of ground based instruments by the studies of Massey (1998), Hodge & Lee (1988) and Magnier et al. (1997). These studies of the M31 disk population were limited in their conclusions to the similarity of the most recent star formation history across the disk from the upper main sequence (MS) luminosity function Hodge & Lee (1988) and some evidence for spiral density wave propagation across the southern half of the M31 disk from Cepheid age determinations Magnier et al. (1997). Williams & Hodge (2001b), using HST, found that the ages of some of the largest clusters in the southern region of the M31 disk were consistent with the ages of the field Cepheids, providing further clues into the evolutionary history of the M31 disk.
There has been a strong effort to use the abilities of the Hubble Space Telescope in order to probe the older stellar populations in M31 and the stellar populations of the star clusters in M31 in an attempt to constrain M31’s star and cluster formation histories. Holland et al. (1996) found evidence for multiple populations in the M31 halo using deep V and I band WFPC2 photometry, showing that this kind of work is possible with the resolution of HST. Futher progress has been made very recently with work by Sarajedini & Van Duyne (2001) who found strong evidence for a thick disk population in an HST field at a smaller galactocentric distance than that studied by Holland et al. (1996). While all of these studies were able to put useful broad constraints on the general properties of the populations in these fields and clusters, they did not provide a statistically determined SFH for the fields.
In this paper, I make a step toward understanding the field star formation history of M31 using the deepest photometry available from the HST archive. I perform photometry on 27 WFPC2 fields taken from the HST archive: 13 fields in B and V and 14 fields in V and I. I apply a statistical analysis to the stellar photometry, comparing the color-magnitude diagrams to CMDs generated from theoretical stellar evolution models in order to find the best fitting SFH for the fields. The results provide peeks at the SFH of the disk as a whole through the limited field of view of HST. Section 2 describes the method used for finding and retrieving the photometry from the fields, including artificial star tests. Section 3 describes how I use this photometry to determine the most likely SFHs of the fields. Section 4 discusses the many experiments which were done in order to find the SFH which best reproduced the data. Section 5 presents the results from the 27 fields including the similarities and differences of the SFHs in different regions around M31. Finally, section 6 gives some general conclusions which may be drawn from the results.
2 Data Acquisition and Reduction
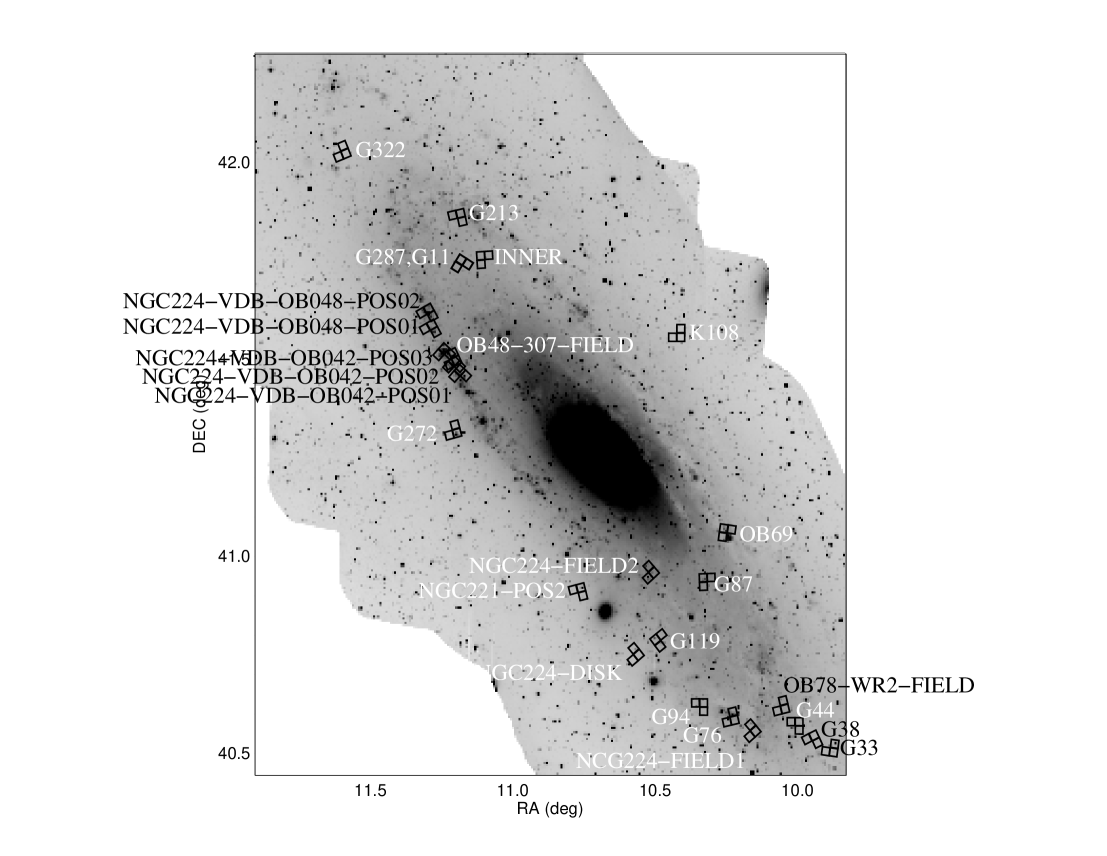
I searched the HST archive for all exposures longer than 60 seconds which were taken through the broadband B (F439W), V (F555W), and I (F814W) filters pointing within 1.5 degrees of the M31 nucleus. Using this narrow radius kept the data contained within the disk, avoiding significant halo contamination. Any fields in the bulge were later excluded by eye. I acquired and reduced 27 WFPC2 fields from the HST archive, each observed through either the B and V broad-band filters or the V and I broad-band filters. These field were put together using the data listed in Table 1 (electronic version only), which gives the field name, proposal identification number, RA, DEC, date, bandpass, and exposure time for each image taken from the HST archive. The westernmost field in the sample was the only one taken outside the 1.5 degree cutoff because it was located near the major axis 2 degrees to the southwest of the center of the galaxy, allowing a comparison of the outer and inner disk populations. The positions of these fields on the galaxy are shown in Figure 1. This figure shows an H mosaic of the M31 disk Winkler & Williams (1995) with the positions of 26 of the fields (the OUTER field is off the image to the southwest) marked with squares showing the positions of the WF1, WF2, and WF3 chips in the field. In order to avoid special objects often contained in the PC of each field, I excluded the PC data from the analysis. I also excluded the WF3 chip of the G272 field, since a large portion of it was contaminated by a saturated bright star. Each field is labeled with the name it was given in Table 1 (electronic version only). These names were taken from the image header field TARGNAME when the images arrived from the data archive. The random distribution of most of the fields suggest that conclusions can be drawn reliably and are not likely due to selection effects.
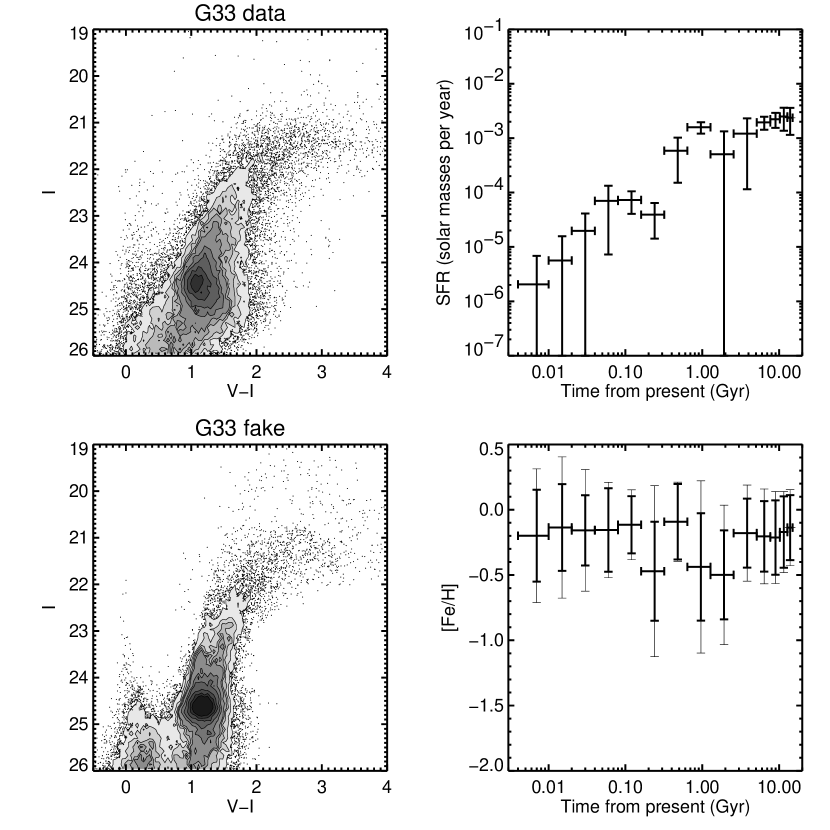
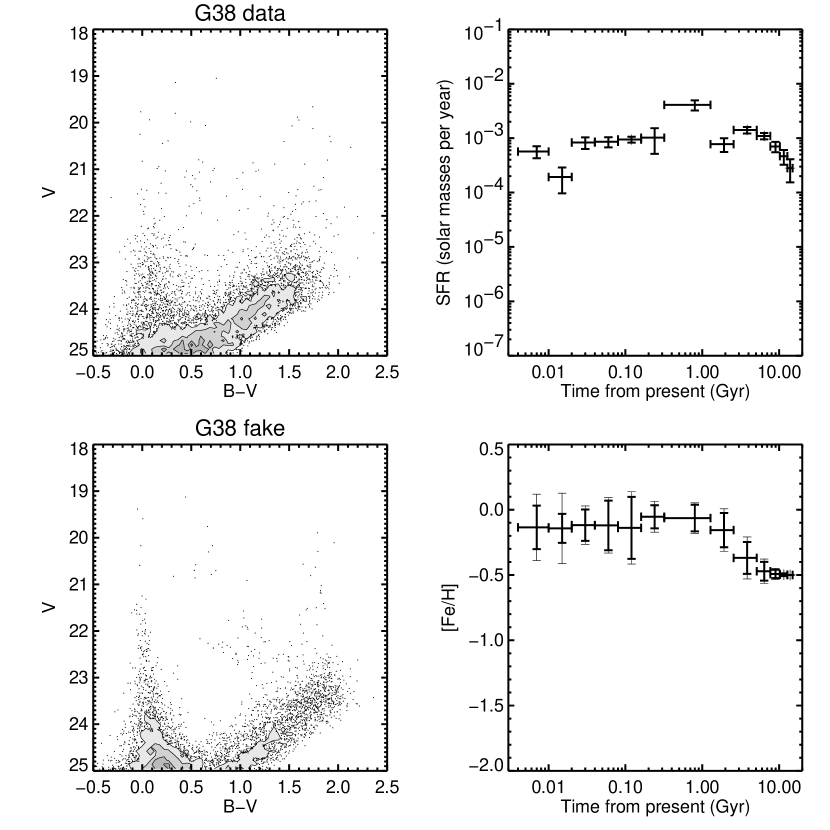
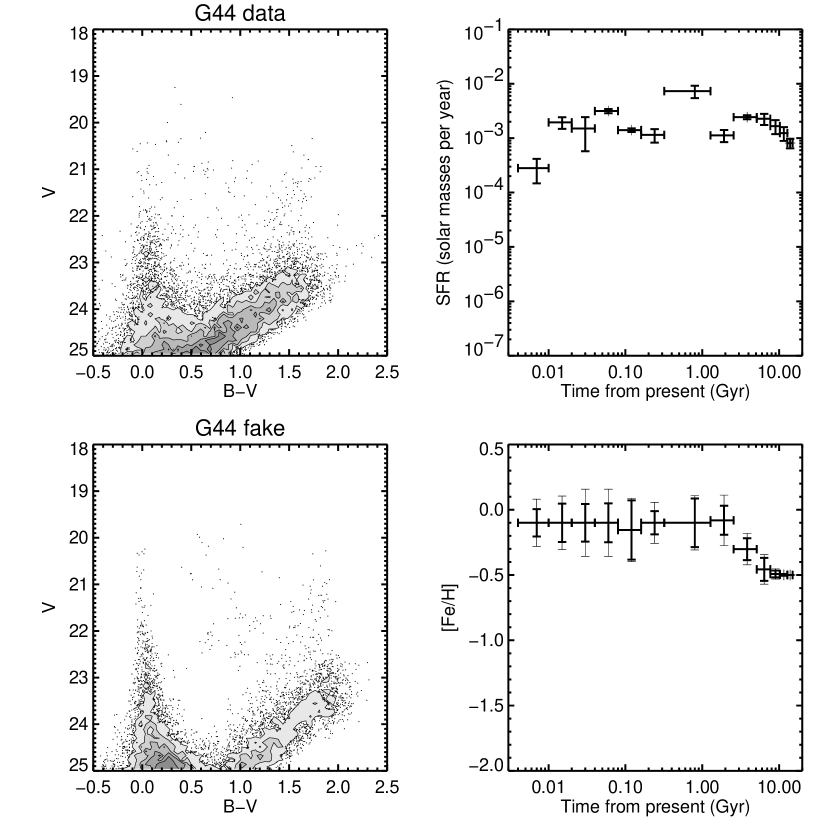
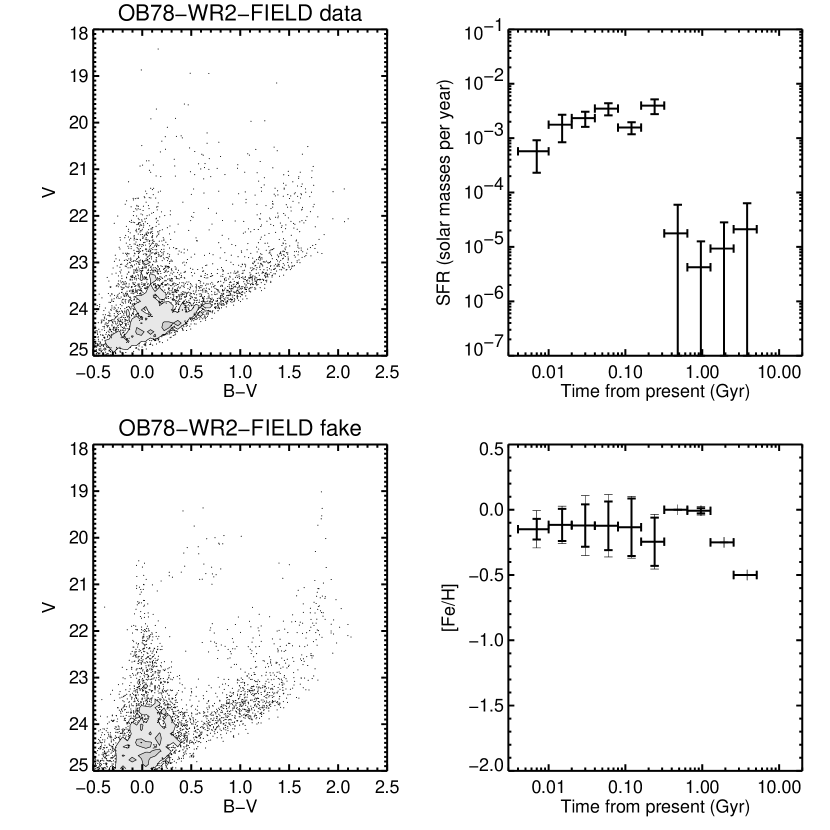
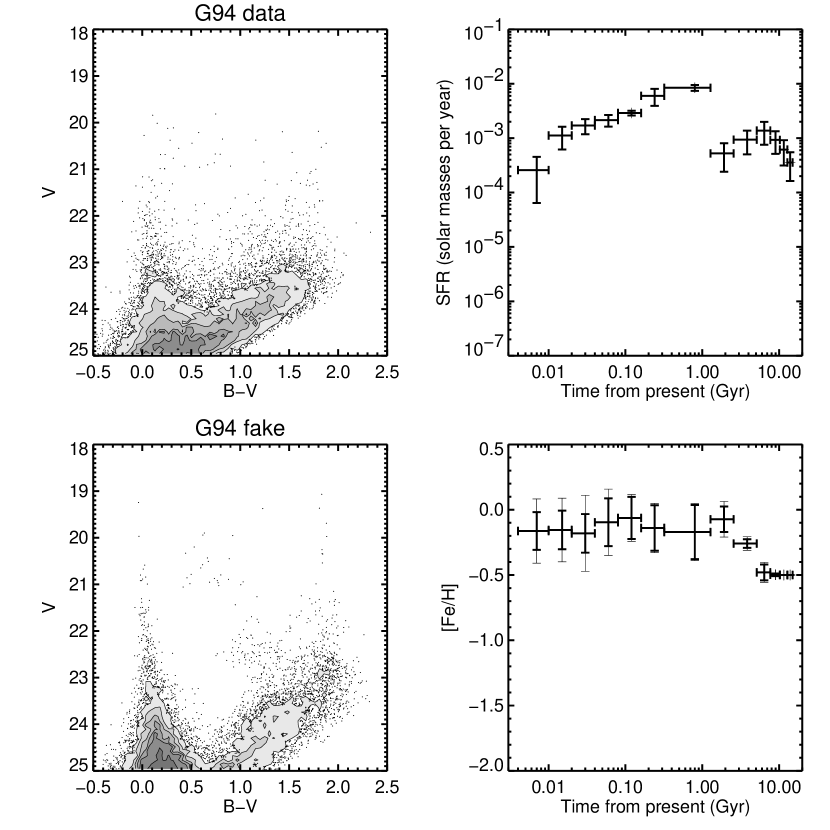
I determined the Johnson B, V and I magnitudes of the stars in these frames using the automated photometry routine HSTPHOT Dolphin (2000b) which is optimized for detecting and measuring magnitudes of stars on undersampled images like those taken with the WFPC2 camera. This photometry package disregards all saturated and hot pixels using the data quality image provided by the data archive and simple statistical tests. Then it uses the stars in the frame to make minor adjustments to a well-sampled, previously determined point spread function (PSF). This PSF is then fit to the brightness peaks in the data. Objects that fit the PSF are classified as stars and their instrumental magnitude is measured. These instrumental magnitudes are finally converted to final ground based B, V, and I magnitudes by applying aperture corrections determined for the PSF using photometry from less crowded fields, applying a charge transfer efficiency correction depending on chip position, and applying the transformation equations and zero-points determined by Holtzman et al. (1995). The CMDs obtained from the final photometry for these fields are shown in the upper left panels of Figure 5 (a-z, aa-ac; some parts are electronic only).
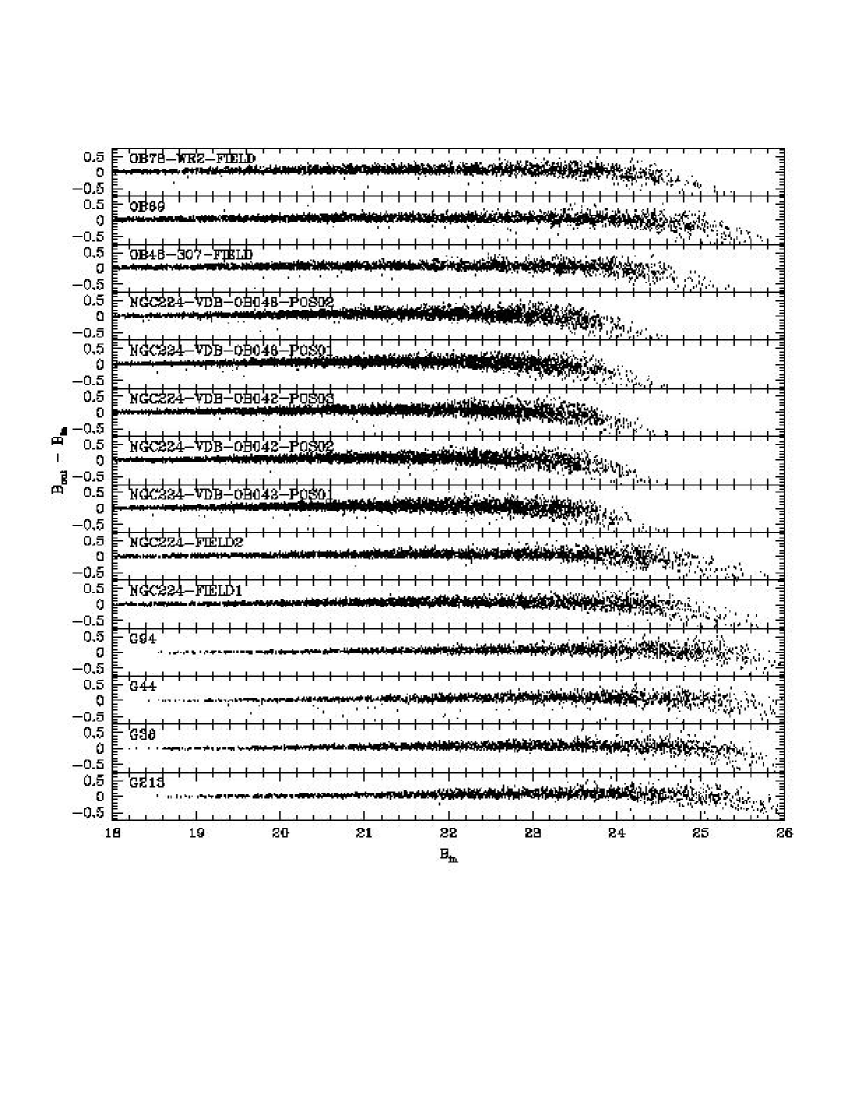
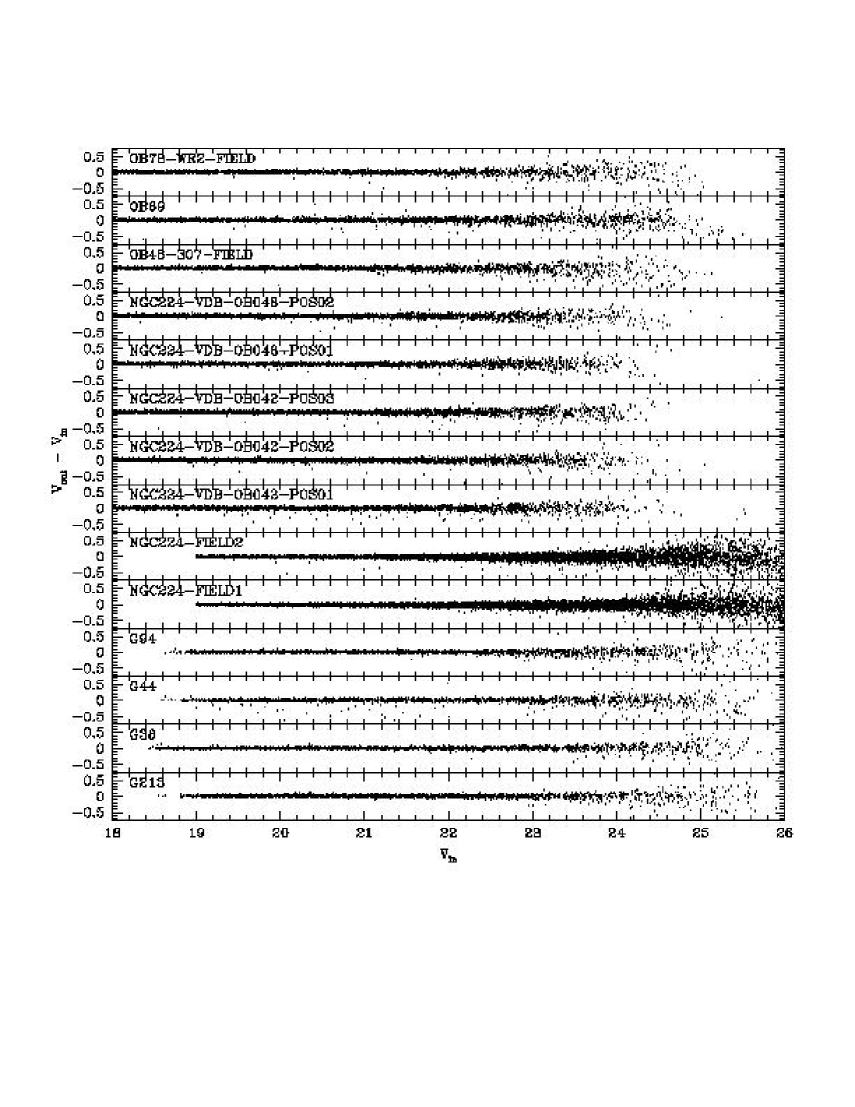
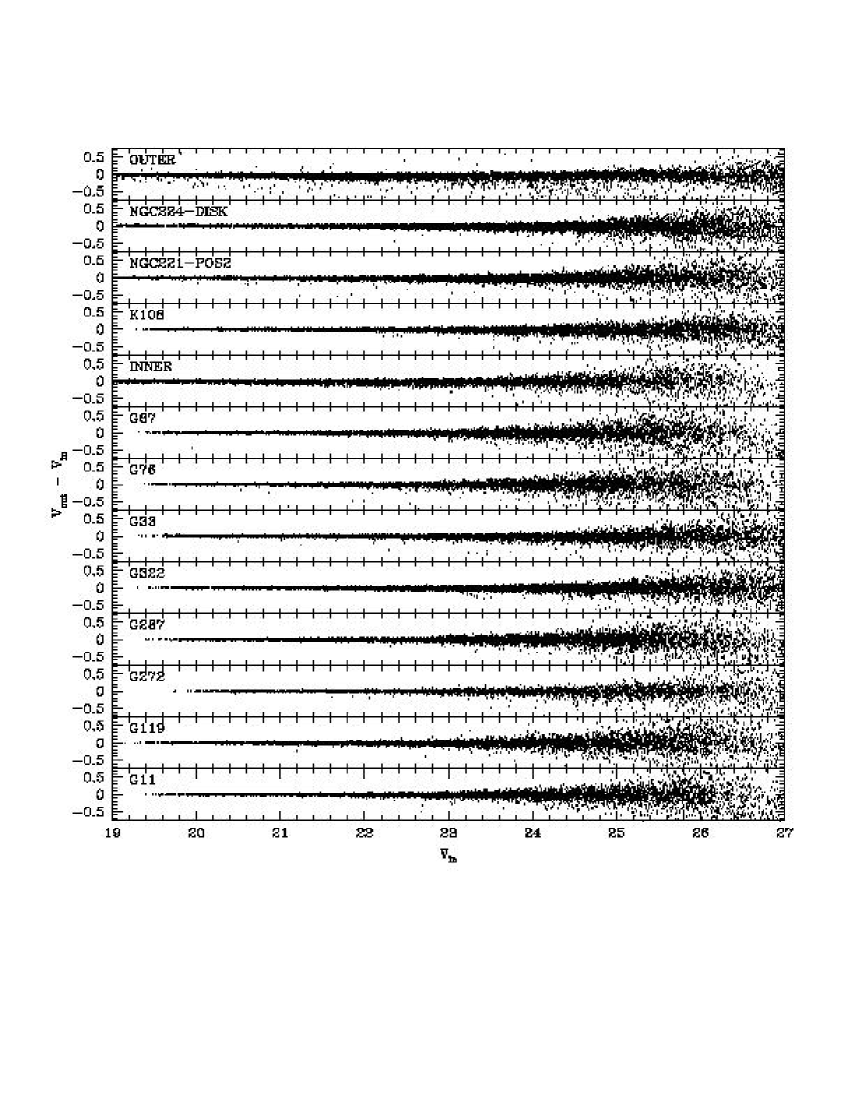
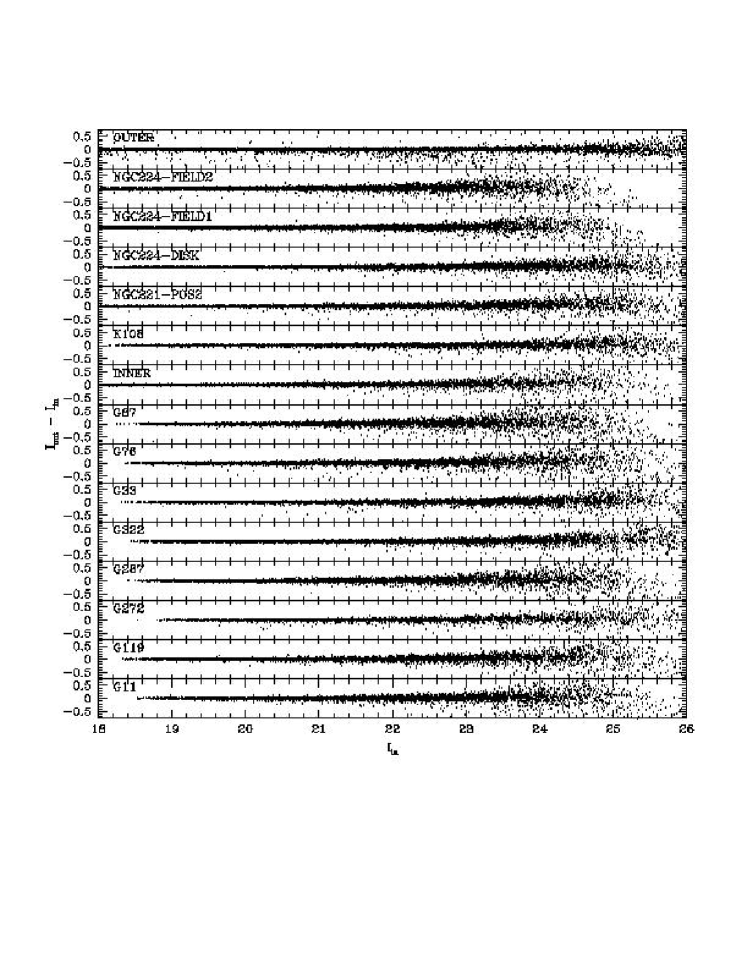
Once the photometry had been measured, artificial stars were added to the image and the photometry routine was run on the image again in order to determine the completeness and photometric errors as a function of magnitude. The results of the artificial star tests for each field are shown Figure 2 (or Figures 2a-2c, electronic version only); since the artificial star tests were run iteratively, there were hundreds of thousands of artificial star results. Each figure shows a random sampling of 1 percent of these results in order to keep the figure easy to interpret. The M31 disk is a complex background with which to work and therefore limits the accuracy of the photometry by increasing the uncertainty of the local background level. This uncertainty is partially due to the Poisson noise of the higher background levels, but it is also due to actual structure in the background on spatial scales relevant to stellar photometry. These surface brightness fluctuations likely come from crowded, faint stars in disk which cannot be resolved by HST; dust can also contribute to these fluctuations. The artificial star tests showed that despite these problems, HST is capable of supplying photometry accurate to 0.2 magnitudes at , and . I found that, since the V-band images were usually deeper than the B-band, the B-band artificial stars at the faint end in the B-band were only picked up when they appeared on noise spikes. This effect resulted in the faint stars being measured to be bluer in B-V, causing the faint blue tail seen in the V, B-V CMDs in Figure 5.
3 Determining Star Formation Histories
I determined the SFH and chemical evolution history which best reproduced the CMD for each field using the statistical CMD matching package MATCH Dolphin (1997). This recently developed software uses a technique pioneered by earlier, non-computationally intensive work on stellar populations in the Magellanic Clouds (e.g. Gallart et al. (1996)) in which the CMD of the stars was broken down into bins of color and magnitude. These binned CMDs are also known as Hess Diagrams. Before powerful computing was possible, these bins were chosen to isolate populations of differing ages and metallicities, and based on the relative number of stars in each bin, a rough measurement of the star formation and chemical enrichment histories of the field could be made. MATCH takes this concept to its full potential by using the most recent computing power to create high-resolution Hess Diagrams of rectangular bins of constant size specified by the user.
Once the CMD of the data has been transformed into a Hess diagram, the software uses the stellar evolution models of Girardi et al. (2000) to create a unique Hess diagram for each of a range of stellar ages and metallicities. These model-based diagrams are produced by populating the CMD along the theorectical isochrone of each metallicity and age, assuming a 1 star formation rate and a Salpeter initial mass function (IMF) and taking into account the completeness and photometric errors in each bin of the CMD as measured from the artificial star tests on the real data. The program then finds the linear combination of model-based Hess diagrams which best reproduces the Hess diagram of the observed stars for each of a range of reddening and distance values. Since each model-based diagram was created assuming a 1 star formation rate, the coefficients of this linear combination provide the star formation history in units of . Finally, the statistically best fits for each distance and reddening value are weighted by goodness of fit to determine values and errors for the most likely distance and extinction to the field as well as values and errors for the star formation rates and metal abundance spreads during each time period explored. Finally, in order to check the viability of the result, the package can be used to create a synthetic CMD from the stellar evolution models by populating the theoretical isochrones using the assumed IMF along with the derived best fit for the metallicities and star formation rates for each time period, taking into account the best fit distance and reddening values for the field. The artificially generated CMD can then be compared to the observed CMD in order to verify that the statistically determined SFH creates a stellar population similar to the observed population.
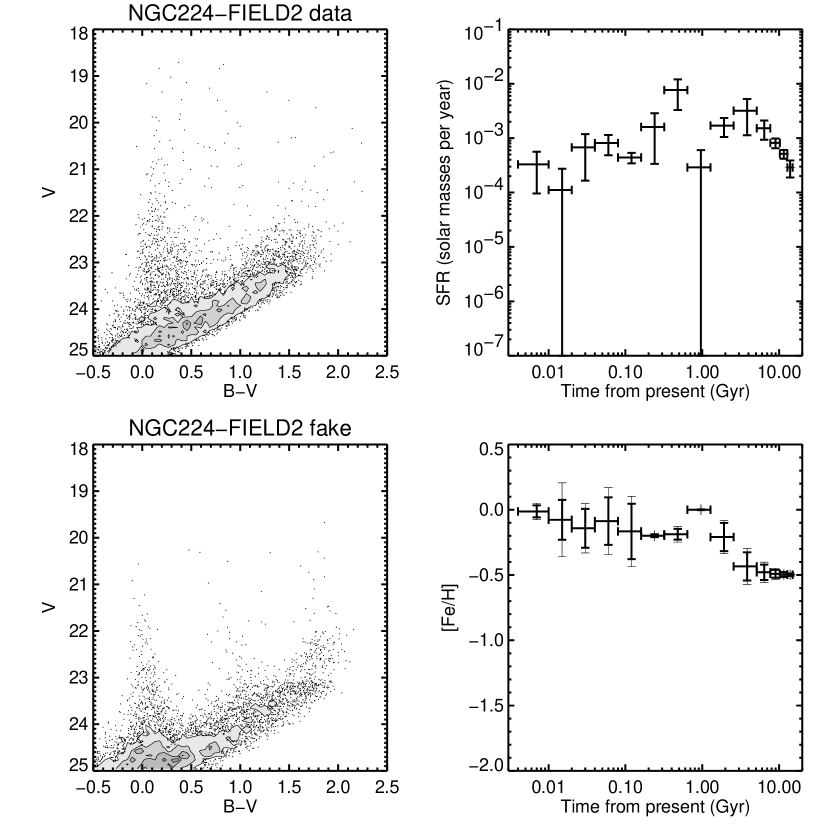
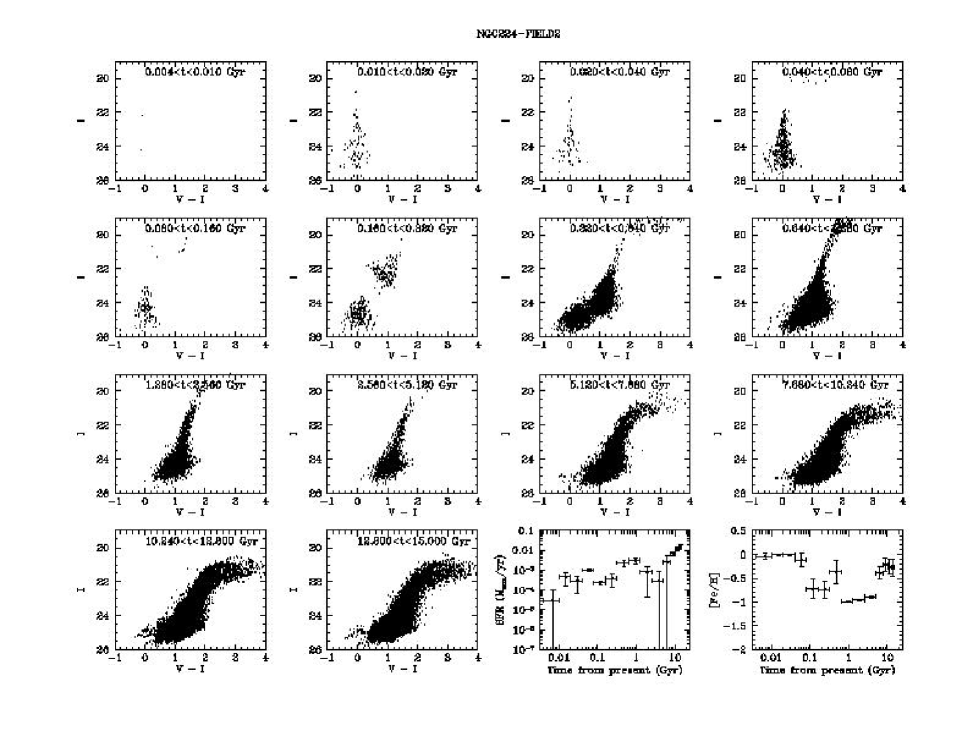
I have created artificial CMDs for each timestep individually for one of the fields which was observed in B, V, and I (NGC224-FIELD2). I show these CMDs along with the SFHs which created them in Figures 3a and 3b. These CMDs show how the different areas of the CMD are populated by the different age groups. Figure 3a shows the areas of the V, B-V CMD which are filled in by the different timesteps. It shows that the V, B-V CMD is not reliable for determining the early star formation rate of the field (1 Gyr). Due to the poor sensitivity of WFPC2 in the blue, the red giant branch (RGB) is not well sampled in this color so that the SFH of the old stars cannot be reliably constrained. On the other hand, the I, V-I CMDs are quite sensitive to the older population. These CMDs provide more reliable constraints on the early star formation rate, and they also show a recent SFH consistent with that determined from the B and V photometry, as discussed in section 5.2.
4 Discussion
There was one serious problem with attempting to recreate the photometry of these disk fields: the spread in extinction values surely present due to the stars within a given field residing at different positions in the disk. Since some of the stars in these fields were more heavily extincted than the others, the photometric errors upon which the MATCH software was basing its statistics were only part of the true scatter in the CMDs. I ran many experiments using the MATCH software in order to find the optimal parameter sets for these fields. The experiments were run using different parameter combinations on the same dataset in order to find the parameters whose resulting artificial CMD appeared to match the strongest features of the observed CMD for that field. In order to force the program not to output non-physical chemical evolution and SFHs by fitting the stars scattered about the strong features of the CMD, I was forced to place limits on the parameter space by iteratively running the MATCH software, limiting the parameter space as I went along.
First I noticed that exploring a large range of distances and reddening values led to problems. With such freedom of parameter space it was not possible for the software to untangle the competing effects of distance, reddening and metal abundance. Differential reddening could cause the software to find non-physical fits to the scatter of stars to the red and blue of the RGB which are surely MS and RGB stars with extinction well above the mean. To stop the software from trying to fit these stars, it was necessary to limit the ranges of distances and reddening values used for the fits attempted by the software. This limitation made it impossible for those areas of the CMD to be fit, forcing the software to find the best fit possible without considering the bulk of the heavily reddened stars. In order to perform this limitation of parameter space in a logical fashion, I used knowledge of the reddening values for the fields in the arms (all fields observed in B and G76) from studies of the star clusters Williams & Hodge (2001a), knowledge of the foreground reddening from Galactic reddening maps Burstein & Heiles (1982) and the relatively well constrained distance to M31 to set tight constraints on these free parameters. I allowed distance moduli from 24.35m-M24.55. This small range allowed the software to accomodate any slight systematic shifts in the positions of the strongest CMD features, while forcing the distance to be consistent with published measurements. We were not interested in using these data to measure the distance to M31. Instead, we used the well-constrained previous distance measures to M31 to limit the parameter space searched by the software. The distance moduli all came out the same within the errors, which showed that our photometry was very consistent and that the statistical fits were working. I allowed extinction values from 0.1A0.8 for the interarm fields and from 0.1A1.2 for the fields within the arms. The distance and reddening values determined for the fields are given in Table 2.
More experiments also showed that it was necessary to restrict the metallicity range the software could explore. I found that most results on a given set of stars contained the same basic star formation history, but that the metallicity range which I allowed the software to search had a significant impact on the resulting artificial CMD. For example, if the metallicity parameters were too broad, the best fitting chemical evolution history would often be discontinuous, containing large metallicity jumps in the abundance history which could not be physical. These jumps were likely providing the best fit to the few stars scattered to the blue of the RGB, but these seemingly impossible results always created patterns in other parts of the artificial CMD which did not appear in the data, such as gaps in the RGB. Since the old stellar components in the formation history were statistically best fit by a metal rich population ([Fe/H] -0.5), I found better artificial CMDs were created from fits which did not allow the metallicity to drop below -1.0 dex, stopping the metallicity from jumping around too drastically. This limitation was imposed on the parameters only after experiments allowing lower metallicities showed that the best-fit abundances of the oldest stars were only a few tenths below solar. The need to restrict the chemical evolution parameters to the metal-rich end provides the first hint that the M31 disk, like that of the Galaxy, contains very few old metal poor stars.
As a final experiment for discovering the accuracy of the SFH measurements, I created a set of artificial star photometry with a constant star formation rate and a linear increase in metallicity from [Fe/H] = -2.0 at t = 15 Gyr to [Fe/H] = -0.1 at t = 0.1 Gyr. I ran this artificial photometry through the SFH software. The results are shown in Figure 4. Panels (a) and (b) show the results on the experimental field before the differential reddening was added. In this case, the analysis routine was sensitive to the old metal poor population; however, it found the recently formed stellar population to be [Fe/H] -0.5 instead of solar. This result confirmed my suspicion that I could not accurately determine metallicities from the upper MS. Panels (c) and (d) show the results when I altered the artificial photometry by giving each star a unique reddening value, , away from the mean reddening for the field. Fortunately, the resulting SFH was not significantly altered from the input history. In both cases, the program found a nearly constant star formation rate and the old metal poor population. This result gave me further confidence that the routine was finding useful SFHs, even though the abundances were a more difficult problem. In the case with the simulated differential reddening, the program was even farther from the correct metal abundances for the most recent star formation.
These experiments revealed that the abundances determined for the most recent star formation (100 Myr) were not robust since the color of the upper MS is not sensitive to metallicity. Also, the region of the CMD used to determine star formation rate and metal abundance for the most recent time periods was often sparsely populated, meaning that the metal abundance determination for these periods was based on small number statistics. Therefore, in many cases, I artificially increased the abundances of the most recently formed stars in order to avoid non-sensical jumps in the abundance history and in order to be consistent with spectra of M31 HII regions and supernova remnants which show that recently formed stars in the M31 disk are formed from gas with abundaces similar to that of the Orion nebula Blair et al. (1982). This artificial increase in metal abundance for the most recent time periods had the only effect effect on the resulting artificial CMDs of removing an unobserved clump of stars from above the observed tip of the RGB in the V, B-V CMDs. The increase had no noticeable effect on the artificial I, V-I CMDs.
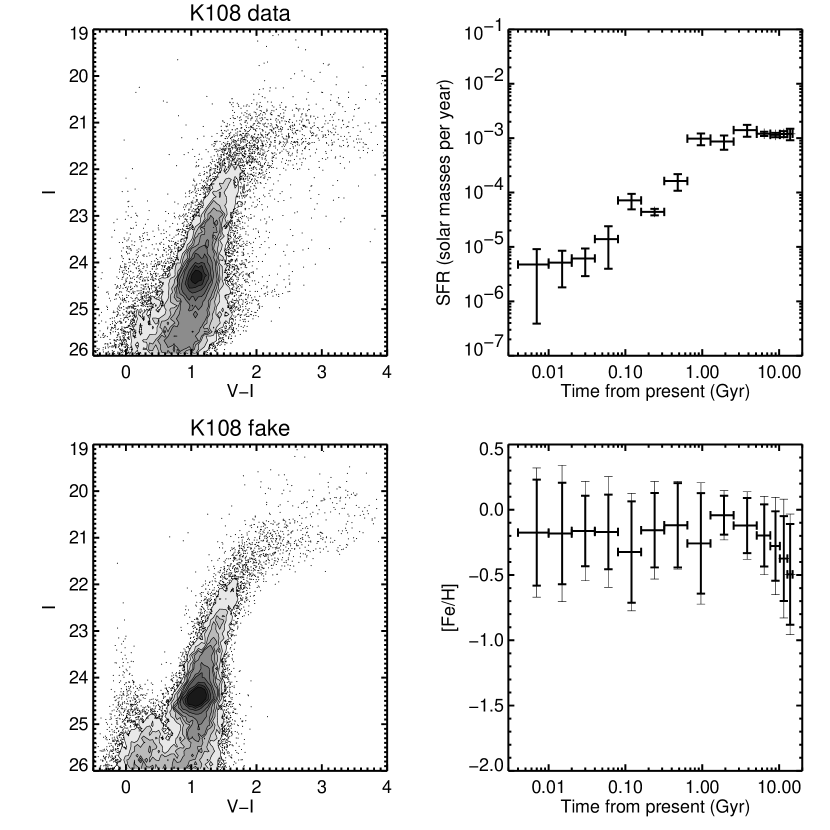
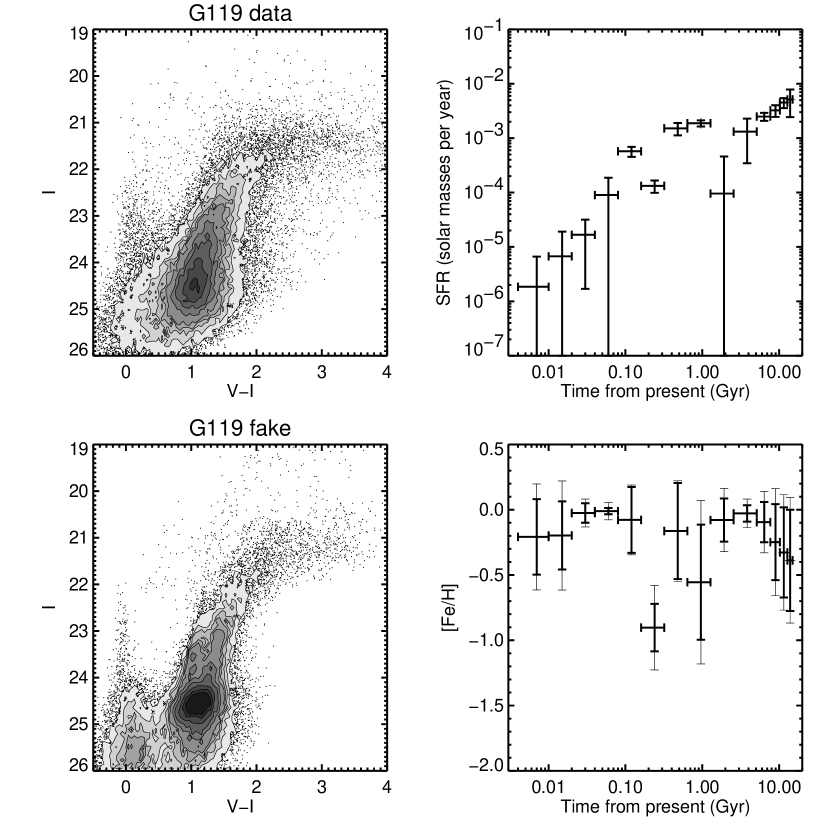
5 Results
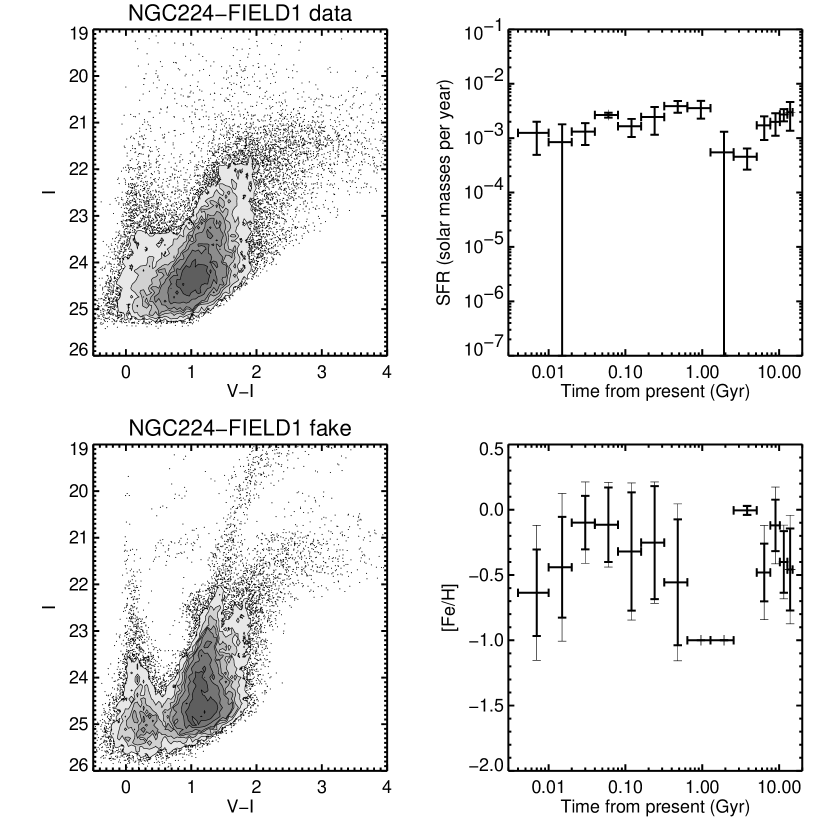
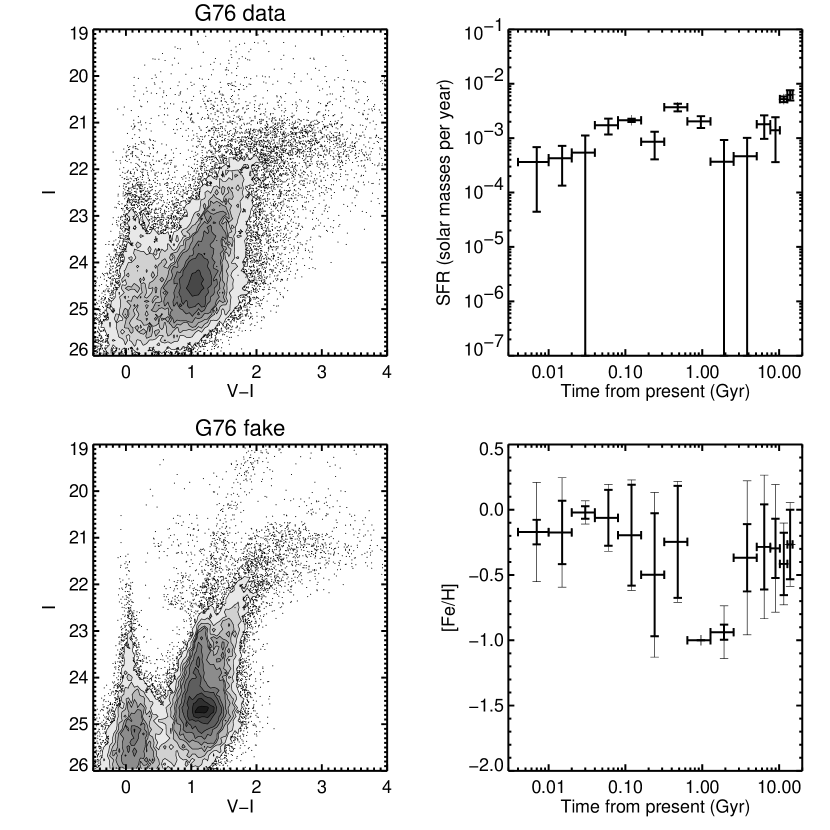
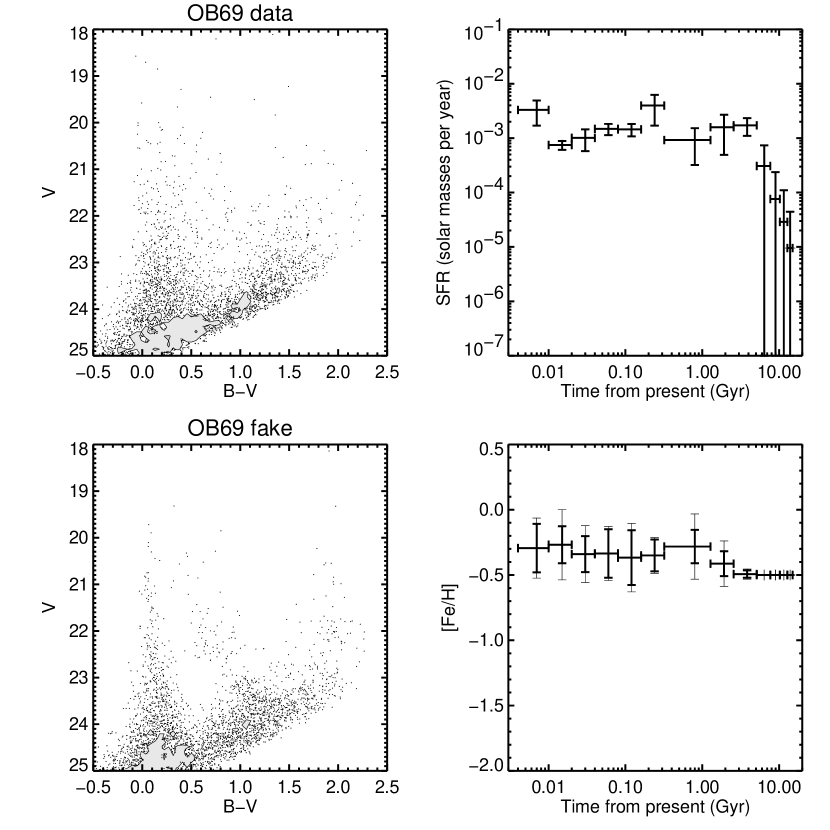
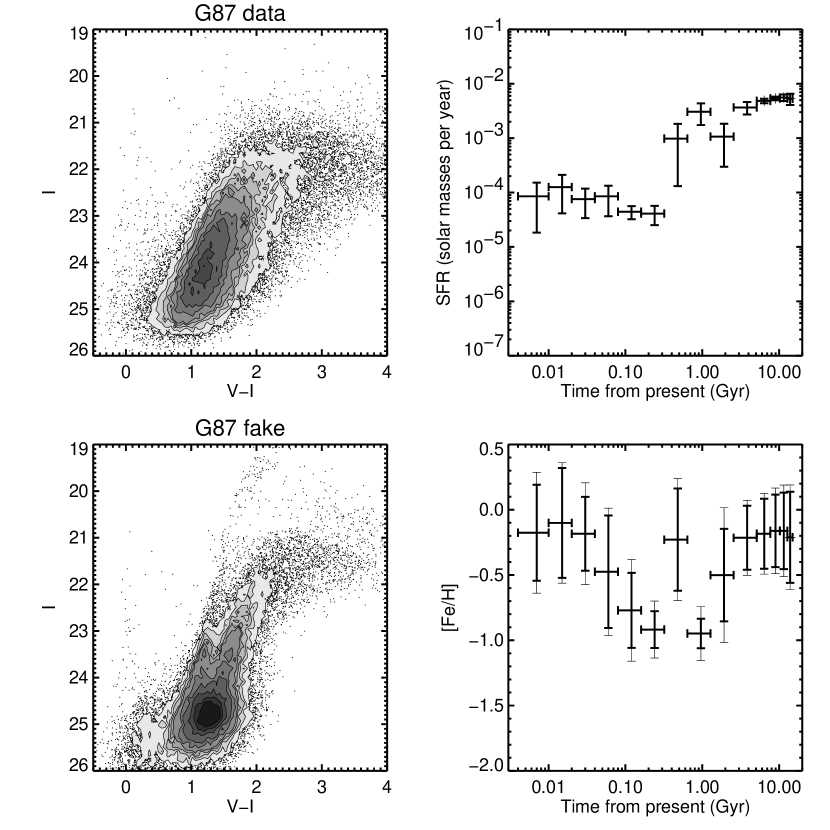
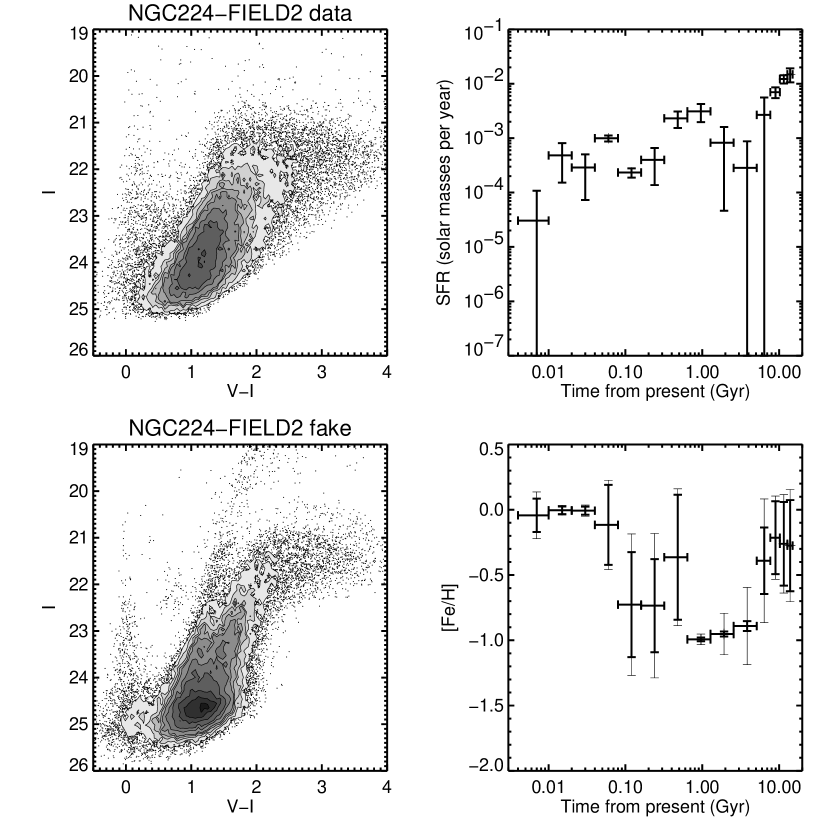
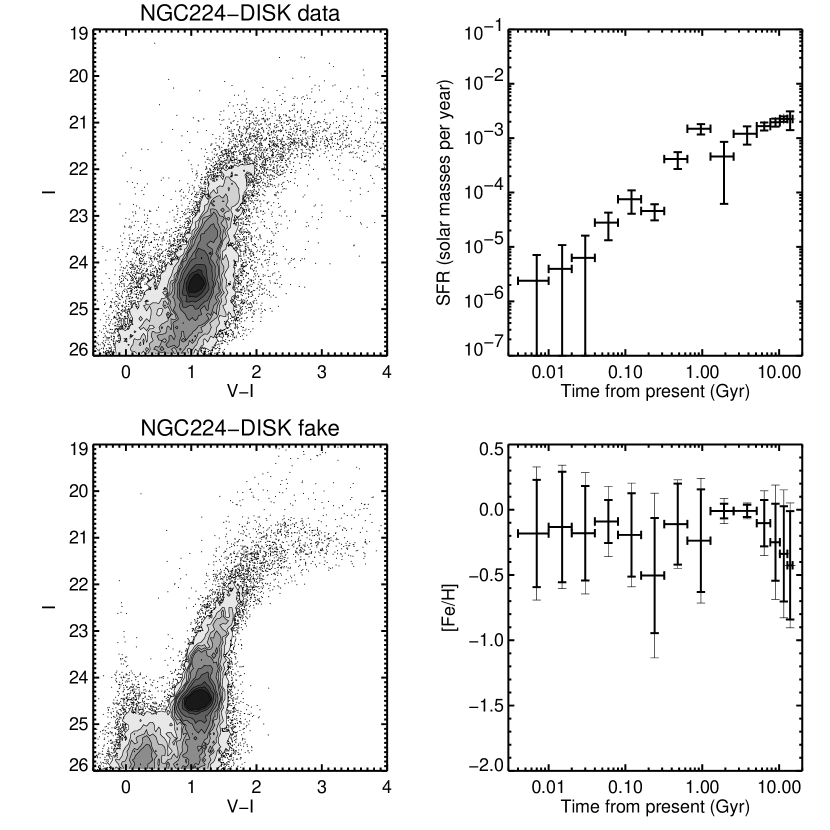
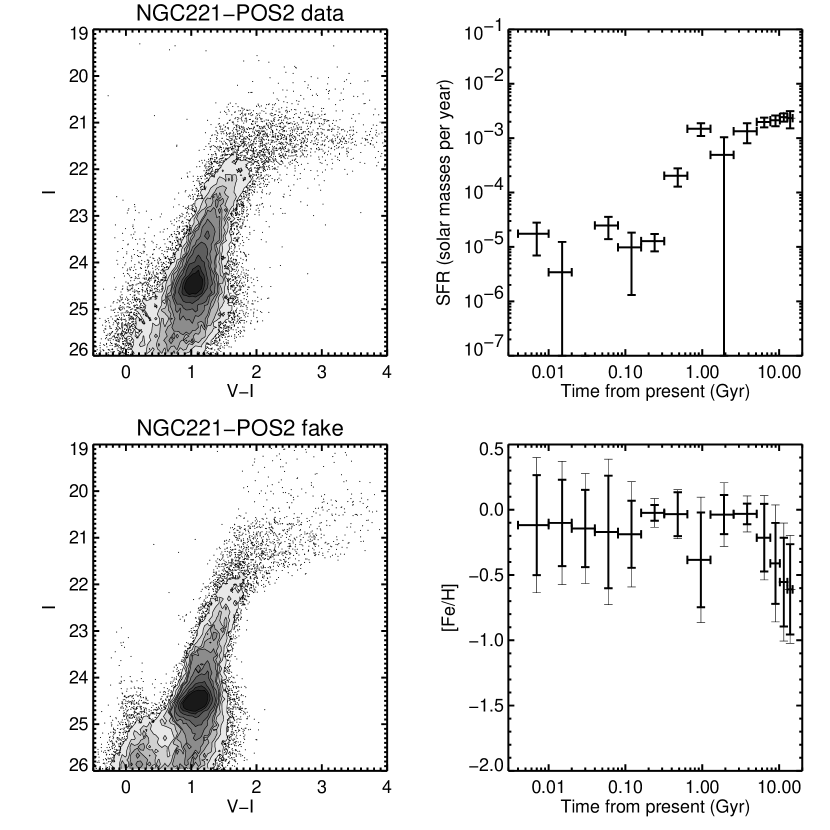
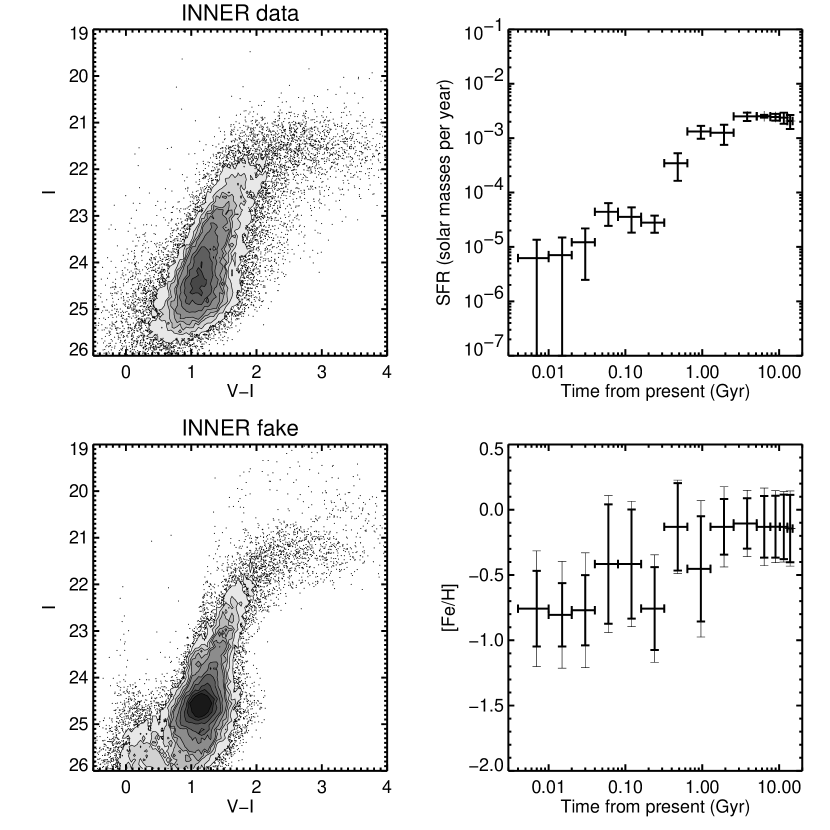
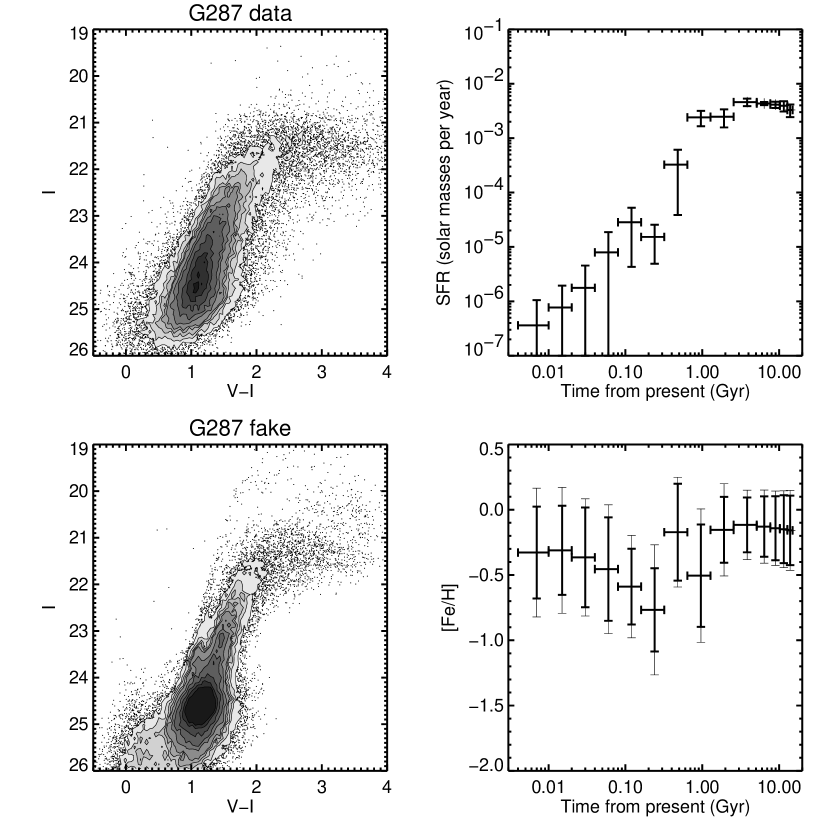
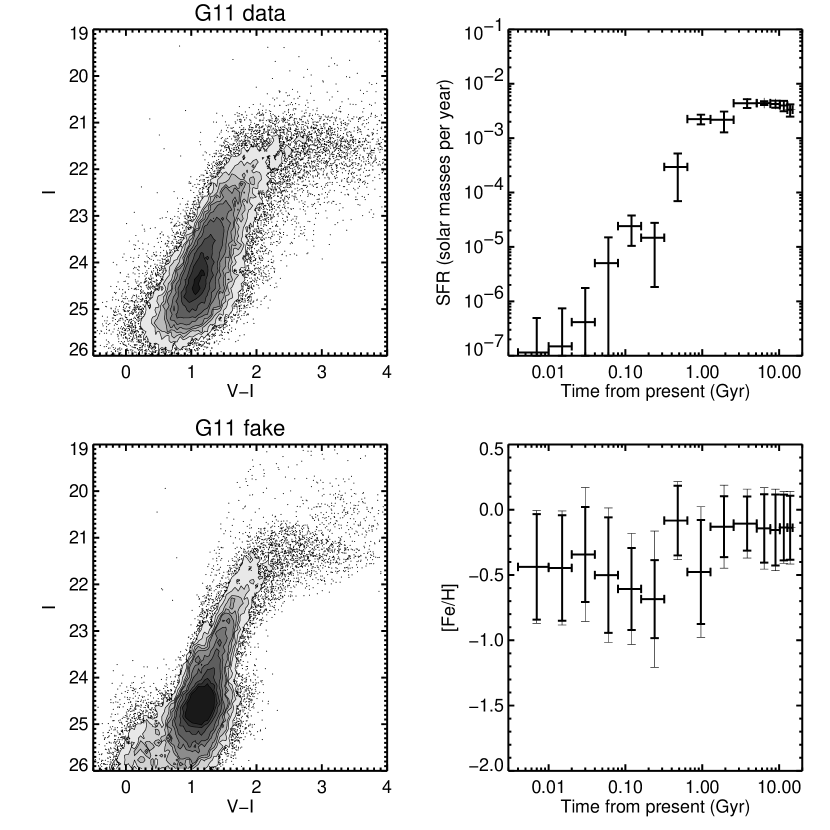
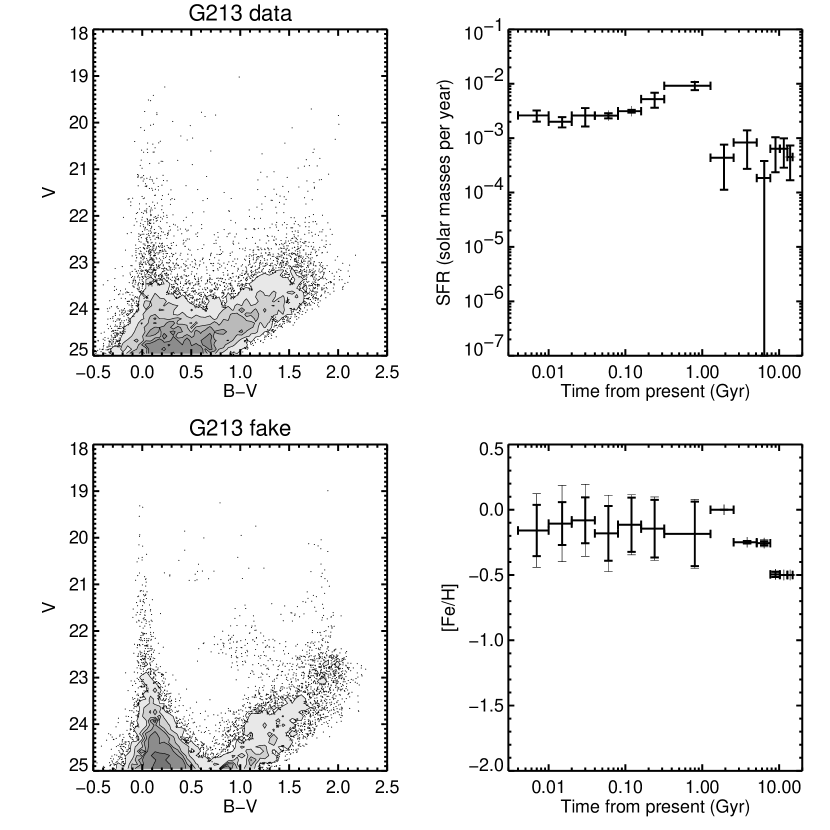
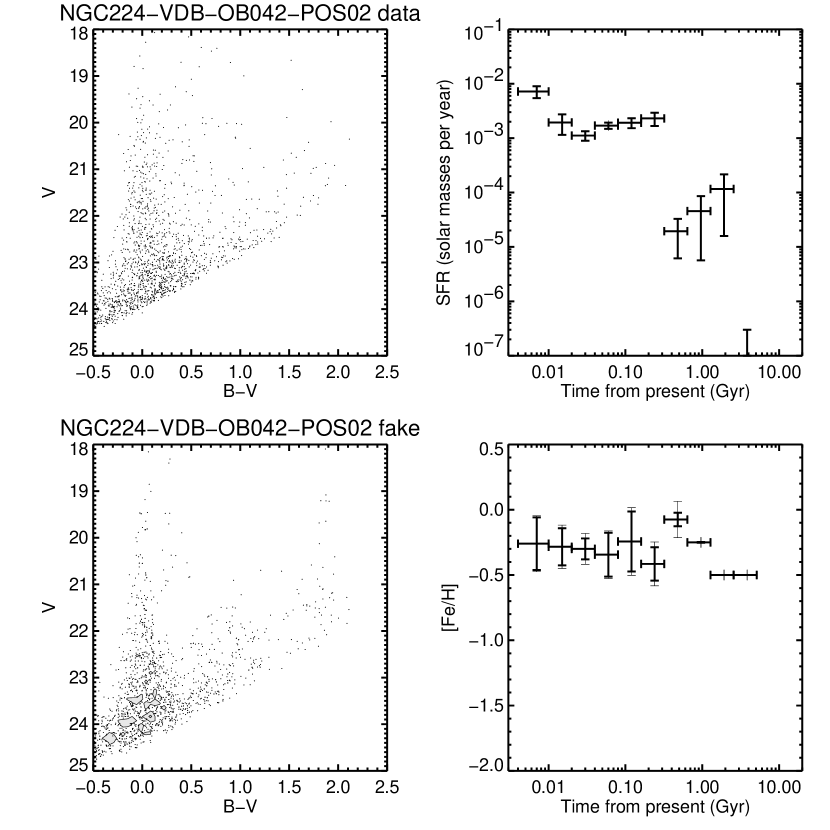
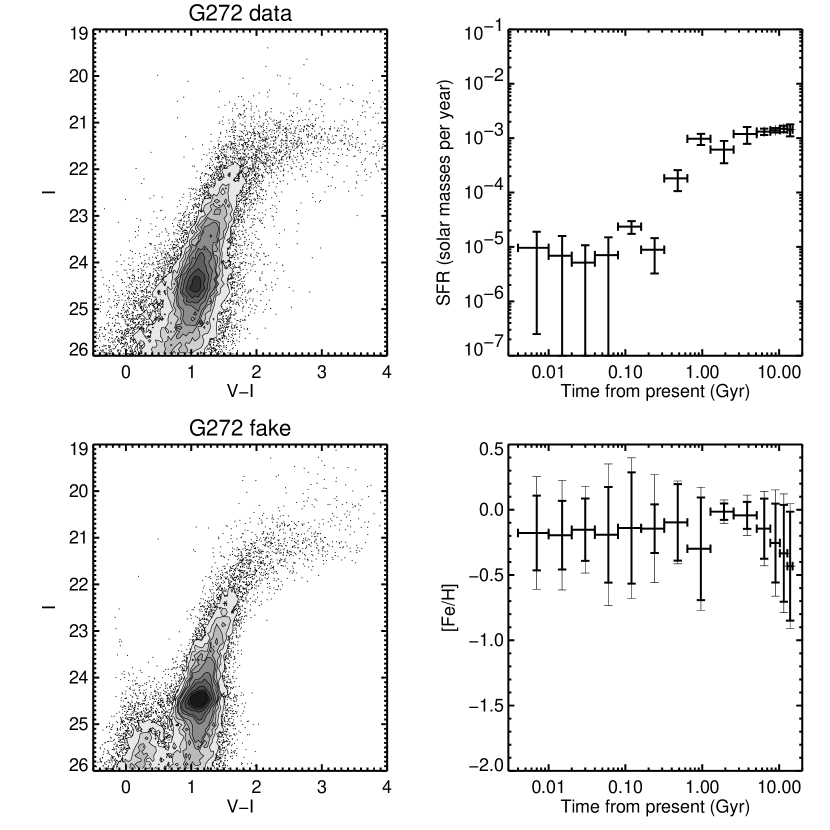
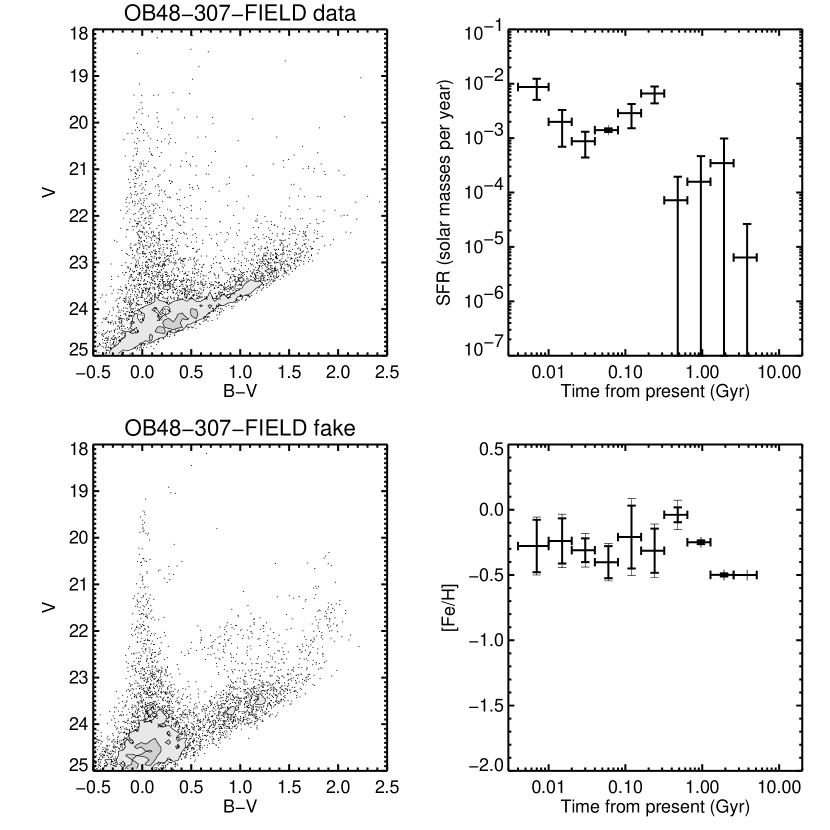
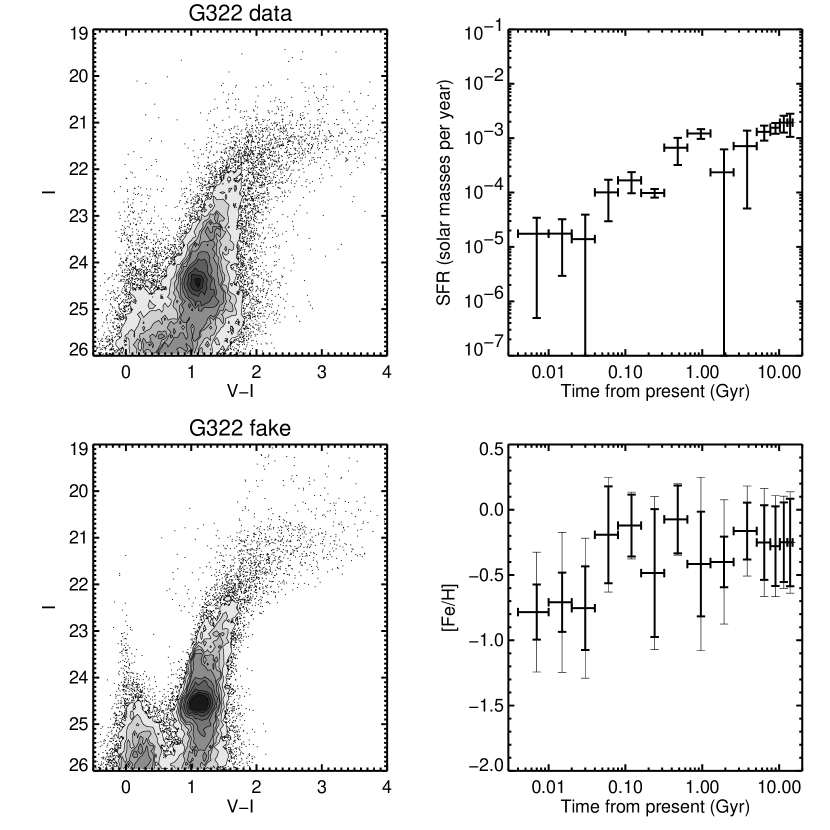
Four-panel figures are shown in Figure 5(a-z, aa-ac; some figures are only shown in the electronic version of the publication). The upper and lower left panels show the observed and artificially generated CMDs. The artificial CMD was generated using the SFH and chemical enrichment history shown in the upper and lower right panels along with a Salpeter IMF to populate the stellar evolution models of Girardi et al. (2000). The star formation rates and metal abundances are shown as a function of log time because the stellar evolution models are done with logarithmic time resolution. As we try to untangle the SFH of a field, the time resolution we can hope to achieve decreases as we go farther back in time. In fact, the time bins between 1 and 10 Gyr are of higher resolution than I can actually obtain from these data, which is likely the reason for the near constant star formation rates in the early time bins. This constant rate more likely corresponds to an average of the star formation rate from 1-10 Gyr. The star formation rates and abundances derived from the B and V data for early time periods (1 Gyr) are not reliable because the older population is not well sampled by these colors. The artificial CMD shown for each field is the closest match I was able to find by running many experiments on the data using the MATCH software. Here I discuss the implications of characteristics of the SFHs as well as some fields with unique characteristics.
5.1 General Trends
There are several traits common to the SFHs of most of the disk fields. These global traits reveal stellar populations that are present throughout the disk as well as possible systematic problems with the analysis. The V and I data show the general activity of the disk early in its formation, while the B and V data, which are generally restricted to the active arms, show the general activity of the presently most active portions of the disk.
The most obvious common trait to the fields observed in V and I, sensitive to the early SFH, is their similar star formation rates and abundances early in the formation of the disk. The star formation rates from 10-15 Gyr ago are consistently between 0.001 and 0.01 M⊙/yr for all M31 disk fields studied in V and I. In general, this early rate has not been surpassed recently except in the most active spiral arm fields. The implication of such a widespread high star formation rate early is that the disk was almost surely more active in its early history than in more recent history. Assuming all of the pointings which were observed in V and I provide a typical sample of the early disk population and that any other HST field in the disk will show the same early star formation rate as those already observed, I can make a rough determination of the early star formation rate of the M31 disk as a whole. If the main disk covers an area of 3 degrees2 and one WFPC2 field covers an area of 4.7 arcmin2, then the total disk SFR would have been 2-20 M⊙/yr. This rate for the early disk is larger than the current rate for the entire galaxy. The total star formation rate at present could not be calculated from our data because the young stars are not as uniformly distributed throughout the disk. This non-uniform distribution invalidates the assumption that the current rates for all HST fields in the disk will be the same, and in fact, they are very different for each field. Fortunately, the current star formation rate for the entire disk can be estimated from the far IR luminosity of 1.50.15 10 Devereux et al. (1994). Using the method of Inoue et al. (2000), the resulting current SFR is 1 M⊙/yr, clearly less than that measured for the early disk.
Another trait common to the fields outside of the spiral arms (all fields observed in I except NGC224-FIELD1, NGC224-FIELD2, and G76) is a drop in the star formation rate at 1 Gyr. This general trend is consistent with the previous calculation that the present total star formation rate in the disk is lower than it was at early times. These results all point to M31 having undergone an overall decrease in activity over the past Gyr, perhaps revealing that M31 is in a relatively quiescent phase of its evolution. This decrease is not seen in the fields observed in B and V, which are more sensitive probes of the recent SFH; however, there is a tendency for observers to use these colors to study the active spiral arms in order to study massive star formation. The two fields observed in all three bands are also in currently active regions and do not show this decline.
The fields in the arms tend to be observed in B and V, and the recent SFH of these fields suggest that no significant overall change in activity has occurred in the arms in the past Gyr. All the fields within the NE spiral arm show a fairly constant rate of star formation over the past few Myr. This result is in good agreement with previous work on the age distribution of the star clusters in these fields which suggests that there are clusters of all ages less than a few hundred Myr in these fields Williams & Hodge (2001a). Since the time resolution is limited and differential reddening tends to broaden the MS, this constant rate does not exclude the possibility of significant short-timescale activity changes (50 Myr).
Some common characteristics of the data reproductions provide diagnostics for problems with the analysis technique. There is a tendency for the artificial CMDs to have tighter features than those seen in the data. For example, the RGB in the G11 field (Figure 5t) is much broader in the data than in the artificial CMD, and the MS in the NGC224-VDB-OB042-POS02 (Figure 5w) field is also much broader than in the artificial CMD. This difference is most likely due to the range of extinction values for the stars in these fields. This differential reddening causes broadening of the MS and RGB which cannot be fit by the stellar evolution models. I have taken great care to systematically fit the main features of the CMD in order to avoid falsely mistaking stars with different reddening values to be different age populations. The non-recovery of the full width of these features shows that the stars that suffered from extinction much different from the mean extinction were not included in the SFH. There is also a tendency for the bluer RGB stars to be fit by a younger, low metallicity giant branch. This fit is likely incorrect because the branch created extends to brighter magnitudes than are present in the data and because the sharp, significant drop in metallicity cannot be physical. More likely, these bluer RGB stars are of similar metallicity to the rest of the RGB but are experiencing less than the mean extinction. The errors associated with this reddening issue could not be quantified. These errors are not included in the figures, and therefore the quoted errors are likely to be somewhat under-estimated.
5.2 Specific Fields
Some of the fields in the sample had special characteristics. Two fields were observed through all three filters, allowing tests of the consistency of the results from the two colors. Two other fields contained nearly 100% overlap, allowing tests of the consistency of the method applied to images of the same field taken at different times where the stars lay in different positions on the chips. One field has been previously studied using more traditional methods, allowing a comparison of results. Finally, one field lies far out in the disk, allowing a comparison with the inner disk populations. These special fields were useful for reaching an understanding of the effectiveness of the analysis.
Two of the fields (NCG224-FIELD1 and NCG224-FIELD2) were observed in B, V and I, allowing a comparison of the results obtained from the field from the different colors. The history determinations for each field in B and V were consistent with the determinations in V and I for recent times. Due to the poor sensitivity of WFPC2 in the B band, the results for the early times from the B and V data are not reliable. The regions of the CMD which probe the early time periods are too sparsely populated to make reliable star formation rate determinations. On the other hand, the V and I data were useful for constraining both the early and recent SFH. These fields were two of the most poorly reproduced V, V-I CMDs of the sample. One important reason for this poor fit was the large number of observed bright stars scattered outside of the typical features of the CMD. The three V, V-I fields located in the spiral arms all had a large number (100) of these stars, high mean reddening, and poor CMD fits. These stars are very young, and they are likely more strongly differentially reddened. These problems together make the fields much more difficult to decipher because the stellar evolution models are not well understood for these massive stars and differential reddening further confuses the situation. The distance and mean reddening determinations were consistent in NCG224-FIELD2 but not in NCG224-FIELD1. The mean reddening determined from the V and I data was lower than that obtained from the B and V data in NCG224-FIELD1. Most likely, the younger MS stars in this field are slightly more reddened on average than the older RGB stars. The consistency of the results in general for the two fields is reassuring that the errors calculated for the formation rates are not largely under-estimated for the fields observed in V and I, and are not largely under-estimated back to 1 Gyr for fields observed in B and V. The inconsistency between the metallicity results of the most recent time bins of the same fields in the two colors reinforces the suspicion that the errors for the metallicities determined for the recent star formation are largely under-estimated. These metallicity measurements rely heavily on the evolution models for massive stars, which are still debated and could have problems (e.g. (Limongi et al. (2000)); (Heger et al. (2000)), and references therein).
The fields G287 and G11 are extremely close together. There is no noticeable difference between their positions in Figure 1, and their pointings are only a few arcseconds different. I reduced and determined the SFH of the two fields independently. The results are shown in Figures 5s and 5t respectively. The SFHs determined for the two fields are perfectly consistent, confirming the accuracy of the photometry as well as the stability of the resulting SFH.
The field G272 has recently been analyzed by Sarajedini & Van Duyne (2001). They determined the metallicity distribution function of this field concluding that the field was generally metal rich [Fe/H] -0.1. I, too, find that the field is dominated by a metal rich population of similar abundance to what they found. In addition to the agreement with Sarajedini & Van Duyne (2001) about the dominance of a metal rich population in the G272 field, I also independently discovered the lack of a population with age 1 Gyr. According to this analysis, there was a sharp decrease in star formation beginning at 1 Gyr. These traits of this field were suggested as evidence that it was dominated by a thick disk population. Since this intermediate age, metal rich population is detected in all of the fields sensitive to it, this population is likely present throughout the disk, as one would expect if it represents a thick disk population. Sarajedini & Van Duyne (2001) also found a metal poor tail down to [Fe/H] -2.5. The MATCH analysis was not sensitive to such a metal poor tail. This tail is more prominent in the M31 halo Holland et al. (1996), suggesting that it represents the halo population, which would not be prominent in any of these fields. Another difference between our results is in the population of the tip of the RGB. Sarajedini & Van Duyne (2001) found only a handful of RGB stars of 22 whereas I find 1529 stars with 22. While this difference is quite noticeable in the bright end of the CMD, it did not significantly alter the conclusions drawn from the data. I attempted to recreate their lack of bright stars by reducing the field using a different software package, DAOPHOT II Stetson et al. (1990), but the resulting CMD was not significantly different from that obtained from HSTPHOT. The reason for the discrepancy remains a mystery.
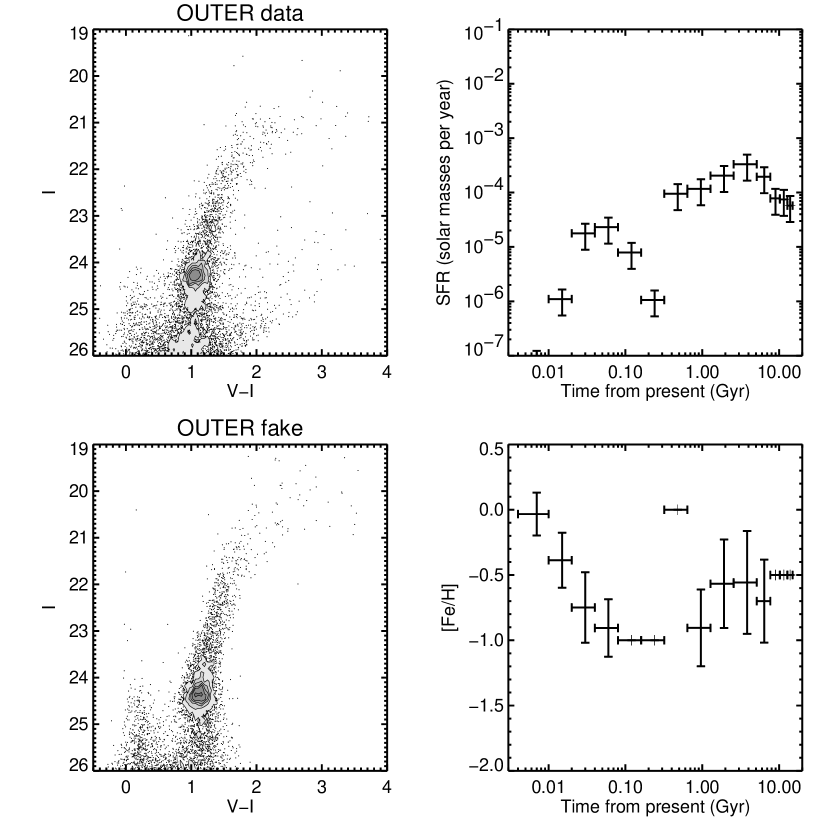
For comparison purposes, I analyzed the OUTER field, which lies much farther out in the disk than the other fields in this study. This field is found to be metal poor compared to the disk fields closer in, disregarding the most recent time bins which have very few stars upon which to determine the metallicity and should not be trusted. This lower metallicity in the OUTER field is consistent with findings from abundance studies of emission nebulae in the M31 disk which find evidence for an abundance gradient within the disk (e.g. (Galarza et al. (1999))). There is also a surprisingly evident population of young stars at 100 Myr. The age of this minor burst in star formation in the outer disk corresponds remarkably well with the ages of may of the Cepheids in the southern disk Magnier et al. (1997) as well as the ages of the massive and compact clusters in the southern disk Williams & Hodge (2001b). The early star formation rates are also slower than those of all fields located closer to the galaxy center, revealing the generally less active nature of the outer disk. Surprisingly, the old, very metal-poor tail that represents the halo population is not detected in this outer disk field either. This non-detection serves as a warning that the abundance determinations for the early history may suffer from systematic problems resulting from uncertainties in the stellar evolution models.
6 Conclusions
I have performed photometry on the stars contained within the wide field chips of 27 WFPC2 fields in the M31 disk. These fields were all observed through broadband filters, and they were obtained from the HST data archive. Using these data, I have put constraints on the SFHs of these portions of the M31 disk. Taken together, several general conclusions can be drawn from these SFHs: some pertaining to the limitations of this method, and some pertaining to the evolution of the M31 disk. The many experiments, the work with simulated data, and the random distribution of most of the fields suggest that these conclusions can be drawn reliably and are not likely due to systematic errors or selection effects.
By comparing the results of the same field analyzed via two colors independently, I found that the overall results from the method are stable, but the early SFH is better determined from V and I data. The differences in the reddening values measured for the same field by the two colors could be explained by the younger stars experiencing a different mean reddening than the older population. The differences in metallicity measured for recent times by the two colors could be attributable to problems with the models in predicting the rapid color changes that occur during the evolution of massive stars. The errors of these measurements are based on photometric errors from artificial star tests which do not account for the dispersion caused by differential reddening or problems inherent to the stellar evolution models. These unpredictable sources of confusion inevitably lead to under-estimated errors. Consistent results for the SFH of the two fields observed in two colors and from significantly overlapping fields suggests that these results are able to be reproduced, that the errors on the star formation rates are not largely under-estimated, and that the errors quoted for the photometry are accurate.
Overall, the SFHs determined for these 27 fields show some interesting similarities and differences. Comparison of these results with those of previous studies of a common field reveals that most of these disk fields sensitive to the old stellar populations contain a significant intermediate-age, metal-rich population possibly associated with a “thick disk” in M31. This population is joined by a significant younger population in fields within spiral arms (G76, NGC224-FIELD1, NGC224-FIELD2). This stellar population is not joined by a younger population between or outside the spiral arms (G33, G87, K108, G119, NGC224-DISK, NGC221-POS2, INNER, G11, G287, G272, G322). All of the fields sensitive to the old stellar populations (observed in V and I) show a similar star formation rate and metallicity early in the history of the disk (except the OUTER field, which lies much farther away from the galaxy center than the rest of the sample). The similar rates suggest that the M31 disk as a whole was more actively forming stars early in its evolution; the common high metallicities suggest that, like the disk of the Galaxy, the M31 disk is deficient in old metal poor stars. At the same time, the differences amoung the recent star formation rates with position within the disk suggest that over the past Gyr some areas of the disk have become less active while other areas have sustained a similar star formation rate to that of the early history of the disk. Since the old stars have certainly been well mixed since their formation, there is no way to know if the early star formation was more global or more intense. These results merely suggest that the total star formation rate for the disk was significantly greater until about 1 Gyr ago. One interpretation of these results is a general evolution of the M31 disk consisting of very active star formation (2-20 M⊙/yr) until about 1 Gyr ago, when the overall star formation rate declined with the exception of some regions which retained or aquired sufficient gas for continued or episodic star formation.
7 Acknowledgments
I thank Paul Hodge for his advice in dealing with the many problems faced during this work and for his help in preparing the manuscript. I thank Andrew Dolphin for helping with the MATCH and HSTPHOT packages. Support for this work was provided by NASA through grant number GO-08296 from the Space Telescope Science Institute, which is operated by the Association of Universities for Research in Astronomy, Incorporated, under NASA contract NAS5-26555.
References
- Blair et al. (1982) Blair, W. P., Kirshner, R. P., & Chevalier, R. A. 1982, ApJ, 254, 50
- Buonanno et al. (1999) Buonanno, R., Corsi, C. E., Castellani, M., Marconi, G., Fusi Pecci, F., & Zinn, R. 1999, AJ, 118, 1671
- Burstein & Heiles (1982) Burstein, D., & Heiles, C. 1982, AJ, 87, 1165
- Da Costa et al. (1996) Da Costa, G. S., Armandroff, T. E., Caldwell, N., & Seitzer, P. 1996, AJ, 112, 2576
- Da Costa et al. (2000) Da Costa, G. S., Armandroff, T. E., Caldwell, N., & Seitzer, P. 2000, AJ, 119, 705
- de Vaucouleurs (1958) de Vaucouleurs, G. 1958, ApJ, 128, 465
- Devereux et al. (1994) Devereux, N. A., Price, R., Wells, L. A., & Duric, N. 1994, AJ, 108, 1667
- Dohm-Palmer et al. (1997) Dohm-Palmer, R. C., et al. 1997, AJ, 114, 2527
- Dolphin (1997) Dolphin, A. 1997, New Astronomy, 2, 397
- Dolphin (2000a) Dolphin, A. E. 2000a, ApJ, 531, 804
- Dolphin (2000b) Dolphin, A. E. 2000b, PASP, 112, 1383
- Galarza et al. (1999) Galarza, V. C., Walterbos, R. . M., & Braun, R. 1999, AJ, 118, 2775
- Gallart et al. (1996) Gallart, C., Aparicio, A., Bertelli, G., & Chiosi, C. 1996, AJ, 112, 1950
- Gallart et al. (1999) Gallart, C., Freedman, W. L., Aparicio, A., Bertelli, G., & Chiosi, C. 1999, AJ, 118, 2245
- Girardi et al. (2000) Girardi, L., Bressan, A., Bertelli, G., & Chiosi, C. 2000, A&AS, 141, 371
- Heger et al. (2000) Heger, A., Langer, N., & Woosley, S. E. 2000, ApJ, 528, 368
- Hodge & Lee (1988) Hodge, P., & Lee, M. G. 1988, ApJ, 329, 651
- Hodge (1992) Hodge, P. W. 1992, The Andromeda galaxy (Astrophysics and Space Science Library, Dordrecht: Kluwer, 1992)
- Holland et al. (1996) Holland, S., Fahlman, G. G., & Richer, H. B. 1996, AJ, 112, 1035
- Holtzman et al. (1995) Holtzman, J. A., Burrows, C. J., Casertano, S., Hester, J. J., Trauger, J. T., Watson, A. M., & Worthey, G. 1995, PASP, 107, 1065
- Holtzman et al. (1999) Holtzman, J. A., et al. 1999, AJ, 118, 2262
- Inoue et al. (2000) Inoue, A. K., Hirashita, H., & Kamaya, H. 2000, PASJ, 52, 539
- Limongi et al. (2000) Limongi, M., Straniero, O., & Chieffi, A. 2000, ApJS, 129, 625
- Magnier et al. (1997) Magnier, E. A., Prins, S., Augusteijn, T., van Paradijs, J., & Lewin, W. H. G. 1997, A&A, 326, 442
- Martínez-Delgado et al. (1999) Martínez-Delgado, D., Aparicio, A., & Gallart, C. 1999, AJ, 118, 2229
- Massey (1998) Massey, P. 1998, ApJ, 501, 153
- Mayer et al. (2001) Mayer, L., Governato, F., Colpi, M., Moore, B., Quinn, T., Wadsley, J., Stadel, J., & Lake, G. 2001, ApJ, 547, L123
- Mighell (1997) Mighell, K. J. 1997, AJ, 114, 1458
- Mighell & Burke (1999) Mighell, K. J., & Burke, C. J. 1999, AJ, 118, 366
- Monkiewicz et al. (1999) Monkiewicz, J., et al. 1999, PASP, 111, 1392
- Olsen (1999) Olsen, K. A. G. 1999, AJ, 117, 2244
- Sarajedini & Van Duyne (2001) Sarajedini, A., & Van Duyne, J. 2001, AJ, in press
- Stetson et al. (1990) Stetson, P. B., Davis, L. E., & Crabtree, D. R. 1990, in ASP Conf. Ser. 8: CCDs in astronomy, 289
- Tolstoy et al. (1998) Tolstoy, E., et al. 1998, AJ, 116, 1244
- Williams & Hodge (2001a) Williams, B. F., & Hodge, P. W. 2001a, ApJ, in press
- Williams & Hodge (2001b) Williams, B. F., & Hodge, P. W. 2001b, ApJ, 548, 190
- Winkler & Williams (1995) Winkler, P. F., & Williams, B. F. 1995, in American Astronomical Society Meeting, Vol. 186, 4910
| Field | Prop. # | Obs. date | RA (2000) | DEC (2000) | Filter | Exp. (sec) | ||||||
|---|---|---|---|---|---|---|---|---|---|---|---|---|
| OUTER | 6859 | Aug 14 1997 | 0:36:59.20 | 39:52:21.3 | F555W | 300 | ||||||
| OUTER | 6859 | Aug 14 1997 | 0:36:59.20 | 39:52:21.3 | F555W | 1000 | ||||||
| OUTER | 6859 | Aug 14 1997 | 0:36:59.20 | 39:52:21.3 | F555W | 1100 | ||||||
| OUTER | 6859 | Aug 14 1997 | 0:36:59.20 | 39:52:21.3 | F814W | 200 | ||||||
| OUTER | 6859 | Aug 14 1997 | 0:36:59.20 | 39:52:21.3 | F814W | 1000 | ||||||
| OUTER | 6859 | Aug 14 1997 | 0:36:59.20 | 39:52:21.3 | F814W | 1300 | ||||||
| G33 | 6671 | Feb 26 1999 | 0:39:32.23 | 40:30:48.0 | F555W | 1200 | ||||||
| G33 | 6671 | Feb 26 1999 | 0:39:32.23 | 40:30:48.0 | F555W | 1400 | ||||||
| G33 | 6671 | Feb 26 1999 | 0:39:32.23 | 40:30:48.0 | F555W | 1300 | ||||||
| G33 | 6671 | Feb 26 1999 | 0:39:32.23 | 40:30:48.0 | F555W | 1400 | ||||||
| G33 | 6671 | Feb 26 1999 | 0:39:32.23 | 40:30:48.0 | F814W | 1300 | ||||||
| G33 | 6671 | Feb 26 1999 | 0:39:32.23 | 40:30:48.0 | F814W | 1400 | ||||||
| G33 | 6671 | Feb 26 1999 | 0:39:32.23 | 40:30:48.0 | F814W | 1300 | ||||||
| G33 | 6671 | Feb 26 1999 | 0:39:32.23 | 40:30:48.0 | F814W | 1400 | ||||||
| G38 | 8296 | Oct 15 1999 | 0:39:47.35 | 40:31:57.9 | F555W | 600 | ||||||
| G38 | 8296 | Oct 15 1999 | 0:39:47.35 | 40:31:57.9 | F555W | 600 | ||||||
| G38 | 8296 | Oct 15 1999 | 0:39:47.35 | 40:31:57.9 | F439W | 800 | ||||||
| G38 | 8296 | Oct 15 1999 | 0:39:47.35 | 40:31:57.9 | F439W | 800 | ||||||
| G44 | 8296 | Oct 30 1999 | 0:40:01.58 | 40:34:14.7 | F555W | 600 | ||||||
| G44 | 8296 | Oct 30 1999 | 0:40:01.58 | 40:34:14.7 | F555W | 600 | ||||||
| G44 | 8296 | Oct 30 1999 | 0:40:01.58 | 40:34:14.7 | F439W | 800 | ||||||
| G44 | 8296 | Oct 30 1999 | 0:40:01.58 | 40:34:14.7 | F439W | 800 | ||||||
| OB78-WR2-FIELD | 6038 | Jan 23 1996 | 0:40:14.10 | 40:37:11.3 | F555W | 160 | ||||||
| OB78-WR2-FIELD | 6038 | Jan 23 1996 | 0:40:14.10 | 40:37:11.3 | F439W | 600 | ||||||
| NGC224-FIELD1 | 6431 | Dec 9 1997 | 0:40:39.54 | 40:33:25.4 | F439W | 350NGC224-FIELD1 | 6431 | Dec 9 1997 | 0:40:39.54 | 40:33:25.4 | F439W | 350 |
| NGC224-FIELD1 | 6431 | Dec 9 1997 | 0:40:39.54 | 40:33:25.4 | F555W | 260 | ||||||
| NGC224-FIELD1 | 6431 | Dec 9 1997 | 0:40:39.54 | 40:33:25.4 | F555W | 260 | ||||||
| NGC224-FIELD1 | 6431 | Dec 9 1997 | 0:40:39.54 | 40:33:25.4 | F814W | 260 | ||||||
| NGC224-FIELD1 | 6431 | Dec 9 1997 | 0:40:39.54 | 40:33:25.4 | F814W | 260 | ||||||
| G76 | 6671 | Jan 11 1999 | 0:40:56.68 | 40:35:28.9 | F555W | 1200 | ||||||
| G76 | 6671 | Jan 11 1999 | 0:40:56.68 | 40:35:28.9 | F555W | 1400 | ||||||
| G76 | 6671 | Jan 11 1999 | 0:40:56.68 | 40:35:28.9 | F555W | 1300 | ||||||
| G76 | 6671 | Jan 11 1999 | 0:40:56.68 | 40:35:28.9 | F555W | 1400 | ||||||
| G76 | 6671 | Jan 11 1999 | 0:40:56.68 | 40:35:28.9 | F814W | 1300 | ||||||
| G76 | 6671 | Jan 11 1999 | 0:40:56.68 | 40:35:28.9 | F814W | 1400 | ||||||
| G76 | 6671 | Jan 11 1999 | 0:40:56.68 | 40:35:28.9 | F814W | 1300 | ||||||
| G76 | 6671 | Jan 11 1999 | 0:40:56.68 | 40:35:28.9 | F814W | 1400 | ||||||
| OB69 | 5998 | Aug 30 1995 | 0:40:59.54 | 41:03:38.4 | F555W | 160 | ||||||
| OB69 | 5998 | Aug 30 1995 | 0:40:59.54 | 41:03:38.4 | F439W | 500 | ||||||
| OB69 | 5998 | Aug 30 1995 | 0:40:59.54 | 41:03:38.4 | F439W | 300 | ||||||
| G87 | 6671 | Aug 16 1999 | 0:41:16.28 | 40:56:12.5 | F555W | 1200 | ||||||
| G87 | 6671 | Aug 16 1999 | 0:41:16.28 | 40:56:12.5 | F555W | 1400 | ||||||
| G87 | 6671 | Aug 16 1999 | 0:41:16.28 | 40:56:12.5 | F555W | 1300 | ||||||
| G87 | 6671 | Aug 16 1999 | 0:41:16.28 | 40:56:12.5 | F555W | 1400 | ||||||
| G87 | 6671 | Aug 16 1999 | 0:41:16.28 | 40:56:12.5 | F814W | 1300 | ||||||
| G87 | 6671 | Aug 16 1999 | 0:41:16.28 | 40:56:12.5 | F814W | 1287 | ||||||
| G87 | 6671 | Aug 16 1999 | 0:41:16.28 | 40:56:12.5 | F814W | 1300 | ||||||
| G87 | 6671 | Aug 16 1999 | 0:41:16.28 | 40:56:12.5 | F814W | 1400G94 | 8296 | Oct 30 1999 | 0:41:22.08 | 40:37:06.7 | F555W | 600 |
| G94 | 8296 | Oct 30 1999 | 0:41:22.08 | 40:37:06.7 | F555W | 600 | ||||||
| G94 | 8296 | Oct 30 1999 | 0:41:22.08 | 40:37:06.7 | F439W | 800 | ||||||
| G94 | 8296 | Oct 30 1999 | 0:41:22.08 | 40:37:06.7 | F439W | 800 | ||||||
| K108 | 5112 | Feb 15 1994 | 0:41:43.30 | 41:34:20.3 | F814W | 1000 | ||||||
| K108 | 5112 | Feb 15 1994 | 0:41:43.30 | 41:34:20.3 | F814W | 1000 | ||||||
| K108 | 5112 | Feb 15 1994 | 0:41:43.30 | 41:34:20.3 | F555W | 1000 | ||||||
| K108 | 5112 | Feb 15 1994 | 0:41:43.30 | 41:34:20.3 | F555W | 1000 | ||||||
| G119 | 6671 | Jun 13 1999 | 0:41:55.58 | 40:47:15.0 | F555W | 1200 | ||||||
| G119 | 6671 | Jun 13 1999 | 0:41:55.58 | 40:47:15.0 | F555W | 1400 | ||||||
| G119 | 6671 | Jun 13 1999 | 0:41:55.58 | 40:47:15.0 | F555W | 1300 | ||||||
| G119 | 6671 | Jun 13 1999 | 0:41:55.58 | 40:47:15.0 | F555W | 1400 | ||||||
| G119 | 6671 | Jun 13 1999 | 0:41:55.58 | 40:47:15.0 | F814W | 1300 | ||||||
| G119 | 6671 | Jun 13 1999 | 0:41:55.58 | 40:47:15.0 | F814W | 1400 | ||||||
| G119 | 6671 | Jun 13 1999 | 0:41:55.58 | 40:47:15.0 | F814W | 1300 | ||||||
| G119 | 6671 | Jun 13 1999 | 0:41:55.58 | 40:47:15.0 | F814W | 1400 | ||||||
| NGC224-FIELD2 | 6431 | Dec 9 1997 | 0:42:05.27 | 40:57:33.9 | F439W | 350 | ||||||
| NGC224-FIELD2 | 6431 | Dec 9 1997 | 0:42:05.27 | 40:57:33.9 | F439W | 350 | ||||||
| NGC224-FIELD2 | 6431 | Dec 9 1997 | 0:42:05.27 | 40:57:33.9 | F555W | 260 | ||||||
| NGC224-FIELD2 | 6431 | Dec 9 1997 | 0:42:05.27 | 40:57:33.9 | F555W | 260 | ||||||
| NGC224-FIELD2 | 6431 | Dec 9 1997 | 0:42:05.27 | 40:57:33.9 | F814W | 260 | ||||||
| NGC224-FIELD2 | 6431 | Dec 9 1997 | 0:42:05.27 | 40:57:33.9 | F814W | 260 | ||||||
| NGC224-DISK | 6636 | Dec 31 1996 | 0:42:18.01 | 40:45:03.7 | F555W | 600 | ||||||
| NGC224-DISK | 6636 | Dec 31 1996 | 0:42:18.01 | 40:45:03.7 | F555W | 1200NGC224-DISK | 6636 | Dec 31 1996 | 0:42:18.01 | 40:45:03.7 | F814W | 1300 |
| NGC224-DISK | 6636 | Dec 31 1996 | 0:42:18.01 | 40:45:03.7 | F814W | 1200 | ||||||
| NGC221-POS2 | 5233 | Oct 22 1994 | 0:43:04.61 | 40:54:33.0 | F555W | 500 | ||||||
| NGC221-POS2 | 5233 | Oct 22 1994 | 0:43:04.61 | 40:54:33.0 | F555W | 500 | ||||||
| NGC221-POS2 | 5233 | Oct 22 1994 | 0:43:04.61 | 40:54:33.0 | F555W | 500 | ||||||
| NGC221-POS2 | 5233 | Oct 22 1994 | 0:43:04.61 | 40:54:33.0 | F555W | 500 | ||||||
| NGC221-POS2 | 5233 | Oct 22 1994 | 0:43:04.61 | 40:54:33.0 | F814W | 500 | ||||||
| NGC221-POS2 | 5233 | Oct 22 1994 | 0:43:04.61 | 40:54:33.0 | F814W | 500 | ||||||
| NGC221-POS2 | 5233 | Oct 22 1994 | 0:43:04.61 | 40:54:33.0 | F814W | 500 | ||||||
| NGC221-POS2 | 5233 | Oct 22 1994 | 0:43:04.61 | 40:54:33.0 | F814W | 500 | ||||||
| INNER | 6859 | Aug 14 1997 | 0:44:23.74 | 41:45:16.2 | F555W | 300 | ||||||
| INNER | 6859 | Aug 14 1997 | 0:44:23.74 | 41:45:16.2 | F555W | 1000 | ||||||
| INNER | 6859 | Aug 14 1997 | 0:44:23.74 | 41:45:16.2 | F555W | 1100 | ||||||
| INNER | 6859 | Aug 14 1997 | 0:44:23.74 | 41:45:16.2 | F814W | 200 | ||||||
| INNER | 6859 | Aug 14 1997 | 0:44:23.74 | 41:45:16.2 | F814W | 1000 | ||||||
| INNER | 6859 | Aug 14 1997 | 0:44:23.74 | 41:45:16.2 | F814W | 1300 | ||||||
| G287 | 6671 | Sep 26 1999 | 0:44:42.45 | 41:44:24.2 | F555W | 1200 | ||||||
| G287 | 6671 | Sep 26 1999 | 0:44:42.45 | 41:44:24.2 | F555W | 1400 | ||||||
| G287 | 6671 | Sep 26 1999 | 0:44:42.45 | 41:44:24.2 | F555W | 1300 | ||||||
| G287 | 6671 | Sep 26 1999 | 0:44:42.45 | 41:44:24.2 | F555W | 1400 | ||||||
| G287 | 6671 | Sep 26 1999 | 0:44:42.45 | 41:44:24.2 | F814W | 1300 | ||||||
| G287 | 6671 | Sep 26 1999 | 0:44:42.45 | 41:44:24.2 | F814W | 1400 | ||||||
| G287 | 6671 | Sep 26 1999 | 0:44:42.45 | 41:44:24.2 | F814W | 1300 | ||||||
| G287 | 6671 | Sep 26 1999 | 0:44:42.45 | 41:44:24.2 | F814W | 1400G11 | 6671 | Sep 25 1999 | 0:44:42.52 | 41:44:24.1 | F555W | 1200 |
| G11 | 6671 | Sep 25 1999 | 0:44:42.52 | 41:44:24.1 | F555W | 1400 | ||||||
| G11 | 6671 | Sep 25 1999 | 0:44:42.52 | 41:44:24.1 | F555W | 1300 | ||||||
| G11 | 6671 | Sep 25 1999 | 0:44:42.52 | 41:44:24.1 | F555W | 1400 | ||||||
| G11 | 6671 | Sep 25 1999 | 0:44:42.52 | 41:44:24.1 | F814W | 1300 | ||||||
| G11 | 6671 | Sep 25 1999 | 0:44:42.52 | 41:44:24.1 | F814W | 1400 | ||||||
| G11 | 6671 | Sep 25 1999 | 0:44:42.52 | 41:44:24.1 | F814W | 1300 | ||||||
| G11 | 6671 | Sep 25 1999 | 0:44:42.52 | 41:44:24.1 | F814W | 1400 | ||||||
| NGC224-VDB-OB042-POS01 | 5911 | Oct 3 1995 | 0:44:44.23 | 41:27:33.8 | F439W | 160 | ||||||
| NGC224-VDB-OB042-POS01 | 5911 | Oct 3 1995 | 0:44:44.23 | 41:27:33.8 | F555W | 140 | ||||||
| G213 | 8296 | Oct 31 1999 | 0:44:46.19 | 41:51:33.3 | F555W | 600 | ||||||
| G213 | 8296 | Oct 31 1999 | 0:44:46.19 | 41:51:33.3 | F555W | 600 | ||||||
| G213 | 8296 | Oct 31 1999 | 0:44:46.19 | 41:51:33.3 | F439W | 800 | ||||||
| G213 | 8296 | Oct 31 1999 | 0:44:46.19 | 41:51:33.3 | F439W | 800 | ||||||
| NGC224-VDB-OB042-POS02 | 5911 | Oct 8 1995 | 0:44:49.34 | 41:28:59.0 | F439W | 160 | ||||||
| NGC224-VDB-OB042-POS02 | 5911 | Oct 8 1995 | 0:44:49.34 | 41:28:59.0 | F555W | 140 | ||||||
| G272 | 5420 | Jan 22 1995 | 0:44:50.61 | 41:19:11.1 | F555W | 1500 | ||||||
| G272 | 5420 | Jan 22 1995 | 0:44:50.61 | 41:19:11.1 | F555W | 2300 | ||||||
| G272 | 5420 | Jan 22 1995 | 0:44:50.61 | 41:19:11.1 | F814W | 2300 | ||||||
| G272 | 5420 | Jan 22 1995 | 0:44:50.61 | 41:19:11.1 | F814W | 2300 | ||||||
| G272 | 5420 | Jan 22 1995 | 0:44:50.61 | 41:19:11.1 | F814W | 2300 | ||||||
| G272 | 5420 | Jan 22 1995 | 0:44:50.61 | 41:19:11.1 | F814W | 2300 | ||||||
| G272 | 5420 | Jan 22 1995 | 0:44:50.61 | 41:19:11.1 | F814W | 1600 | ||||||
| OB48-307-FIELD | 6038 | Jan 1 1996 | 0:44:51.22 | 41:30:03.7 | F555W | 160OB48-307-FIELD | 6038 | Jan 1 1996 | 0:44:51.22 | 41:30:03.7 | F439W | 600 |
| NGC224-VDB-OB042-POS03 | 5911 | Oct 4 1995 | 0:44:57.63 | 41:30:51.6 | F439W | 160 | ||||||
| NGC224-VDB-OB042-POS03 | 5911 | Oct 4 1995 | 0:44:57.63 | 41:30:51.6 | F555W | 140 | ||||||
| NGC224-VDB-OB048-POS01 | 5911 | Oct 15 1995 | 0:45:09.25 | 41:34:30.7 | F439W | 160 | ||||||
| NGC224-VDB-OB048-POS01 | 5911 | Oct 15 1995 | 0:45:09.25 | 41:34:30.7 | F555W | 140 | ||||||
| NGC224-VDB-OB048-POS02 | 5911 | Oct 15 1995 | 0:45:11.95 | 41:36:57.0 | F439W | 160 | ||||||
| NGC224-VDB-OB048-POS02 | 5911 | Oct 15 1995 | 0:45:11.95 | 41:36:57.0 | F555W | 140 | ||||||
| G322 | 6671 | Jan 10 1999 | 0:46:24.56 | 42:01:38.6 | F555W | 1200 | ||||||
| G322 | 6671 | Jan 10 1999 | 0:46:24.56 | 42:01:38.6 | F555W | 1400 | ||||||
| G322 | 6671 | Jan 10 1999 | 0:46:24.56 | 42:01:38.6 | F555W | 1300 | ||||||
| G322 | 6671 | Jan 10 1999 | 0:46:24.56 | 42:01:38.6 | F555W | 1400 | ||||||
| G322 | 6671 | Jan 10 1999 | 0:46:24.56 | 42:01:38.6 | F814W | 1300 | ||||||
| G322 | 6671 | Jan 10 1999 | 0:46:24.56 | 42:01:38.6 | F814W | 1400 | ||||||
| G322 | 6671 | Jan 10 1999 | 0:46:24.56 | 42:01:38.6 | F814W | 1300 | ||||||
| G322 | 6671 | Jan 10 1999 | 0:46:24.56 | 42:01:38.6 | F814W | 1400 |
| Field | m-M | mean AV |
|---|---|---|
| OUTER | 24.450.050 | 0.4000.100 |
| G33 | 24.4710.063 | 0.3670.103 |
| G38 | 24.4500.038 | 0.7000.076 |
| G44 | 24.4500.038 | 0.7000.076 |
| OB78-WR2-FIELD | 24.4560.039 | 0.7120.078 |
| NGC224-FIELD1 B&V | 24.4650.032 | 1.0000.141 |
| NGC224-FIELD1 V&I | 24.4500.071 | 0.7700.064 |
| G76 | 24.4300.060 | 0.5000.077 |
| OB69 | 24.4500.038 | 1.0710.103 |
| G87 | 24.4850.055 | 0.6900.094 |
| G94 | 24.4430.042 | 0.7710.070 |
| K108 | 24.4350.063 | 0.1600.066 |
| G119 | 24.4650.063 | 0.2200.075 |
| NGC224-FIELD2 B&V | 24.4600.037 | 0.6700.110 |
| NGC224-FIELD2 V&I | 24.4800.064 | 0.5200.098 |
| NGC224-DISK | 24.4360.061 | 0.1910.079 |
| NGC221-POS2 | 24.4600.062 | 0.2000.077 |
| INNER | 24.5050.042 | 0.2800.098 |
| G287 | 24.5000.039 | 0.3200.098 |
| G11 | 24.4900.049 | 0.3100.083 |
| NGC224-VDB-OB042-POS01 | 24.4640.035 | 0.9140.136 |
| G213 | 24.4430.042 | 0.7710.070 |
| NGC224-VDB-OB042-POS02 | 24.4600.037 | 0.8400.049 |
| G272 | 24.4500.071 | 0.1900.070 |
| OB48-307-FIELD | 24.4620.033 | 0.8620.099 |
| NGC224-VDB-OB042-POS03 | 24.4750.025 | 1.0000.082 |
| NGC224-VDB-OB048-POS01 | 24.4800.024 | 1.0600.136 |
| NGC224-VDB-OB048-POS02 | 24.4750.025 | 0.7000.082 |
| G322 | 24.4450.062 | 0.2910.079 |


(a) The OUTER field, not shown in Figure 1 due to its large galactocentric distance.