PERIODIC ACCELERATION OF ELECTRONS IN THE 1998 NOVEMBER 10 SOLAR FLARE
Abstract
We present an examination of the multi-wavelength observation of a C7.9 flare which occurred on 1998 November 10. This is the first time of imaging observation of the quasi-periodic pulsations (QPPs). Four bursts were observed with the hard X-ray telescope aboard Yohkoh and the Nobeyama Radioheliograph during the impulsive phase of the flare. In the second burst, the hard X-ray and microwave time profiles clearly showed a QPP. We estimated the Alfvén transit time along the flare loop using the images of the soft X-ray telescope aboard Yohkoh and the photospheric magnetgrams, and found that the transit time was almost equal to the period of the QPP. We therefore suggest, based on a shock acceleration model, that variations of macroscopic magnetic structures, such as oscillations of coronal loops, affect the efficiency of particle injection/acceleration.
1 INTRODUCTION
Non-thermal electrons generated in the impulsive phase of a flare are observed in hard X-ray, -ray, and microwaves. The light curves in these wavelengths show short-lived bursts with durations between 10 s and 10 min (Dulk et al., 1985). These bursts include smaller pulses with shorter duration, and they sometimes show periodicity.
A good example of such quasi-periodic pulsations (QPPs) was seen in a flare on 1980 June 7 (Kiplinger et al., 1983). Nakajima et al. (1983) and Kane et al. (1983) examined the temporal evolution of the X-ray and radio spectra and the spatial structure of the flare. They suggest that the quasi-periodic pulses indicate a modulation of the particle injection/acceleration rate. Tajima, Brunel, & Sakai (1982) showed by numerical simulation that stored magnetic energy is explosively transformed to particle acceleration. They also suggest that the current loop coalescence instability induces the QPPs. Moreover, Tajima et al. (1987) showed that the period of the QPP is equal to the Alfvén transit time ‘across’ the current loop. However, these works were mainly based on the total flux, and the detailed spatial configuration of the flare that shows QPP is still unknown.
On 1998 November 10 a solar flare (C7.9 on the GOES scale) occurred in NOAA 8375. The flare was observed by Yohkoh (Ogawara et al., 1991) and the Nobeyama radio observatory, and clearly showed quasi-periodic behavior in the hard X-ray and microwave time profiles. In this paper we analyze the QPP using the high resolution X-ray and microwave images. Then we compare the period of the QPP with typical time-scales of flare loops. Finally, we discuss the effect of the magnetic structure on the particle injection/acceleration rate.
2 OBSERVATIONS
The solar flare occurred in NOAA 8375 (N19, W78) at 00:10 UT, 1998 November 10. Microwave images of the flare were taken with the Nobeyama Radioheliograph (NoRH; Nakajima et al. 1994) which observed the sun at 17 and 34 GHz with a temporal resolution of 1.0 s. The spatial resolutions of NoRH data are for 17 GHz and for 34 GHz. The Nobeyama Radio Polarimeter (NoRP; Torii et al. 1979; Shibasaki et al. 1979; Nakajima et al. 1985) measured the total flux of the flare at 1, 2, 3.75, 9.4, 17, 34 and 80 GHz with a temporal resolution of 0.1 s. The hard X-ray images were obtained with the hard X-ray telescope (HXT; Kosugi et al. 1991) aboard Yohkoh, with a spatial and temporal resolution of about 5′′ and 0.5 s, respectively. The soft X-ray images were also obtained with the Yohkoh soft X-ray telescope (SXT; Tsuneta et al. 1991). We used full resolution images in the Partial Frame Image mode with a spatial resolution of about .
Figure 1 shows the microwave, soft X-ray, and hard X-ray time profiles. The top solid line is that of NoRH 17 GHz, the second dotted line is the GOES 1.0 - 8.0 Å channel, the third solid line is the HXT M1 band (23 - 33 keV), and the bottom solid line is the HXT L band (14 - 23 keV). Four bursts with duration between 10 and 30 s are seen in the microwave and hard X-ray emission. The fine spikes in the second burst clearly show the QPPs in both microwaves and hard X-rays. In this paper we investigate the quasi-periodic nature of the second burst.
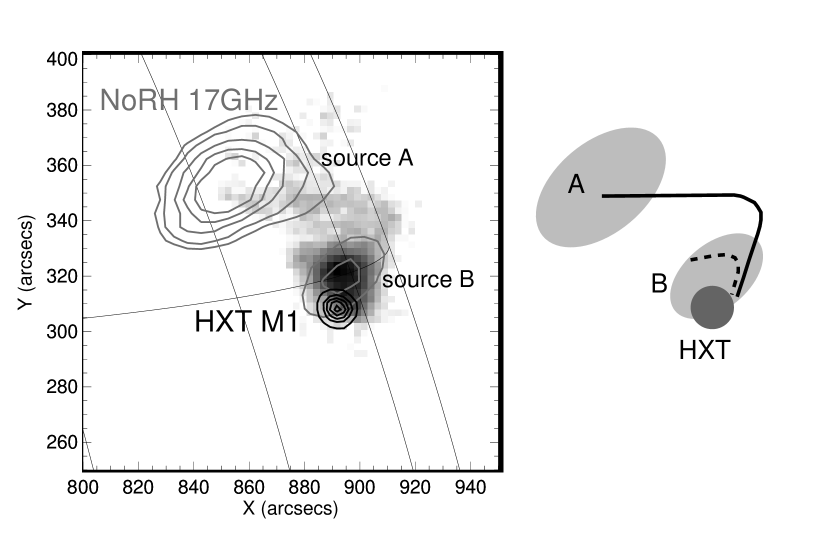
Figure 2 shows the images of NoRH/17 GHz, the HXT/M1 band, and SXT at the second burst. The flare shows a double source in the microwave data (gray contours). We refer to the northern and brighter source as the source “A” and the other one as source “B”. On the other hand, in the hard X-ray data (black contours) only one source is seen near source “B”. This is common in the L and M1 bands of HXT, but it is unknown whether it is also common in the M2 (33 - 53 keV) and H (53 - 93 keV) bands. We could not synthesize the hard X-ray images in these bands at the time due to insufficient counts. The soft X-ray image (gray scale) shows a small bright kernel at the same region at source “B”. We can also see a faint loop which connects the bright kernel and the radio source “A”.
3 PERIODIC PULSATION
Figure 3 presents the hard X-ray and microwave time profiles for the second burst, from 00:14:20 UT to 00:14:40 UT. The QPPs are clearly seen. In the time profiles obtained with the NoRP data the QPPs are seen in 9.4 and 17 GHz. The period calculated from the autocorrelation function of the time profiles was 6.6 s. We also calculated the period of the QPPs in hard X-rays (M1 and M2 bands), and found that the period (6 s) was almost the same as those in NoRP. We analyzed the microwave spectrum using the NoRP data and found that the power-law distribution index was about and the turn-over frequency was about 10 GHz. These results indicate that the emission of the QPP originated from gyrosynchrotron radiation from non-thermal electrons. Since both the time profiles of the M1 and M2 bands clearly showed the QPPs, the emission in hard X-rays was also produced by non-thermal electrons.
As described in section 2, the flare has two microwave sources (see Figure 2). We found that the time profile of source “A” showed the QPP, while that of source “B” did not. The pulsating source is different from the hard X-ray source that is located near source “B”. To clarify the relation between the microwave pulsation at source “A” and the hard X-ray pulsation, we calculated the correlation between the time profiles of 17 GHz and the M1 band as a function of the time lag between them. The maximum correlation was found for a delay of the microwave pulsation with a time of 0.6 – 1.0 s.
We suggest that the acceleration site lies near the hard X-ray source, and that the delay time between microwaves and hard X-rays is explained by the flight duration of non-thermal electrons between both the sources. The length of the soft X-ray faint loop connecting the hard X-ray source and source “A” is about km. If we assume that the velocity of the electrons is about km s-1 ( 30 % of the speed of light), the delay time between microwaves and hard X-rays is about 0.5 s, which is almost equal to the observed delay time. The soft X-ray images show two parts related to the flare: a bright kernel near source “B” and a faint large loop connecting the kernel and source “A” (see Figure 2). We believe that the flare occurred at the contact region of the two parts via magnetic reconnection (Hanaoka, 1997; Heyvaerts, Priest, & Rust, 1977). In such a scenario, the acceleration site would be located near the reconnection site. Hence, it is reasonable to suggest that the acceleration site is located near source “B” and the hard X-ray source.
Here, another question occurs; why did the time profile of the microwave source “B” not show the QPP? As an answer, we suggest that the emission mechanism of source“B” differs from that of source “A”. The emission mechanism of source “A” is optically-thin gyrosynchrotron radiation from non-thermal electrons. On the other hand, the dominant emission mechanism of source “B” is optically-thin thermal Bremsstrahlung since the spectrum index of source “B” that is derived from the 17 and 34 GHz is about 0. Therefore, the time profiles of source “B” do not show the population of the accelerated/injected non-thermal electrons. To confirm the suggestion, we estimated the thermal radio flux from source “B” by using the temperature and the emission measure of SXT bright kernel (see section 4), and found that the flux was almost the same as the observed flux of source “B”. We also suggest that the thermal emission was radiated from the thermal plasma that was confined by the flare loops. The loops were formed at the first burst via magnetic reconnection. Therefore, although the fine structure of the kernel is not resolved in the SXT images, we think that it consists of the main flare loops (see Figure 2).
4 TYPICAL TIMESCALES OF FLARE LOOP
In the previous section we showed that the period of the pulsation was 6.6 s. What is the explanatin for the period? To answer the question, we derive some typical time-scales of the flare loop and discuss them. Temperature, density, size, and magnetic field strength of the flare loop are needed for the estimation. The temperature and the volume emission measure are derived from the soft X-ray images which were taken with the SXT thick aluminum (Al12) and beryllium (Be) filters. The region of flare loop is defined as the region where the intensity of an SXT Be filter image is more than 2,000 DN s-1 pix-1. This leads to an area of 2.5 cm2. Using the filter ratio method (Hara et al., 1992), the average temperature and volume emission measure over the flare loop are calculated to be 9.4 MK and 8.11048 cm-3, respectively.
Here, we assume that the kernel is a cube, and that the volume of the flare kernel is the area to the power of three halves, i.e. . Then, the number density in the top of the flare loop becomes . Also, the acoustic velocity in the flare loop is given by , where is Boltzmann’s constant; is the proton mass; is the ratio of specific heats and is here assumed to be . Since the structure of the flare loop is not resolved in the SXT images, we can not measure the length and width of the flare loop correctly. Therefore, we use the square root of the area instead of the length of the flare loop ( 16,000 km). Then, the acoustic transit time along the flare loop is . On the other hand, if we use the width of the faint loop instead of the width of the flare loop ( 6,000 km), the acoustic transit time across the flare loop becomes . Both the time-scales are much longer than the observational period of the QPP (6.6 s).
In order to derive the Alfvén transit times of the flare loop, we have to estimate the magnetic field strength in the corona. However, this estimation is difficult in our case as; (1) we can not measure the magnetic field strength of the corona directly, (2) we can not obtain the actual magnetic field strength in the photosphere at the flare region since it is located near the north-west limb. Therefore, we calculate the potential field of the flare region based on a magnetogram on November 6. The magnetogram was obtained with the Michelson Doppler Interferometer (MDI; Scherrer et al. 1995) aboard the Solar and Heliospheric Observatory (SOHO; Domingo et al. 1995). The field strength on the apex of the flare loop is estimated to be about 300 G using the potential field extrapolation by the software package MAGPACK2 (Sakurai, 1982). As a result, the Alfvén velocity in the flare loop becomes . Then, the Alfvén transit time ‘along’ the flare loop is and the Alfvén transit time ‘across’ the flare loop is .
The values of our estimations are summarized in Table 1. Although the Alfvén transit time is sensitive to the magnetic field strength estimated above, the transit time along the flare loop () is the most similar to the observational period of the pulsation in microwave and hard X-rays.
5 DISCUSSION
We investigated the impulsive phase of the flare whose time evolution showed a clear QPP in microwaves and hard X-rays. We found that the periods of the QPP were 6.6 s and that the acceleration site of non-thermal electrons was located near source “B” using correlation analysis of the time profiles. Then, we estimated some typical time-scales of the flare loop from the observational data and found that the Alfvén transit time along the flare loop was close to the period of the pulsation.
Tajima et al. (1987) suggest that the periods of QPP in microwaves and hard X-rays are equal to an Alfvén transit time ‘across’ the flare loop (). However, this transit time was much shorter than the observational period of the QPP. This implies that the origin of the periodic pulsation in our case is not the coalescence instability in the reconnection site.
Recently, Transition Region and Coronal Explorer (TRACE; Handy et al. 1999) observations have shown coronal loop oscillations that was induced by a flare (Nakariakov et al., 1999). T. Miyagoshi (in preparation) performed three-dimensional MHD simulations of the coronal loop oscillation and found that the period of the loop oscillation is equal to the Alfvén transit time ‘along’ the oscillating loops (). Does the oscillation of the coronal loop relate with the particle acceleration/injection? Tsuneta & Naito (1998) propose that non-thermal electrons can efficiently be accelerated by a first order Fermi process at the fast shock located below the reconnection X-point. They suggest that the accelerated electrons are trapped between the two slow shocks, and that the energy injection depends on the length of the fast shock which is pinched by these slow shocks. If the reconnected (flare) loop that is located under the fast shock is oscillating, then the length of the fast shock probably varies with the loop oscillation, synchronously. Hence, we propose, under the hypothesis of the acceleration model proposed by Tsuneta and Naito (1998), that the origin of the QPP in microwaves and hard X-rays is the modulation of the acceleration/injection of non-thermal electrons. Moreover, we propose that the modulation is produced by the variations of macroscopic magnetic structures, for example, oscillations of coronal loops.
References
- Domingo et al. (1995) Domingo, V., Fleck, B., and Poland, A. I., 1995, Sol. Phys., 162, 1
- Dulk et al. (1985) Dulk, G. A., McLean, D. J., & Nelson, G. J., 1985, Solar Radiophysics: Studies of emission from the sun at metre wavelengths, ed.s McLean D. J. & Labrum N. R. (Cambridge: Cambridge University Press), 53
- Hanaoka (1997) Hanaoka, Y., 1997, Sol. Phys., 173, 319
- Handy et al. (1999) Handy, B. N., et al., Sol. Phys., 187, 229
- Hara et al. (1992) Hara, H., Tsuneta, S., Lemen, J. R., Acton, L. W., and McTiernan, J. M., 1992, PASJ, 44, 135
- Heyvaerts, Priest, & Rust (1977) Heyvaerts, J., Priest, E. R., and Rust, D. M., 1977, ApJ, 216, 123
- Kane et al. (1983) Kane, S. R., Kai, K., Kosugi, T., Enome, S., and Landecker, P. B., & McKenzie, D. L., 1983, ApJ, 271, 376
- Kiplinger et al. (1983) Kiplinger, A. L., Dennis, B. R., Frost, K. J., & Orwig, L. E., 1983, ApJ, 273, 783
- Kosugi et al. (1991) Kosugi, T., et al., 1991, Sol. Phys., 136, 17
- Nakajima et al. (1983) Nakajima, H., Kosugi, T., Kai, K., & Enome, S., 1983, Nature, 305, 292
- Nakajima et al. (1985) Nakajima, H., et al., 1985, PASJ, 37, 163
- Nakajima et al. (1994) Nakajima, H., et al., 1994, in Proc. of the IEEE, 82, 705
- Nakariakov et al. (1999) Nakariakov, V. M., Ofman, L., DeLuca, E. E., Roberts, B., & Davila, J. M., 1999, Science, 285, 862
- Ogawara et al. (1991) Ogawara, Y., Takano, T., Kato, T., Kosugi, T., Tsuneta, S., Watanabe, T., Kondo, I., & Uchida, Y., 1991, Sol. Phys., 136, 10
- Sakurai (1982) Sakurai, T., 1982, Sol. Phys., 76, 301
- Scherrer et al. (1995) Scherrer, P. H., et al., 1995, Sol. Phys., 162, 129
- Shibasaki, Ishiguro, & Enome (1979) Shibasaki, K., Ishiguro, M., Enome, S., 1979, in Proc. of the Res. Inst. of Atmospherics, Nagoya Univ., 26, 117
- Tajima, Brunel, & Sakai (1982) Tajima, T., Brunel, F., and Sakai, J., 1982, ApJ, 258, L45
- Tajima et al. (1987) Tajima, T., Sakai, J., Nakajima, H., Kosugi, T., Brunel, F., & Kundu, M. R., 1987, ApJ, 321, 1031
- Torii et al. (1979) Torii, C., Tsukiji, Y., Kobayashi, S., Yoshimi, N., Tanaka, H., Enome, S., 1979, in Proc. of the Res. Inst. of Atmospherics, Nagoya Univ., 26, 129
- Tsuneta et al. (1991) Tsuneta, S., et al., 1991, Sol. Phys., 136, 37
- Tsuneta & Naito (1998) Tsuneta, S., and Naito, T., 1998, ApJ, 495, L67
Table 1: Physical values of flare loop
| area () | 2.5 | [cm2] |
|---|---|---|
| volume () | 4.0 | [cm3] |
| length () | 1.6 | [cm] |
| width () | 6.0 | [cm] |
| temperature () | 9.4 | [K] |
| number density () | 4.5 | [cm-3 ] |
| magnetic field () | 300 | [G] |
| acoustic velocity () | 3.6 | [km s-1] |
| Alfvén velocity () | 3.1 | [km s-1] |
| acoustic transit time | ||
| along the loop () | 44 | [s] |
| across the loop () | 17 | [s] |
| Alfvén transit time | ||
| along the loop () | 5.1 | [s] |
| across the loop () | 1.9 | [s] |