Discovery of a 1247 s pulsar in the Be X-ray binary SAX J2239.3+6116
A search for pulsations from the Be X-ray binary SAX J2239.3+6116, through observations with the Narrow Field Instruments on BeppoSAX and the Proportional Counter Array on RXTE, yielded the clear presence of a 1247 s coherent oscillation. Given the fairly high X-ray luminosity on previous occasions (up to a few times 1036 erg s-1 in 2 to 28 keV), the oscillation must be due to the spin of a neutron star. Assuming that the 262 day recurrence time is the orbital period, SAX J2239.3+6116 has both the longest orbital period and the longest pulse period of 24 Be X-ray binaries with measured orbital periods.
Key Words.:
stars: neutron – pulsars: SAX J2239.3+6116– X-rays: binaries1 Introduction
SAX J2239.3+6116 was discovered as a moderately bright X-ray transient through serendipitous observations with the Wide Field Cameras (WFCs) on BeppoSAX in 1997 and 1999 (In ’t Zand et al. 2000). A subsequent archival search of data from the All-Sky Monitor (ASM) on RXTE showed four unambiguous outbursts from the same source, one of which is simultaneous with a WFC detection. The five outbursts thus observed occurred with regular intervals of d. The highest X-ray flux ever measured was sampled with the WFCs at 1 10-9 erg cm-2 s-1 (2-28 keV). A 20 ksec exposure with the Narrow Field Instruments on BeppoSAX in 1998 resulted in a more accurate X-ray position. Optical follow-up observations of this error box revealed a candidate optical counterpart: a Be star at an estimated distance of 4.4 kpc. The combination of periodicity, peak flux and optical counterpart prompted In ’t Zand et al. (2000) to classify SAX J2239.3+6116 as a Be X-ray binary (BeXB) with an orbital period of 262 d. Pulsations, a common attribute of a BeXB, were not found but the limits were not very constraining, simply because no sensitive X-ray measurements had been obtained during an outburst.
High-mass X-ray binaries (combining the catalog of Liu, van Paradijs & van den Heuvel 2000 with more recent results) include 24 BeXBs with measured orbital periods . Interestingly, SAX J2239.3+6116 is the case with the longest , followed by X Per (250.3 d; Delgado-Martí et al. 2001) and GS 1843-024 (242.18 d; Finger et al. 1999). It is expected, based on the / correlation found in the ’Corbet’ diagram (Fig. 6), that if SAX J2239.3+6116 contains a pulsar it should have a pulse period near s. A non-detection would bring a black hole hypothesis into serious consideration (like for 4U 1700-377, see Brown et al. 1996).

We set out to search for the X-ray pulsar with sensitive measurements, at times when the transient is active. The first opportunity to do so was presented by the fifth BeppoSAX Announcement of Opportunity in which we applied for target-of-opportunity observations at the earliest occurring outburst.
2 Observations, light curve and spectrum
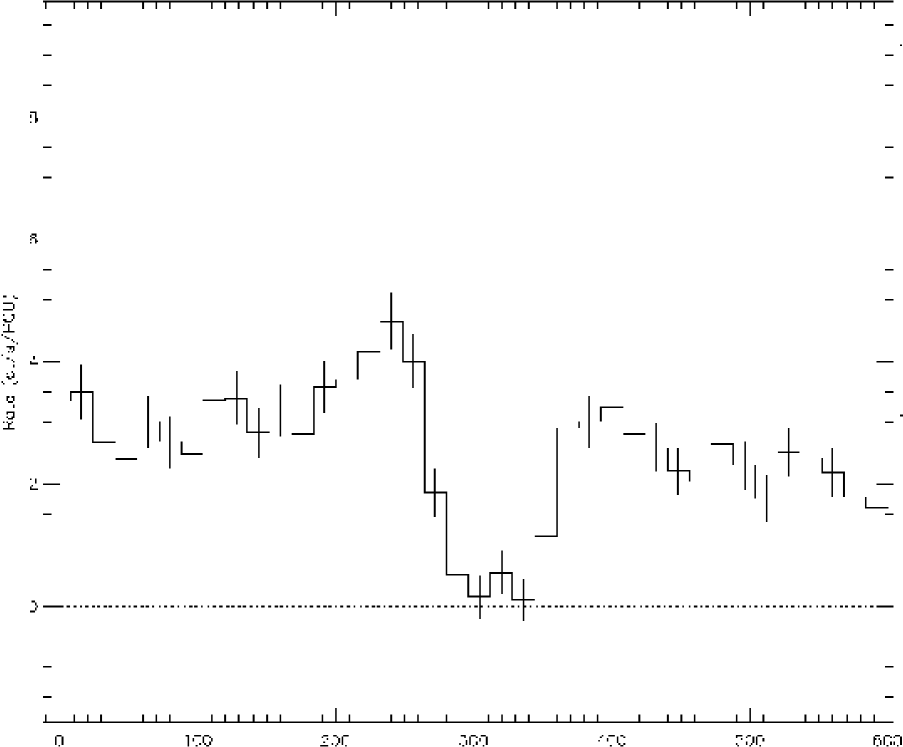
The ephemeris as determined from the ASM data predicted an outburst on July 7, 2001 (MJD 52098), with an uncertainty of approximately 10 days. Since the anticipated peak flux was too low for ASM observations to be able to trigger the BeppoSAX observation, public snapshot observations were initiated with the sensitive Proportional Counter Array (PCA) on RXTE on June 30, 2001. The PCA (e.g., Jahoda et al. 1996) consists of five non-imaging Proportional Counter Units (PCUs) with collimators that limit the field of view to 1° full-width at half maximum (FWHM). The collecting area is 6500 cm2 and the bandpass 2 to 60 keV. The snapshot observations were performed roughly every two days. Nine measurements were carried out in total with exposure times between 0.78 and 2.10 ksec, some with 5 PCUs operating, and some with only 2 PCUs. The last one was on July 12. Fig. 1 shows the light curve generated from part of these data. SAX J2239.3+6116 was first detected in the sixth snapshot observation on July 8th. In Fig. 2 we show the light curve of this 6th observation with 16 s time resolution. The light curve shows considerable variability without a clear periodicity. Most notably, there is a 80 s long dip during which the flux drops to near zero. The mid-time of the dip is MJD 52098.09305. For the 7th and 8th observation there was also similar variability although less definitive because fewer detectors were on.
The PCA detection triggered our TOO with the BeppoSAX Narrow Field Instruments (NFI). The NFI consist of 4 devices. The Low-Energy and Medium-Energy Concentrator Spectrometers (LECS and MECS) are imaging devices in the 0.1 to 10 keV band (Parmar et al. 1997 and Boella et al. 1997). SAX J2239.3+6116 was not unambiguously detected in the other two devices, consistent with their sensitivities. The observation was carried out between July 12.803 and 13.851 UT (MJD 52102.803 through 52103.851). The net exposure times are 40,039 s for the MECS and 17,952 for the LECS. We analyzed the data in a standard manner, by accumulating photons within 4′ (MECS) or 8′ (LECS) from the source centroid. We applied a background correction by employing long-duration data from high latitude fields, grouped energy channels such that at least 20 photons are present in each bin, and used standard response matrices. The validity of the background model was verified through a comparison of both data sets (i.e., the high latitude and the source data sets) for photons further than 5′ and 10′ from the source centroid for the MECS and LECS respectively. The MECS detected photons from SAX J2239.3+6116 and the LECS . For the spectral analysis, the bandpasses were restricted to the photon-rich and well-calibrated ranges of 1.0-4.0 keV for the LECS and 1.6-10.5 keV for the MECS. The data could be fitted satisfactorily with a simple absorbed power law model ( for degrees of freedom). The photon index is , the absorbing column density cm-2, and the average 2 to 10 keV flux erg cm-2 s-1 ( erg cm-2 s-1 unabsorbed). Over the course of the observation the source showed a decreasing trend with a flux reduction of %.
Observation 6 of the PCA gives a spectrum for which the 2.5-30 keV range can be fit acceptably with a power law or a power law with a high energy cut-off. If the column density is fixed at the value seen with the LECS and MECS, the power law photon index when the source was seven times brighter was 1.10.2, with a high energy cut-off beginning at 6.30.9 keV and e-folding energy of 71 keV. The 2-10 keV flux is erg cm-2 s-1. The spectral shape is typical for an accretion-powered pulsar (e.g., White et al. 1983, Mihara 1995, Dal Fiume et al. 2000).
3 Detection of oscillations


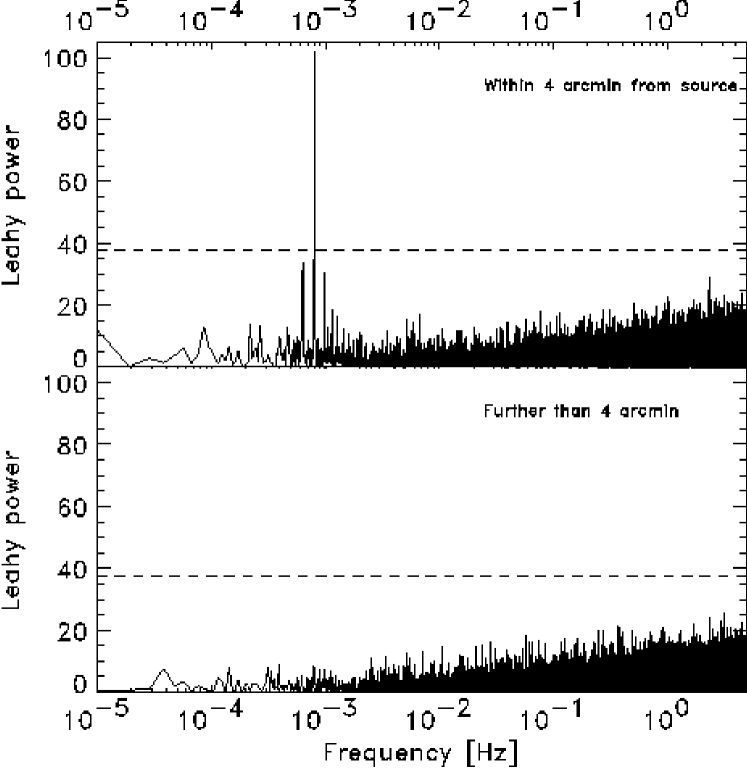
Fig. 3 shows the Fourier power density spectrum of all MECS photons (i.e., without background subtraction), both from within the source point-spread function and outside. A clear peak is present at 0.80 mHz, with sidelobes separated by 0.18 mHz from the main peak due to aliasing through occultations by the Earth during each BeppoSAX orbit and passages through the South-Atlantic Geomagnetic Anomaly. As a check on the reality of the oscillation, we confirmed that the non-source photons of the same observation show no power at the relevant frequency. A periodogram of the same data for the source photons, see Fig. 4, gives the most accurate measurement of the period: s. We identify this as a pulsar signal.
Fig. 5 shows the light curve folded with this period. There is a broad peak and the modulation depth is %. A conspicuous feature is a dip at phase 0.65. The epoch of this dip is MJD 52102.81318. The PCA data show a dip of similar duration but larger depth (Fig. 2). The time difference between both dips is pulse cycles which is consistent with both dips having identical pulse phases. PCA observations 7 and 8 show similar dips at similar phases but with different depths. Assuming the dips are phase locked, we can refine the pulse period to s. Features likes this dip are not uncommon in pulse profiles of accretion-powered X-ray pulsars, particularly at energies below 10 keV (for recent overviews of pulse profiles, see Mihara 1995 or Bildsten et al. 1997).
4 Discussion

The ASM data between January 1996 and July 2001 encompass eight predicted times of outbursts, but only the first four are readily detectable above a threshold of about 1 mCrab. The 262 d orbital period was basically determined from those four ASM detections (In ’t Zand et al. 2000). The fifth outburst detected with WFC is consistent with that periodicity. Given the lack of clear outbursts afterwards, one might perhaps wonder whether the 262 d periodicity is well defined and can be identified with the orbital period. Quasi-periods of similar magnitude and variable peak flux have been found in other X-ray binaries without being associated to the orbit (e.g., in Terzan 6, see In ’t Zand et al. 1999). We argue that the periodicity in SAX J2239.3+6116 is indeed the orbital period, because the coherence of the periodicity is rather high and because orbital periods of this magnitude are expected for BeXBs and the optical Be-star identification is rather secure (the estimated chance probability is less than 10-4 which is low for such a high-flux source, see also In ’t Zand et al. 2000) . The fact that the outbursts have become harder to see in the ASM data is very likely due to them becoming significantly shorter: the average duration of the first four outbursts was about 1 month, while the July 2001 outburst appears to have lasted just a few days. The orbital period using the timing of the July 2001 outburst reveals a refined value of which is close to what was measured previously but more precise.
Could the compact object be a white dwarf rather than a neutron star? The distance of 4.4 kpc (In ’t Zand et al. 2000) implies that the maximum 2-28 keV luminosity ever measured was 2.3 1036 erg s-1. This is 3 orders of magnitude above what is normal for non-synchronously rotating magnetic white dwarfs accreting from a companion star (e.g., Eracleous et al. 1991 and Patterson 1994). A number of white dwarf systems have been observed with erg s-1 luminosities or higher, but those have supersoft spectra (with of order a few tens of eV; e.g., Gänsicke et al. 2000). SAX J2239.3+6116 did not, and we dismiss the white dwarf scenario.
The variably-peaked (1.5 mCrab for the July 2001 outburst and 20 mCrab for the May 1997 outburst111one should keep in mind that peak fluxes may be biased because of sparse sampling) and periodic outburst behavior are typical for Type I BeXB outbursts (e.g., Stella et al. 1986 and Bildsten et al. 1997) which are explained as due to increased mass accretion rates by the compact object when, during periastron in an eccentric orbit, it passes through denser parts of the companion wind without forming an accretion disk.
The values of spin period and orbital period for accretion-powered pulsars with high-mass companion stars have been shown to qualitatively reflect the nature of the stellar wind and the history of the neutron-star’s interaction with it (Corbet 1984; Waters & van Kerkwijk 1989). Figure 6 shows the position of SAX J2239.3+6116 in the – diagram for the periods 1247 s and 262 d. It would be at the long period end of the distribution of pulsars with Be star companions, where that distribution meets the distribution of supergiants. Since this system has faint X-ray outbursts for only a part of a long orbital period, determination of orbital parameters through Doppler shifts of the spin period will be difficult. Pulse period changes are easier to measure. Given the accuracy obtained for the July 2001 outburst, spin-up time scales of less than 103 yr are measurable between two outbursts. This would cover time scales seen in some systems which can be as short as 10 to 100 years (Bildsten et al. 1997).
Acknowledgements.
We thank the BeppoSAX Time Allocation Committee for the installation of a provisional AO5 target list before final review, which made possible the observation here discussed. Also, we thank the staff at the BeppoSAX Science Operation Center and Data Center for guidance of this observation. JZ acknowledges financial support from the Netherlands Organization for Scientific Research (NWO). This research has made use of SAXDAS linearized and cleaned event files (Rev.2.1.4) produced at the BeppoSAX Science Data Center. BeppoSAX is a joint Italian and Dutch program.References
- Bildsten et al. (1997) Bildsten, L., Chakrabarty, D., Chiu, J., et al. 1997, ApJS, 113, 367
- Boella et al. (1997b) Boella, G., Chiappetti, L., Conti, G., et al. 1997, A&AS, 122, 327
- Brown (1996) Brown, G.E., Weingartner, J.C., Wijers, R.A.M.J. 1996, ApJ, 463, 297
- Corbet (1984) Corbet, R.H.D., 1984, A&A, 141, 91
- Dal Fiume (2000) Dal Fiume, D., Orlandini, M., Del Sordo, S., et al. 2000, Adv. Space Res., 25, 399
- Delgado (2001) Delgado-Martí, H., Levine, A.M., Pfahl, E., Rappaport, S.A. 2001, ApJ, 546, 455
- Eracleous (1991) Eracleous, M., Halpern, J., Patterson, J. 1991, ApJ, 382, 290
- Finger et al. (1999) Finger, M.H, et al. 1999, ApJ, 517, 449
- Gaensicke et al. (2000) Gänsicke, B. T., van Teeseling, A., Beuermann, K., Reinsch, K. 2001, New Astron. Rev., 44, 143
- In ’t Zand et al. (1999) In ’t Zand, J.J.M., Bazzano, A., Cocchi, M., et al. 1999, A&A, 355, 145
- In ’t Zand et al. (2000) In ’t Zand, J.J.M., Halpern, J., Erracleous, M., et al. 2000, A&A, 361, 85
- Jahoda et al. (1996) Jahoda, K., Swank, J.H., Stark, M.J., Strohmayer, T., Zhang, W., Morgan, E.H. 1996, Proc. SPIE, 2808, 59
- Leahy et al. (1983) Leahy, D.A., Darbro, W., Elsner, R., et al. 1983, ApJ, 266, 160
- Liu et al. (2000) Liu, Q.Z., van Paradijs, J., van den Heuvel E.P.J., 2000, A&A, 362, 1083
- Mihara (1995) Mihara, T. 1995, PhD Thesis, Univ. Tokyo
- Parmar (1997) Parmar, A.N., Martins, D.D.E., Bavdaz, M., et al., 1997, A&AS, 122, 309
- Patterson (1994) Patterson, J. 1994, PASP, 108, 209
- Stella et al. (1986) Stella, L., White, N.E., Rosner, R. 1986, ApJ, 308, 669
- Waters & Van Kerkwijk (1989) Waters, L.B.F.M., van Kerkwijk, M.H. 1989, A&A, 223, 196
- White et al. (1983) White, N.E., Swank, J., Holt, S.S. 1983, ApJ, 270, 711