Surface brightness fluctuation distances for nearby dwarf elliptical galaxies ††thanks: Based on observations collected at the Nordic Optical Telescope
We obtained deep and -band CCD images for the dwarf elliptical (dE) galaxies DDO 44, UGC 4998, KK98 77, DDO 71, DDO 113, and UGC7356 at the Nordic Optical Telescope. Employing Fourier analysis technique we measure stellar -band surface brightness fluctuations (SBFs) and magnitudes in 29 different fields of the galaxies. Independent tip of the red giant branch distances for DDO 44, KK98 77, DDO 71 are used to convert their set of apparent into absolute SBF magnitudes. The results are combined with the corresponding local colours and compared with the relation for mainly old, metal-poor stellar populations as predicted by Worthey’s population synthesis models using Padova isochrones. While the colour dependency of the theoretical relation is confirmed by the empirical data, we find a systematic zero point offset between observations and theory in the sense that models are too faint by mag. Based on these findings we establish a new semiempirical calibration of the SBF method as distance indicator for dE galaxies with an estimated uncertainty of 10%. Taking first advantage of the improved calibration, we determine SBF distances for the other three early-type dwarfs UGC 4998, DDO 113, and UGC7356. Although found in the M81 group region, previous velocity measurements suggested UGC 4998 is a background galaxy. This picture is confirmed by our SBF distance of Mpc. We can further identify DDO 113 as a faint stellar system at the near side of the Canes Venatici I (CVn I) cloud at a distance of Mpc. The second CVn I member in our sample, UGC7356, lies at Mpc and spatially close to NGC 4258 (M 106). We derive surface brightness profiles and colour gradients for all dwarfs and determine photometric and Sérsic parameters. Finally, we discuss two non-stellar objects in DDO 71 and UGC 7356 which may resemble globular clusters.
Key Words.:
galaxies: clusters: individual: NGC 2403 group, M81 group, CVn I cloud – galaxies: dwarf – galaxies: individual: DDO 44, UGC 4998, KK98 77, DDO 71, DDO 113, UGC 7356 – galaxies: stellar content – galaxies: structure1 Introduction
In recent years, deep galaxy surveys of the vicinity of the Local Group (Côté et al. 1997; Karachentseva & Karachentsev 1998; Jerjen et al. 2000) revealed a significant number of very low surface brightness galaxies. As these most elusive stellar systems in the universe have been identified primarily on morphological grounds their distances remain generally unknown. However, many of them are expected to be nearby dwarf galaxies and as such preferred targets for studies related to galaxy formation and evolution or dark matter.
While the gas-rich dwarfs, the dwarf irregulars (Irrs), can be located relatively easily in space from 21 cm radio observations (Huchtmeier et al. 2000), dwarf elliptical galaxies (hereafter dEs, subsuming “dwarf spheroidals”, see Ferguson & Binggeli 1994) have a low gas content and thus remain undetected in H i. Moreover, their low surface brightness makes optical spectroscopy feasible only for the few brightest objects (Jerjen et al. 2000, hereafter JFB00). Hence, the only way to identify nearby diffuse dEs and to unveil their physical nature is to estimate their distances from their stellar contents.
In principal, the distance of a dE can be obtained via the colour-magnitude diagram (Armandroff et al. 1999), the tip of the red giant branch (TRGB) magnitude (e.g. Karachentsev et al. 2000, hereafter K00), or the RR Lyrae stars (Saha & Hoessel 1990). But the requirement of resolving the galaxy into stars makes these methods costly and time consuming. A more practical and similarly accurate distance indicator would be required if distances for a larger number of dE candidates shall be measured in an efficient way. Such a distance indicator provides a powerful tool to explore the spatial distribution of a statistically meaningful sample of nearby dEs out to a distance Mpc and beyond. As dEs are the best tracers of high-density regions (known as the morphology-density relation, Binggeli et al. 1990) they flag the gravitational centres in the Local Volume and thus hold valuable information on the substructure of the Supergalactic plane where most of the nearby galaxies are concentrated (e.g. Jerjen et al. 1998, hereafter JFB98; Binggeli 2001 and references therein).
In search for an efficient and accurate distance indicator for dEs, Jerjen and collaborators (JFB98; JFB00) tested the Surface Brightness Fluctuation (SBF) method. This method was introduced by Tonry & Schneider (1988) to measure distances to high surface brightness giant ellipticals. It is based on the discrete sampling of a galaxy image with the CCD detector and the resulting pixel-to-pixel variance due to the light of unresolved RGB stars. Analysing CCD data obtained at the 2.3m SSO telescope, JFB98 and JFB00 successfully measured -band SBF magnitudes in dwarf galaxies found in the nearby Sculptor and Cen A groups ( Mpc).
While JFB00 showed convincingly that it is technically feasible to quantify surface brightness fluctuations in dEs, there is no empirical calibration of the SBF method as distance indicator for this galaxy type available yet due to the lack of calibrators. All reported SBF distances had to rely on the theoretical relationship between colour and absolute fluctuation magnitude that was calculated from Worthey’s (1994) population synthesis models and the Padova isochrones (Bertelli et al. 1994). First results found good qualitative agreements between SBF distances for dEs in the Cen A group and the mean group distance. However, the SBF distance for the Sculptor group dwarf ESO540-032 turned out to be significantly shorter than the value derived from the RGB tip magnitude (Jerjen & Rejkuba 2000). The existing results thus pose the questions about the reliability of the theoretical models to predict , the accuracy of the SBF method for dEs and about the limits of the method. The latter issue is related to the fact that ESO540-032 was morphologically classified as an intermediate type dwarf with optical properties of both dEs and Irrs. The mixed morphology indicates the presence of a more complex underlying stellar population (i.e. recent star formation activities and a wider spread in age and metallicity) than the predominantly old, metal–poor populations observed in genuine dEs.
To improve our understanding of the surface brightness fluctuations in dwarf elliptical galaxies we studied six nearby dEs in the northern hemisphere. DDO 44 (Karachentsev et al. 1999, hereafter K99) is a member of the NGC 2403 group, UGC 4998 (Bremnes et al. 1998) is a dwarf in the background of the M81 group, KK98 77 and DDO 71 (K00) are true members of the M81 group, and the two dwarfs DDO 113 and UGC7356 are found in the direction of the Canes Venatici I (CVn I) cloud (Tully & Fisher 1987; Binggeli et al. 1990; Bremnes et al. 2000). Of particular interest for the present study are DDO 44, KK98 77, and DDO 71 for which independent TRGB distances have been reported (K98; K00). In Table 1 we give a complete list of our galaxy sample including galaxy name, associated group, morphological type within the extended Hubble classification system (Sandage & Binggeli 1984), and coordinates.
In Sect. 2, we describe the observations and data reduction. The SBF analysis is presented in Sect. 3. We develop the semiempirical calibration of the SBF method for dEs in Sect. 4 and compare it with the model predictions based on synthetic stellar population models. We then discuss the implications of our results and derive in Sect. 5 distances for UGC 4998, DDO 113, and UGC7356. Finally, we present the integral properties of the dwarfs in Sect. 6 and draw the conclusions of this work in Sect. 7.
| R.A. | Decl. | |||
|---|---|---|---|---|
| Name | Group | Type | (J2000.0) | (J2000.0) |
| DDO44 | NGC2403 | dE | 07 34 11.4 | 66 53 10 |
| UGC4998 | M81 BG | dS0 | 09 25 12.1 | 68 22 59 |
| KK98 77 | M81 | dE | 09 50 10.5 | 67 30 24 |
| DDO71 | M81 | dE | 10 05 06.4 | 66 33 32 |
| DDO113 | CVn I | dE | 12 14 57.9 | 36 13 08 |
| UGC7356 | CVn I | dE,N: | 12 19 09.1 | 47 05 23 |
| FWHM | |||||
|---|---|---|---|---|---|
| Name | Date | (sec) | F | (′′) | |
| DDO 44 | 22 Jan | 6600 | 1.78 | 1.6 | |
| DDO 44 | 22 Jan | 7600 | 1.53 | 1.3 | |
| KK98 77 | 22 Jan | 6600 | 1.29 | 1.0 | |
| KK98 77 | 22 Jan | 5600 | 1.33 | 0.9 | |
| DDO 113 | 22 Jan | 6600 | 1.01 | 1.1 | |
| DDO 113 | 22 Jan | 6600 | 1.09 | 0.9 | |
| UGC 4998 | 23 Jan | 6600 | 1.41 | 1.0 | |
| UGC 4998 | 23 Jan | 6600 | 1.32 | 0.9 | |
| DDO 71 | 23 Jan | 6600 | 1.27 | 0.9 | |
| DDO 71 | 23 Jan | 6600 | 1.27 | 0.8 | |
| UGC 7356 | 23 Jan | 6600 | 1.08 | 1.2 | |
| UGC 7356 | 23 Jan | 4600 | 1.05 | 1.0 |
| Date | F | ZP | ||
|---|---|---|---|---|
| 22 Jan | ||||
| 22 Jan | ||||
| 23 Jan | ||||
| 23 Jan | ||||
| 24 Jan | ||||
| 24 Jan |
2 Observations and Reductions
CCD images were obtained at the 2.5 metre Nordic Optical Telescope on the nights of the 22nd-24th of January, 2001. The used instrument, the Andalucia Faint Object Spectrograph and Camera (ALFOSC), is equipped with a 2048 2048 Loral/Lesser CCD detector with a pixel size of 15 m and a plate scale of 0188, providing a field of view 64 on a side. The conversion factor is set at 1 ADU. A series of four to seven images were taken in the two and passbands for each of the six dwarf galaxies, along with bias frames, twilight flats and photometric standard star fields through the nights. The observing log is given in Table 2. The exposure time for an individual science frame was 600 seconds. Seeing was ranging from 07 to 16 and all three nights provided photometric conditions.
Image reduction was accomplished using routines within the IRAF111IRAF is distributed by the National Optical Astronomy Observatories, which is operated by the Association of Universities for Research in Astronomy, Inc., under contract with the National Science Foundation program. We removed the bias level from the images by using the bias frames and the overscan region of each image. The images were subsequently trimmed by 50 pixels to remove non-essential data from the border. Finally, each object image was divided by the corresponding median combined masterflat. Photometric calibration was achieved using the Landolt (1992) standard star fields regularly observed during each night. Aperture photometry results for each of the standard stars were compared with their Landolt magnitudes. This allowed to determine the photometric zero point (ZP), atmospheric extinction coefficient () and colour term () for each passband and night. Further analysis revealed stable extinction coefficients (variations ) throughout the observation period. The mean value was calculated for each passband and the corresponding values of ZP and were re-evaluated under this constraint. The results are summarised in Table 3. The zero points were accurate to 0.02 mag.
images from a galaxy were registered by matching the positions of reference stars on each CCD frame using starfind, xyxymatch and imalign. The sky background level was estimated by fitting a plane to selected star-free areas distributed uniformly over the CCD area but well away from the galaxy. The sky-subtracted images taken in the same passband were cleaned from cosmic rays with crreject and averaged with imcombine to increase the signal-to-noise. Finally, the resulting master images were flux calibrated.

| size | ||||||||
| Name | (pixels) | (mag) | (ADU) | (ADU) | (ADU s-1 pixel-1) | (ADU s-1 pixel-1) | ||
| (1) | (2) | (3) | (4) | (5) | (6) | (7) | (8) | (9) |
| DDO44 F1 | 120 | 25.24 | 39.9 | 0.012 | 22.8 | 0.01 | ||
| F2 | 120 | 39.8 | 0.011 | 25.5 | 0.01 | |||
| F3 | 120 | 36.7 | 0.013 | 21.7 | 0.01 | |||
| F4 | 120 | 36.5 | 0.011 | 25.4 | 0.01 | |||
| UGC4998 F1 | 70 | 25.27 | 178.9 | 0.003 | 4.5 | 0.10 | ||
| F2 | 70 | 178.8 | 0.003 | 5.1 | 0.09 | |||
| F3 | 70 | 200.7 | 0.003 | 5.7 | 0.08 | |||
| F4 | 70 | 259.1 | 0.003 | 5.0 | 0.09 | |||
| F5 | 70 | 166.6 | 0.003 | 5.0 | 0.09 | |||
| F6 | 90 | 101.5 | 0.005 | 3.6 | 0.09 | |||
| KK98 77 F1 | 100 | 25.26 | 33.5 | 0.011 | 15.0 | 0.01 | ||
| F2 | 100 | 38.3 | 0.010 | 16.3 | 0.01 | |||
| F3 | 100 | 41.6 | 0.010 | 17.3 | 0.01 | |||
| F4 | 100 | 26.9 | 0.014 | 12.0 | 0.01 | |||
| DDO71 F1 | 90 | 25.28 | 51.3 | 0.010 | 16.6 | 0.01 | ||
| F2 | 90 | 79.2 | 0.007 | 22.1 | 0.01 | |||
| F3 | 90 | 76.3 | 0.007 | 17.6 | 0.02 | |||
| F4 | 90 | 75.1 | 0.008 | 20.7 | 0.01 | |||
| F5 | 90 | 47.2 | 0.011 | 12.0 | 0.02 | |||
| DDO113 F1 | 90 | 25.28 | 30.6 | 0.012 | 24.7 | 0.01 | ||
| F2 | 90 | 48.1 | 0.009 | 31.7 | 0.01 | |||
| F3 | 90 | 25.4 | 0.017 | 21.5 | 0.01 | |||
| F4 | 90 | 30.7 | 0.014 | 24.8 | 0.01 | |||
| F5 | 90 | 25.3 | 0.014 | 22.9 | 0.01 | |||
| F6 | 90 | 46.3 | 0.009 | 31.0 | 0.01 | |||
| UGC7356 F1 | 90 | 25.29 | 117.4 | 0.005 | 9.3 | 0.04 | ||
| F2 | 90 | 63.9 | 0.009 | 7.5 | 0.03 | |||
| F3 | 110 | 54.5 | 0.011 | 5.3 | 0.04 | |||
| F4 | 90 | 38.8 | 0.014 | 5.2 | 0.03 |
3 SBF Analysis and Results
We cleaned the -band master images from foreground stars and background galaxies using procedures that follow for most parts the recipes of Tonry & Schneider (1988) and JFB00. Point sources and extended objects brighter than the cutoff magnitude mag were identified using DAOPHOT II (Stetson 1987). Contaminating objects well away from the galaxy were patched with plain sky. If the object affected the galaxy light, we replaced its area with an adjacent uncontaminated patch from the same surface brightness range.
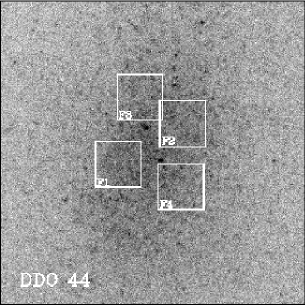
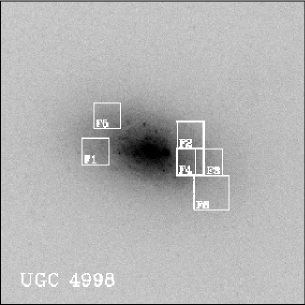
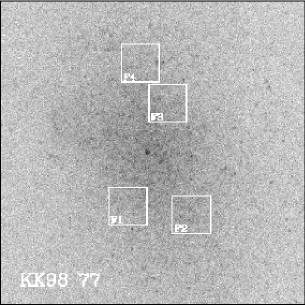
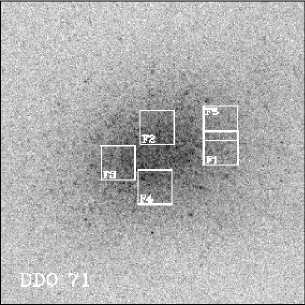
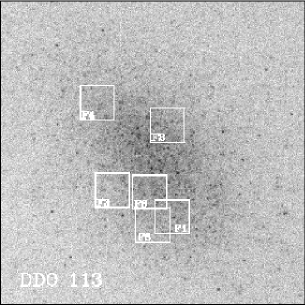
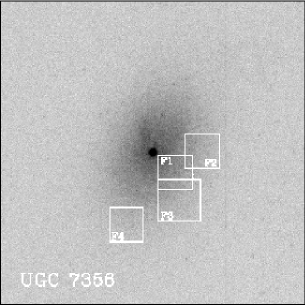
For the SBF analysis, we modelled the light distribution of the cleaned galaxy image using an isophote fitting routine that allows the centre, ellipticity, and position angle to vary. The best 2D-model of the galaxy was subtracted from the original master image and the residual image divided by the square root of the model for noise normalization. A number of square subimages (hereafter SBF fields) were then defined on the fluctuation image within the 26.5 mag arcsec-2 isophotal limit and from the parts of the galaxy that contained only small numbers of previously identified contaminating objects. The few affected pixels in a SBF field were manually replaced with randomly selected galaxy patches outside of the field and in the same surface brightness range. The fraction of pixels patched in this way was always less than 5% of the SBF field area. In total, 29 SBF fields were studied. Their sizes and their locations on the galaxy images are shown in Fig. 1. Assuming an average seeing of arcsec, a field carried the SBF signal from to independent points. The overlap between different fields was kept minimal (%) to get a set of independent SBF measurements for each galaxy.
The next step in the process was to cut out a cleaned SBF field from the fluctuation image and to compute its Fourier transform and azimuthally averaged power spectrum (Fig. 2). From isolated bright stars on the master image we determined the point spread function (PSF) profile. We then fitted a linear combination of the flux normalized and exposure time weighted PSF power spectrum and a constant at the observed galaxy power spectrum , demanding a least squares minimization. Data points at low spatial frequencies () were omitted as they are likely to be affected by imperfect galaxy model subtraction. Table 4 lists all quantities from the SBF analysis. The SBF field numbers together with the galaxy name are given in col. [1]. The pixel sizes of the SBF fields are given in col. [2]. The magnitude of a star yielding 1 ADU per second on the CCD is listed in col. [3]. (col. [6]) and (col. [7]) are the exposure time normalized amplitude of the best least squares fit at wave number and the scale-free white noise component in the power spectrum, respectively. In the case of our sky-limited exposures the latter is determined by the ratio of the sky brightness (col. [5]) and the mean galaxy surface brightness within the SBF field (col. [4]). We estimated the uncertainty of the sky level (col. [5]) by varying the galaxy growth curve (see Sect. 6). The quoted error for in col. [6] is the fitting error.
To estimate the relative contribution to the measured fluctuation power from background galaxies below the cutoff magnitude mag we employed equation (12) from Jensen et al. (1998). That formula is based on the assumption of a power-law distribution for background galaxies where galaxies deg-1 mag-1 at and (Cowie et al. 1994). The original equation for the -band was adjusted to work in the -band by assuming a typical galaxy colour of (de Jong 1996):
where is the plate scale. We calculated and determined for each SBF field the signal-to-noise S/N (col. [8]) and the ratio (col. [9]). We found that the contribution from unresolved galaxies that remained in the cleaned SBF fields was minimal (a few percent) in all but the six fields of UGC 4998 where the portion reached a top of 10 percent.
Globular cluster (GC) systems of target galaxies are another unwanted source of fluctuations that can significantly affect the SBF power measured in giant ellipticals (Jensen et al. 1998). However this effect is negligible for faint dwarf elliptical galaxies as the typical number of GCs is small in such systems. It is know from observations that none of the faintest dE companions to the Galaxy has any GCs. The lowest luminosity dwarfs in the Local Group containing GCs are Fornax () and Sagittarius (), with mag and mag, respectively (Mateo 1998). These results suggest that each of our sample galaxies may have a few GCs at most. All would be brighter than our cutoff magnitude and thus identified and removed during the cleaning process. Two GC candidates are discussed at the end of Sect. 6.
The stellar fluctuation magnitudes were determined with . Moreover, we used the cleaned galaxy images to determine the colour for each individual SBF field. Both quantities were corrected for foreground extinction using the IRAS/DIRBE maps of dust IR emission (Schlegel et al. 1998). The results are summarized in Table 5.
The overall error of is dominated by the power spectrum fitting error which accounts for 3-8%. Other sources of minor errors are the PSF normalisation (2%), the shape variation of the stellar PSF over the CCD area (1–2%) and the uncertainty in the photometric calibration mag. If we adopt a 16% error for the foreground extinction (Schlegel et al. 1998), the formal internal error for a single measurement is between 0.06 and 0.12 mag (col. [3]). The error associated with the local colour (col. [4]) has been obtained through the usual error propagation formula from the standard errors estimated from the uncertainties of the Galactic extinction, sky level and the photometry.
| AR | |||
|---|---|---|---|
| Name | (mag) | (mag) | (mag) |
| (1) | (2) | (3) | (4) |
| DDO44 F1 | 0.11 | 26.25 | 1.05 |
| F2 | 26.18 | 1.07 | |
| F3 | 26.23 | 1.01 | |
| F4 | 26.19 | 1.08 | |
| UGC4998 F1 | 0.16 | 29.03 | 1.13 |
| F2 | 28.88 | 1.09 | |
| F3 | 28.78 | 1.07 | |
| F4 | 28.94 | 1.07 | |
| F5 | 28.93 | 1.11 | |
| F6 | 29.00 | 1.17 | |
| KK98 77 F1 | 0.39 | 26.66 | 1.20 |
| F2 | 26.65 | 1.15 | |
| F3 | 26.57 | 1.12 | |
| F4 | 26.67 | 1.09 | |
| DDO71 F1 | 0.26 | 26.78 | 1.25 |
| F2 | 26.78 | 1.22 | |
| F3 | 26.80 | 1.26 | |
| F4 | 26.72 | 1.23 | |
| F5 | 26.91 | 1.26 | |
| DDO113 F1 | 0.06 | 26.23 | 1.06 |
| F2 | 26.16 | 1.00 | |
| F3 | 26.04 | 0.95 | |
| F4 | 26.05 | 0.93 | |
| F5 | 26.16 | 1.06 | |
| F6 | 26.19 | 1.00 | |
| UGC7356 F1 | 0.05 | 28.05 | 1.15 |
| F2 | 27.87 | 1.15 | |
| F3 | 28.07 | 1.14 | |
| F4 | 27.90 | 1.07 |
4 On the empirical calibration of the SBF method for dEs
As we pointed out in the introduction, existing SBF distances for nearby dEs (JFB98; JFB00) had to rely on results from synthetic stellar population models as no calibrator galaxies with independent accurate distances were available. To calibrate the apparent stellar fluctuation magnitudes , JFB00 used predictions from Worthey’s (1994) models222http://199.120.161.183/worthey/dial/dial_a_pad.html combined with the Padova isochrones (Bertelli et al. 1994). For that purpose, the theoretical relationship between absolute fluctuation magnitude and the stellar population’s integrated colour was computed for a number of single burst and simple composite stellar populations. In the first series, the populations covered the {age=8, 12, 17 Gyr} {[Fe/H]=, , …, , , , } parameter space (with [Fe/H] in the case of 17 Gyr due to model limitations). In the second series, the previously defined populations were mixed at the 10, 20 and 30% level in mass with a 5 Gyr old, solar metallicity population. In all cases we assumed a Salpeter IMF. The derived SBF distances for five dEs studied in the Cen A group (JFB00) indicated good quantitative agreement between models and observations. But for ESO540-032, an intermediate type (dE/Irr) dwarf in the Sculptor group, a significant difference between the SBF (JFB98) and TRGB distances was found (Jerjen & Rejkuba 2000). From the existing results it remains unclear whether the observed discrepancy in the latter case is due to some problems with the models or the SBF method is just not suitable to estimate distances for dwarf galaxies with mixed morphology. Obviously an empirical calibration of the SBF method would shed some light on this issue.
Only recently Karachentsev and collaborators (K99; K00) published TRGB distances for three of our sample galaxies DDO 44, KK98 77, and DDO 71 (Table 7). The TRGB method has been proven to be a reliable and accurate distance indicator for old and metal-poor stellar populations (Da Costa & Armandroff 1990; Lee et al. 1993) such as observed in early-type dwarfs. Hence, these data are well suited for a test and empirical calibration of the SBF method for dEs. We used the TRGB distances to convert the apparent fluctuation magnitudes measured in the 13 SBF fields of the three dwarfs into absolute magnitudes. The data are plotted versus their corresponding colours in the left panel of Fig.3. Superimposed are the points (open symbols) of the 116 stellar populations which we described in the previous paragraph. The solid lines represent the best analytical fits to the two branches exhibit by the model data as derived in JFB00: (parabolic branch) and (linear branch).
The calibrator data show a similar colour dependency as the parabolic branch, the part of the theoretical locus that is most exclusively defined by the very old (17 Gyr), lowly contaminated and metal-poor ([Fe/H]) populations. However there is a clear systematic shift evident between the two data sets. We computed this offset for the individual calibrators as well as for the combined data set by fitting the analytic form of the parabolic branch to the empirical data keeping the zero point as a free parameter. The error-weighted fit results are listed in Table 6.
| Name | (mag) |
|---|---|
| DDO 44 | 0.19 |
| KK98 77 | 0.08 |
| DDO 71 | 0.10 |
| All | 0.13 |
The best match for the combined data occured at a offset of mag in the sense that model magnitudes are too faint by that amount. Correcting the analytic form of the parabolic branch accordingly yielded a first semiempirical calibration for the SBF method as distance indicator for dEs:
| (1) |
The right panel of Fig.3 illustrates the situation between observations and models after the correction was applied to all model data.
A consistency check confirmed that the Padova isochrones predict the same TRGB absolute magnitude of (see Fig. 3 in Da Costa 1998) as Karachentsev et al. used in their study to derive the dE distances. Therefore a difference between models and observations at that level can be ruled out as a possible explanation for the offset. A detailed analysis of the discrepancy lies outside the scope of this paper. It is also interesting to note that all our calibrator galaxies happened to lie on the parabolic branch. This circumstance prevented an empirical test of the zero point and slope of the second component of the theoretical locus, the steeply rising linear branch, with our data. Again, we have to leave this issue to a future investigation.
5 SBF distances for UGC 4998, DDO 113 and UGC 7356
The improved calibration relation was employed to measure the SBF distances of the remaining dwarfs UGC 4998, DDO 113 and UGC 7356. All data points of a given galaxy were shifted simultaneously along the ordinate to get the best least squares fit at the parabolic branch of the new calibration (Eq. 1). These fits are shown in Fig.4 and the corresponding distance moduli for the galaxies listed in Table 6. The cumulative error from the uncertainty in a single SBF magnitude measurement, the calibration function fitting error, and the uncertainty in the calibration zero point due to the intrinsic scatter of the model values is mag. Further adopting an uncertainty of mag in the TRGB zero point (Lee et al. 1993) amounts to the quoted overall uncertainty in a SBF distance of mag.


| Distance | |||
| Name | (mag) | (Mpc) | Reference |
| (1) | (2) | (3) | (4) |
| DDO 44 | 27.52 | 3.2 | K99 |
| UGC 4998 | 30.11 | 10.5 | present paper |
| KK98 77 | 27.71 | 3.5 | K00 |
| DDO 71 | 27.72 | 3.5 | K00 |
| DDO 113 | 27.44 | 3.1 | present paper |
| UGC 7356 | 29.12 | 6.7 | present paper |
UGC 4998 is a dwarf S0 galaxy found in the region of the nearby M81 group. The mean distance of the group is Mpc (K00). Before the radial velocity of UGC 4998 was known, this galaxy was believed to be a group member. However, the measured velocity of km s-1 (Falco et al. 1999) was significantly higher than the velocity of the group centroid km s-1 and thus rendered UGC 4998 a background object. This picture is now confirmed with the SBF distance of Mpc.
DDO 113 and UGC 7356 are among the few early-type dwarfs found in the Canes Venatici I (CVn I) cloud (Binggeli et al. 1990). This loose galaxy association without an obvious concentration covers a huge area in the sky and is known to have a considerable depth as estimated from its velocity distribution. Thus it comes as no surprise that the two dwarfs span a wide range in distance. While DDO 113 is located at the near side of the CVn I cloud with a SBF distance of Mpc, UGC 7356 is found at the far side at Mpc []. The latter dwarf is only 5 arcmin away from the southern spiral arm of NGC 4258 (M 106), a well-known nearby galaxy with a distance modulus measured from observations of circumnuclear masers at (Herrnstein et al. 1999) and of Cepheids at (Maoz et al. 1999). Our result suggests that UGC 7356 is also spatially close to NGC 4258. Yet the differences in velocity (272 km s-1 versus 448 km s-1) makes the dwarf an unlikely satellite of the giant spiral. In this context another early-type dwarf NGC 4248 is a more promising candidate for a NGC 4258 companion having a heliocentric velocity of 484 km s-1 and a projected distance of 29 kpc from the spiral centre. A SBF analysis of NGC 4248 is planned to confirm the physical relation of the pair.
6 Integrated properties
The cleaned, registered, and sky-subtracted images of the galaxies (Sect. 3) were further analysed to obtained accurate broadband photometry, colour and surface brightness profiles. Using the IRAF command ellipse, the isophotes out to the 26.5 mag arcsec-2 limit on the -band image were fitted with ellipses to find the radial dependency of the centre coordinates, position angle and ellipticity. All parameters turned out to be stable within the errors and a set of mean values were calculated for each galaxy. Keeping the four parameters constant for both and -band images, we performed aperture photometry to obtain semi-major axis radial intensity growth curves. A refined sky determination was achieved by slightly varying the background level (at zero) and finding the growth curve that converged best to a plateau out to the edge of the image. The corresponding deviation from zero was subtracted from the image. The other growth curves obtained from sky variations provided an estimate of the sky uncertainty (col. [5] of Table 4). The total magnitude of the galaxy was derived from the asymptotic intensity of the growth curve. At half of the maximum we read off the half-light (“effective”) radius, , and calculated the mean surface brightness within : the “effective surface brightness” . All photometric and structure parameters for the galaxies are listed in Table 9. Moreover, we give the values for the galactic extinction in each passband (col. [3]) and the absolute magnitudes of the galaxies (col. [5]) based on the distances given in Table 5.
Differentiating the growth curves yielded the surface brightness profiles (Fig.6). As characteristic for dE galaxies (Binggeli & Cameron 1991), we found that their light profiles deviate from an exponential (straight line). While UGC4998, the most luminous dE in our sample has a cuspy profile in the inner region, all other intrinsically fainter dEs exhibit a central decrement relative to an exponential law. This trend is known as the shape parameter - luminosity relation (Davies et al. 1988; Jerjen & Binggeli 1997; JBF00). A successful way to quantify the observed variety of surface brightness shapes is offered by the Sérsic profiles (Sérsic 1968): , with a free shape parameter . This family of analytical functions encompasses both, the -law and the exponential law (). The best-fitting Sérsic profiles to our data are plotted in Fig.6 as solid lines. The corresponding model parameters, i.e. the scale length , the central surface brightness , and the shape parameter are listed in Table 9. The quoted uncertainties are the profile fitting errors.
Fig.7 shows the azimuthally averaged radial colour gradients for our dwarfs out to a corresponding isophotal radius of mag arcsec-2. The results are consistent with previous findings (e.g. Patterson & Thuan 1996) that colour gradients of early-type dwarfs are generally small.
Finally, we like to draw the attention to a feature in DDO 71: many luminous dE galaxies brighter than have a nucleus, a centrally located object that is possibly a massive GC formed in or fallen into the galaxy core region (for a review see Ferguson & Binggeli 1994). Among the nuclei, about 20% are found to be significantly displaced from the galaxy centre as defined by the overall light distribution (Binggeli et al. 2000). DDO 71 is approximately 1.5 mag fainter than the mentioned reference magnitude but first images suggested that the dwarf may have a nucleus about arcsec to the West of the centre (Bremnes et al. 1998). Our CCD image resolved this feature into two star-like objects (top panel of Fig.5). K00 suggested that the object to the East is a GC candidate (the possible galaxy nucleus) as inferred from the colour and magnitudes. Table 8 gives the corresponding basic photometry: the total apparent magnitude, colour after correction for Galactic reddening, the measured central surface brightness, and the total reddening-corrected absolute magnitude. Furthermore, we present in Table 8 the photometry for the nucleus of UGC 7356 (bottom panel of Fig.5). This nucleus is closely situated to the galaxy centre and another GC candidate. If confirmed as a GC it would have an absolute magnitude of M and thus would be comparable in luminosity with the brightest Galactic GCs (Harris 1996).
| Parameter | DDO 71 | UGC 7356 |
|---|---|---|
| R.A.(J2000.0) | 10 05 07.4 | 12 19 09.1 |
| Decl.(J2000.0) | 66 33 28.7 | 47 05 23.3 |
| 21.80 | 19.16 | |
| 1.34 | 1.08 | |
| 25.87 | 23.55 | |
| M | 10.04 |
| A | mT | M | reff | r0 | |||||
|---|---|---|---|---|---|---|---|---|---|
| Name | F | (mag) | (mag) | (mag) | (arcsec) | (mag arcsec-2) | (arcsec) | (mag arcsec-2) | n |
| (1) | (2) | (3) | (4) | (5) | (6) | (7) | (8) | (9) | (10) |
| DDO 44 | B | 0.18 | 15.44 | 51.7 | 26.00 | 59.7 | 25.27 | 1.39 | |
| DDO 44 | R | 0.11 | 14.31 | 51.8 | 24.87 | 58.7 | 24.14 | 1.33 | |
| UGC 4998 | B | 0.24 | 14.68 | 24.8 | 23.65 | 6.6 | 21.25 | 0.67 | |
| UGC 4998 | R | 0.16 | 13.45 | 26.2 | 22.54 | 8.1 | 20.30 | 0.70 | |
| KK98 77 | B | 0.62 | 15.54 | 54.4 | 26.21 | 50.9 | 25.39 | 1.20 | |
| KK98 77 | R | 0.39 | 14.20 | 52.4 | 24.79 | 48.1 | 23.95 | 1.16 | |
| DDO 71 | B | 0.41 | 15.68 | 35.0 | 25.40 | 42.0 | 24.81 | 1.50 | |
| DDO 71 | R | 0.26 | 14.32 | 36.2 | 24.11 | 39.0 | 23.40 | 1.34 | |
| DDO 113 | B | 0.09 | 15.86 | 34.3 | 25.53 | 43.7 | 24.92 | 1.51 | |
| DDO 113 | R | 0.06 | 14.79 | 35.2 | 24.52 | 43.51 | 23.90 | 1.50 | |
| UGC 7356 | B | 0.08 | 15.67 | 22.3 | 24.40 | 25.71 | 23.83 | 1.43 | |
| UGC 7356 | R | 0.05 | 14.49 | 22.0 | 23.20 | 26.53 | 22.68 | 1.51 |


7 Summary and Conclusions
We have analysed -band CCD images of six nearby dwarf ellipticals and measured stellar -band surface brightness fluctuation magnitudes and colours in 29 galaxy field. We combined our photometry data with independent TRGB distances for the three dwarfs DDO 44, KK98 77, and DDO 71, and compared the resulting empirical relation with the theoretical predictions for old, metal poor stellar populations based on Worthey’s population synthesis models and the evolutionary tracks from the Padova library. While the general colour dependency of could be confirmed, we found a systematic shift of mag between observed and model fluctuation magnitudes in the studied colour range . Once a simple offset correction was applied to match the empirical SBF zero point, the parabolic branch of the theoretical relation given by the form followed closely the empirical results and thus provided the first semiempirical calibration of the stellar fluctuation magnitudes in dEs as a function of the distance independent colour. The results indicated that the improved calibration, resting on the tip magnitude of the RGB stars and Worthey+Padova, can be used as a distance indicator for genuine dwarf elliptical galaxies with an estimated accuracy of %. Two points are essential for the SBF method to work successfully. Firstly, the stellar fluctuation magnitude has to be measured in a number of fields in a galaxy. Colour differences between fields and the resulting variation can be used to determine on which calibration branch a galaxy lies. Secondly, the application of the SBF method must focus on pure breed dwarf ellipticals. Intermediate type (dE/Irr) dwarfs show evidence of more recent star-formation activities and have more complex star formation histories than genuine dEs. This prevent a reliable interpretation of the fluctuation magnitudes as demonstrated in a previous study (Jerjen & Rejkuba 2000),
Taking advantage of the new calibration of the SBF method for dEs, we derived first distances for the three early-type dwarfs UGC 4998, DDO 113 and UGC 7356. UGC 4998 could be confirmed as a stellar system in the background of the M 81 group situated right at the periphery of the 10 Mpc sphere at 10.5 Mpc. DDO 113 and UGC 7356, are both known members of the spatially extended Canes Venatici I cloud based on their redshifts. We found them at 3.1 Mpc and 6.7 Mpc, respectively.
The example of UGC 4998 demonstrated the great potential of the SBF method to obtain accurate distances for dwarf elliptical galaxies as far away as 10 Mpc. The modest requirement of two hours of imaging under good seeing conditions at a 2.5m-class ground-based telescope opens up the possibility to measure distances to all known early-type dwarfs in the vicinity of the Local Group and to newly discovered dE candidates in an efficient and simple way.
Several steps could be undertaken to further improve the method. SBF data for more calibrator galaxies are needed to explore the empirical relation over a larger range in colour. Particularly useful will be galaxies that populate the linear branch of the relation. They can help to pin down the empirical zero point and slope of the second theoretical branch. In a next step, the diagram may be tested as a tool to estimate the spread in age and metallicity over a dwarf galaxy’s surface.
In the last part of our study, we presented surface brightness and colour profiles for the dwarfs. Radial colour gradients were found to be generally small and the galaxy light profiles follow the shape parameter – luminosity relation for dEs as previously observed in other dE samples (JFB00). Two GC candidates in DDO 71 and UGC 7356 have been discussed and photometric data provided.
Acknowledgements.
It is a pleasure to thank B. Binggeli and G. Da Costa for useful discussions. We are grateful to the referee Dr. R.I. Thompson whose comments helped to improve the paper. The Nordic Optical Telescope is operated on the island of La Palma jointly by Denmark, Finland, Iceland, Norway, and Sweden, in the Spanish Observatorio del Roque de los Muchachos of the Instituto de Astrofisica de Canarias.References
- (1) Armandroff, T.E., Jacoby, G.H., Davies, J.E., 1999, AJ, 118, 1220
- (2) Bertelli, G., Bessan, A., Chiosi, C., Fagotto, F., Nasi, E. 1994, A&AS, 106, 271
- (3) Binggeli, B 2001, in “Encyclopedia of Astronomy and Astrophysics”, Institute of Physics Publishing
- (4) Binggeli, B., Cameron L.M., 1991, A&A, 252, 27
- (5) Binggeli, B., Tarenghi, M., Sandage, A., 1990, A&A, 228, 42
- (6) Bremnes, T., Binggeli, B., Prugniel, P. 1998, A&AS, 129, 313
- (7) Bremnes, T., Binggeli, B., Prugniel, P. 2000, A&AS, 141, 211
- (8) Buta, R., McCall M.L. 1999, ApJS, 124, 33
- (9) Caldwell N., Armandroff T.E., Da Costa G.S., Seitzer P., 1998, AJ, 115, 535
- (10) Caldwell, N., Armandroff, T.E., Da Costa, G.S., Seitzer, P., 1998, AJ, 115, 535
- (11) Côté S., Freeman K.C., Carignan C., & Quinn P.J. 1997, AJ, 114, 1313
- (12) Cowie, L.L., Gardner, J.P., Hu, E.M. et al. 1994, ApJ, 434, 114
- (13) Da Costa, G.S. 1998, Stellar astrophysics for the local group: VIII Canary Islands Winter School of Astrophysics, eds. A. Aparicio, A. Herrero, and F. Sanchez. Cambridge; New York: Cambridge University Press, p. 351
- (14) Davies, J.I., Phillipps, S., 1988, MNRAS, 233, 553
- (15) de Jong, R.S. 1996, A&A, 313, 377
- (16) Falco, E.E., Kurtz, M.J., Geller, M.J. et al. 1999, PASP, 111, 438
- (17) Ferguson, H., Binggeli, B. 1994, A&AR, 6, 67
- (18) Harris, W.E. 1996, AJ, 112, 1487
- (19) Herrnstein, J. R., Moran, J.M., Greenhill, L.J. et al. 1999, Nature, 400, 539
- (20) Huchtmeier, W. K., Karachentsev, I. D., Karachentseva, V. E., Ehle, M. 2000, A&AS, 141, 469
- (21) Jensen, J.B., Tonry, J.L., Luppino, G.A. 1998, ApJ, 505, 111
- (22) Jerjen, H., Binggeli, B. 1997, in “The Nature of Elliptical Galaxies”, Proceedings of the Second Stromlo Symposium, eds. M. Arnaboldi et al., ASP Conference Series Vol. 116, p. 239
- (23) Jerjen H., Freeman K.C., Binggeli B. 1998, AJ, 116, 2873 (=JFB98)
- (24) Jerjen H., Binggeli B., Freeman K.C. 2000, AJ, 119, 593
- (25) Jerjen H., Freeman K.C., Binggeli B. 2000, AJ, 119, 166 (=JFB00)
- (26) Landolt A.U., 1992, AJ, 104, 340
- (27) Lee M.-G., Freedman L.W., Madore B.F., 1993, 417, 553
- (28) Maoz, E., Newman, J. A., Ferrarese, L., et al. 1999, Nature, 401, 351
- (29) Mateo, M., ARA&A, 36, 455
- (30) Karachentsev, I.D., Sharina, ME., Grebel, E.K., et al. 1999, A&A, 352, 399
- (31) Karachentsev, I.D., Karachentseva, V.E., Dolphin, A.E., Geisler, D., Grebel, E.K., et al. 2000, A&A, 363, 117
- (32) Karachentseva, V.E., Karachentsev I.D. 1998, A&AS, 127, 409
- (33) Saha, A., Hoessel, J.G., 1990, AJ, 99, 97
- (34) Sandage, A., Binggeli, B. 1984, AJ, 89, 919
- (35) Schlegel D., Finkbeiner D., Davis, M., 1998, ApJ, 500, 525
- (36) Sérsic, J.-L., 1968, Atlas de galaxias australes, (Cordoba: Observatorio Astronomico)
- (37) Stetson, P.B. 1987, PASP, 99, 191
- (38) Tonry, J.L., & Schneider, D.P. 1988, AJ, 96, 807
- (39) Tully, R.B., Fisher, J.R., 1987, Nearby Galaxies Atlas, Cambridge University Press, Cambridge
- (40) Worthey, G., 1994, ApJS, 95, 107