PROBING THE MASS DISTRIBUTION WITH IRAS GALAXIES
Abstract
We present the results of three independent analyses in which we show that IRAS galaxies faithfully trace the underlying distribution the mass in the local universe. In the first analysis we compare the mass and the galaxy density fields and show that they are consistent within 60 Mpc. In the second one we show that the tidal velocity field of the Mark III catalog is consistent with the tidal velocity field predicted from the distribution of IRAS galaxies, hence indicating that IRAS galaxies trace the mass distribution well beyond 60 Mpc. Finally, a third analysis aimed at determining the mean biasing relation of IRAS galaxies showed no appreciable deviations from the linear biasing prescription.
1 Dipartimento di Fisica, Universitá di Roma TRE, Via della Vasca Navale 84, 00146, Roma, Italy
1 Introduction
IRAS redshift surveys are characterized by their considerable depth and almost complete sky coverage and thus have been extensively used to investigate the mass distribution in the local universe. As a result, most of the local cosmological information is derived under the assumption that IRAS galaxies are faithful tracers of the underlying mass distribution. Therefore, it is of fundamental importance to test the validity this hypothesis and to quantify the so called biasing relation, i.e. the map between the mass and the galaxy spatial distributions both smoothed with the same filter and on the same smoothing scale.
This problem has been already addressed in several different ways by a number authors. Baker et al. (1998) and Seaborne et al. (1999) have shown that distribution of IRAS galaxies is consistent with that of optical galaxies on scales larger that 5 Mpc. This indicates that different types of objects trace a common underlying density field. More important, direct comparisons with the mass density field obtained from the observed peculiar velocities of galaxies using POTENT-like algorithms (Bertschinger & Dekel 1989) or Wiener Filtering techniques (Zaroubi et al. 1995), have shown that the distribution of IRAS galaxies is consistent with that of the mass within a region of Mpc (see Sigad et al. 1998 and reference therein).
Our aim is to improve the accuracy of the previous analyses, extend them to scales larger than 60 Mpc and determine whether the biasing of IRAS galaxies is consistent with a linear relation.
2 IRAS Galaxies vs. Mass within 60 Mpc

In the first analysis we perform a density-density comparison i.e. we reconstruct the mass density field within 60 Mpc from observed galaxy peculiar velocities and compare it with the 3D galaxy distribution obtained from the IRAS redshift surveys. In our analysis we use a new reconstruction method, called Unbiased Minimal Variance estimator [UMV, hereafter], a new catalog of peculiar velocity, called SEcat, and the most recent redshift survey of IRAS galaxies, called PSC.
The UMV estimator proposed by Zaroubi (2001) can be viewed as a compromise between POTENT algorithm and the Wiener filtering technique. It constitutes an improvement over both these methods since it provides an unbiased minimum variance reconstruction of the underlying density field from incomplete, noisy and sparse catalogs of galaxy peculiar velocities and also account for the correlation properties of the underlying velocity field. The recent SEcat catalog of peculiar velocities results from the merging of the SFI catalog of spiral galaxies (Giovanelli et al. 1997) and the ENEAR catalog of early type galaxies (da Costa et al. 2000). The large number of objects, homogeneous sky coverage and composite nature of the catalog guarantee dense, uniform and unbiased sampling of the cosmic velocity field. Finally, the PSC catalog (Saunders 1996) constitutes the largest and deepest all-sky redshift survey of IRAS galaxies to date.
The preliminary results of the comparison between the UMV-reconstructed mass and the IRAS PSC galaxy density fields are shown in Fig. 1. Each point displayed in the scatter-plot shows the comparison between the UMV and PSC overdensities smoothed with a Gaussian filter of radius 12 Mpc and measured at the same location. The correlation between the two fields is linear and thus consistent with a biasing relation on the scale of the smoothing. The slope of the solid line returns , where and indicate the mass density and linear bias parameters, respectively. The distribution of the density residuals is consistent with Gaussian, hence indicating that the PSC density field is an adequate model for the underlying mass density field within a radius of 60 Mpc under the assumption of linear biasing and on a scales larger than the smoothing length. It is worth stressing that, due to the regularization properties of the UMV estimator and the unprecedented quality of the SEcat and PSC datasets, the statistical significance of this density-density match is greater than in previous comparisons of this type.
The UMV estimator can be also used to reconstruct the underlying continuous velocity field. The comparison with the linear model velocity field predicted from the distribution of PSC galaxies returns a value of , consistent with the one obtained from densities (Zaroubi et al. in prep.).
3 IRAS Galaxies vs. Mass beyond 60 Mpc
To determine the mass distribution on scales larger than 60 Mpc and compare it to that of IRAS galaxies we have used the tidal field decomposition technique proposed by Hoffman et al. (2001).
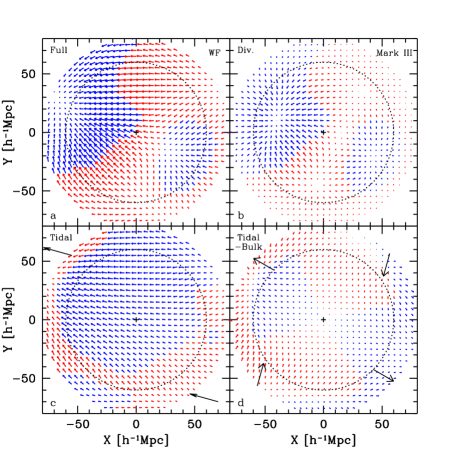
In this method the Wiener filtering technique is applied to the Mark III peculiar velocity catalog (Willick et al. 1997) to reconstruct the full density and velocity fields (top-left panel of Fig. 2). The density field within 60 Mpc is used to determine, via linear theory, the divergent part of the velocity field (top-right). The tidal velocity field (bottom-left) is obtained by subtracting the divergent component to the full velocity field. This tidal field is only determined by the mass distribution beyond 60 Mpc and is dominated by its dipole and quadrupole moments. The velocity field shown in the bottom-right panel was obtained after subtracting the dipole component from the tidal field and is clearly characterized by a quadrupole pattern. The direction of the Mark III dipole vector is displayed as long arrows in the bottom-left panel of Fig. 2. The long arrows in the bottom-right panel show the directions of the compressional and dilational eigenvectors of the shear tensor.
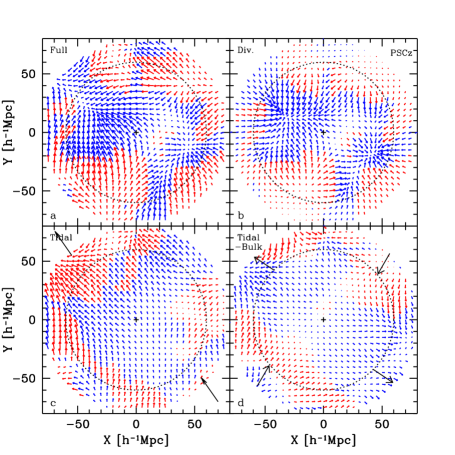
A similar decomposition was applied to the linear velocity field obtained from the distribution of IRAS PSC galaxies. The full velocity field and its divergent part are obtained, via linear theory, from the distribution of PSC galaxies within 200 Mpc and 60 Mpc, respectively (upper plots of Fig. 3). The PSC tidal velocity field, obtained from the galaxy distribution between 60 and 200 Mpc is shown in the two bottom panels with its dipole component (bottom-left) and without it (bottom-right). As in Fig. 2, the long arrows shown in Fig. 3 indicate the directions of dipole (bottom-left) and shear eigenvectors (bottom-right) of the PSC tidal velocity field.
The preliminary results of our quantitative analysis indicate that the dipole and quadrupole moments of the Mark III and PSC tidal velocity fields agree within the errors (Hoffman et al. in prep.). This match strongly suggests that the distribution of the mass beyond 60 Mpc is consistent with that traced by IRAS galaxies, at least in term of dipole and quadrupole moments.
4 The Mean Biasing Function of IRAS galaxies
Finally, we have used the method of Sigad, Branchini & Dekel (2000) to determine the mean biasing function of IRAS galaxies from their observed one point probability distribution function [PDF]. The method assumes that the bias is deterministic and monotonic and that the the mass PDF is lognormal on the scales of interest. To apply this technique we have extracted a volume limited subsample from the PSC galaxy survey and applied a spherical Top Hat filter of radius 8 Mpc to estimate the PDF of galaxies. Then the mean biasing function has been determined by mapping the galaxy PDF into that of the mass, modeled by a lognormal distribution. Extensive numerical tests have shown that the method is very effective to measure deviations from linear biasing. However, the slope of the mean biasing function is sensitive to the rms density fluctuations, , which fully characterizes a lognormal distribution and needs to be assumed a priori.

The preliminary results are shown in Fig. 4. The large dots show the PSC mean biasing function obtained assuming . The function is clearly consistent with a linear biasing scheme. The two solid lines indicate the uncertainty interval around the mean biasing, associated to the stochasticity of the biasing relation. as predicted by the Semianalytic Model [SAM] of Somerville et al. (2000). The dashed region is plotted for reference and shows the biasing function of IRAS galaxies determined by Feldman et al. (2001) that, however, refers to scales much larger than those of our analyses.
5 Conclusions
The preliminary results presented here corroborate the common assumption that IRAS galaxies are faithful tracers of the mass distribution. In the first analysis we have applied the new UMV estimator to show that the distribution of IRAS galaxies matches that of the mass within 60 Mpc. This confirms the results of similar comparisons previously performed using a number of different techniques and datasets. In the second analysis we take advantage of the nonlocal properties of the galaxy peculiar velocities to infer the mass distribution beyond 60 Mpc and found that is consistent with that of IRAS PSC galaxies. Finally, we use the inverse-mapping method of Sigad, Branchini & Dekel (2000) to quantify the biasing relation between galaxies and mass. Combined with the result of the likelihood analysis of Tegmark et al. (2000), our results show that on a scale of 8 Mpc IRAS PSC galaxies obey a mean linear biasing relation with a biasing parameter consistent with unity.
Acknowledgements. EB is grateful to Y. Hoffman and S. Zaroubi for kindly providing unpublished results and figures.
References
- [1] Baker, J., Davis, M., Strauss, M., Lahav, O., Santiago, B., 1998, ApJ, 508, 6
- [2] Bertshinger, E., Dekel, A., 1989, ApJ, 335, L5
- [3] da Costa et al., 2000, AJ, 120, 95
- [4] Feldman, H., Frieman, J., Fry, J., Scoccimarro, R., 2001, astro-ph/0010205
- [5] Giovanelli, R., et al., 1997, AJ, 113, 22
- [6] Hoffman, Y., Eldar, A., Zaroubi, S., Dekel A., 2001, (astro-ph/0102190)
- [7] Saunders, W., 1996, web site: http://www-astro.physics.ox.ac.uk/ wjs/pscz.html
- [8] Seaborne, M., et al., 1999, MNRAS, 309, 80
- [9] Sigad, Y., Dekel A., Strauss, M., Yahil, A., 1998, ApJ, 495, 516
- [10] Sigad, Y., Branchini, E., Dekel A., 2000, ApJ, 540, 62
- [11] Somerville, R., et al., 2000, MNRAS, 320, 289
- [12] Tegmark, M., Zaldarriaga, M., 2000, ApJ, 544, 30
- [13] Willick, J., et al., 1997, ApJS, 109, 333
- [14] Zaroubi, S., Hoffman, Y. Fisher, K., Lahav, O., 1995, ApJ, 449, 446
- [15] Zaroubi, S., 2001, (astro-ph/0010561)