The X-ray virial relations for relaxed lensing clusters observed with Chandra
Abstract
We examine the relations linking mass, X-ray temperature and bolometric luminosity for a sample of luminous, relatively relaxed clusters of galaxies observed with the Chandra Observatory, for which independent confirmation of the mass results is available from gravitational lensing studies. Within radii corresponding to a fixed overdensity with respect to the critical density at the redshifts of the clusters, the observed temperature profiles, scaled in units of and , exhibit an approximately universal form which rises within and then remains approximately constant out to . We obtain best-fit slopes for the mass-temperature and temperature-luminosity relations consistent with the predictions from simple scaling arguments i.e. and , respectively. We confirm the presence of a systematic offset of per cent between the normalizations of the observed and predicted mass-temperature relations for both SCDM and CDM cosmologies.
keywords:
X-rays: galaxies: clusters – galaxies: clusters: general – gravitational lensing – cosmological parameters1 Introduction
The spatial distribution, mass function and redshift evolution of clusters of galaxies are sensitive functions of cosmology. The space density of clusters predicted by analytical models (e.g. Press & Schechter 1974; Lacey & Cole 1993; Sheth, Mo & Tormen 2001) and numerical simulations (e.g. Navarro, Frenk & White 1995; Eke, Cole & Frenk 1996; Jenkins et al. 2000; Bode et al. 2001) can be related to (more easily) observable properties such as the X-ray temperatures and luminosities of clusters via simple scaling relations. Assuming that the X-ray gas in clusters is virialized and in hydrostatic equilibrium, the mass, , within radius (inside which the mean mass density is times the critical density, , at that epoch) is related to the mean mass-weighted temperature within that radius, , by . Here, , where is the redshift-dependent Hubble Constant (e.g. Bryan & Norman 1998). Since the X-rays from rich clusters are primarily bremsstrahlung emission, one can also show that , where is the bolometric luminosity from within radius . The validity of these simple scaling relations is supported by numerical simulations (e.g. Evrard, Metzler & Navarro 1996; Bryan & Norman 1998; Thomas et al. 2001; Mathiesen & Evrard 2001), although the normalization of the mass-temperature relation exhibits some variation from study to study (the normalization of Bryan & Norman 1998 is 17 per cent higher than that of Evrard, Metzler & Navarro 1996 for ; see also Table 1 of Afshordi & Cen 2001). The normalization of the luminosity-temperature relation is more difficult to predict due to the potentially complex physics of the X-ray gas in the innermost regions of clusters from where the bulk of the X-ray luminosity arises.
Recent observational determinations of the mass-temperature relation, based on ASCA and ROSAT data for relatively hot ( keV) clusters (e.g. Horner, Mushotzky & Scharf 1999; Nevalainen, Markevitch & Forman 2000; Finoguenov, Reiprich & Böhringer 2001) have recovered a slope consistent with the simple scaling-law predictions, although the observed normalizations are typically per cent lower than predicted by the simulations of Evrard, Metzler & Navarro (1996) for a standard cold dark matter (SCDM) cosmology. For clusters at lower temperatures, some steepening of the mass-temperature relation is inferred (Nevalainen et al. 2000, Finoguenov et al. 2001). Studies of the luminosity-temperature relation (e.g. White, Jones & Forman 1997; Allen & Fabian 1998; Markevitch 1998; Arnaud & Evrard 1999) have generally measured , whereas theory predicts . This has been taken as evidence for significant pre-heating and/or cooling in cluster cores (e.g. Kaiser 1991; Evrard & Henry 1991; Cavaliere, Menci & Tozzi 1997; Pearce et al. 2000; Bialek, Evrard & Mohr 2001). Allen & Fabian (1998) have shown that for hot ( keV), relaxed clusters is recovered once the effects of cool, central components are accounted for in the spectral X-ray analysis, suggesting (in agreement with the later mass-temperature results) that pre-heating may only significantly affect the properties of cooler, less-luminous clusters.
A major goal of studies with the new generation of X-ray missions including the Chandra Observatory and XMM-Newton, which permit the first direct spatially-resolved X-ray spectroscopy of hot, distant clusters, is the verification and accurate calibration of the virial relations for galaxy clusters. In particular, detailed studies of systems for which precise mass measurements have been made using other, independent methods are required. An early attempt at combining X-ray and gravitational lensing data for clusters observed with the ASCA satellite to study the mass-temperature relation was presented by Hjorth, Oukbir & van Kampen (1998). In this letter we use new Chandra observations to determine the X-ray virial relations for a sample of luminous, relatively relaxed clusters spanning the redshift range , for which lensing mass measurements are available and have been shown to be in good agreement with the Chandra results (Section 2; see e.g. Allen 1998, Böhringer et al. 1998 for earlier results). We present gas mass-weighted temperatures, bolometric luminosities and total mass measurements within radii corresponding to a fixed overdensity at the redshifts of the clusters, and compare the observed scaling relations between these quantities with those predicted by simulations. Results are given for two cosmologies: SCDM with , and , and CDM with , and .
2 Observations and data analysis
| z | Date | Net Exposure | |
|---|---|---|---|
| PKS0745-191 | 0.103 | 2001 Jun 16 | 17.9 |
| Abell 2390 | 0.230 | 1999 Nov 7 | 9.1 |
| Abell 1835 | 0.252 | 1999 Dec 12 | 19.6 |
| MS2137-2353 | 0.313 | 1999 Nov 18 | 20.6 |
| RXJ1347-1145(1) | 0.451 | 2000 Mar 05 | 8.9 |
| RXJ1347-1145(2) | 0.451 | 2000 Apr 29 | 10.0 |
| 3C295 | 0.461 | 1999 Aug 30 | 17.0 |
The Chandra observations were carried out using the back-illuminated S3 detector on the Advanced CCD Imaging Spectrometer (ACIS) between 1999 August 30 and 2001 June 16. For our analysis we have used the the level-2 event lists provided by the standard Chandra pipeline processing. These lists were cleaned for periods of background flaring using the CIAO software package resulting in the net exposure times summarized in Table 1.
The Chandra data have been analysed using the methods described by Allen et al. (2001b,c) and Schmidt, Allen & Fabian (2001). In brief, concentric annular spectra were extracted from the cleaned event lists, centred on the peaks of the X-ray emission from the clusters.111For RXJ1347-1145, the data from the southeast quadrant of the cluster were excluded due to ongoing merger activity in that region; Allen et al. (2001c). The spectra were analysed using XSPEC (version 11.0: Arnaud 1996), the MEKAL plasma emission code (Kaastra & Mewe 1993; incorporating the Fe-L calculations of Liedhal, Osterheld & Goldstein 1995), and the photoelectric absorption models of Balucinska-Church & McCammon (1992). Two separate models were applied to the data, the first of which was fitted to each annular spectrum individually in order to measure the projected temperature profiles. The second model was applied to all annuli simultaneously, in order to determine the deprojected temperature profiles under the assumption of spherical symmetry. Only data in the keV range were used.
| SCDM | CDM | |||||||
|---|---|---|---|---|---|---|---|---|
| c | c | |||||||
| PKS0745-191 | ||||||||
| Abell 2390 | ||||||||
| Abell 1835 | ||||||||
| MS2137-2353 | ||||||||
| RXJ1347-1145 | ||||||||
| 3C295 | ||||||||
For the mass modelling, azimuthally-averaged surface brightness profiles were constructed from background subtracted, flat-fielded images with a arcsec2 pixel scale ( raw detector pixels). When combined with the deprojected spectral temperature profiles, the surface brightness profiles can be used to determine the X-ray gas mass and total mass profiles in the clusters. For this analysis we have used an enhanced version of the image deprojection code described by White, Jones & Forman (1997)222The observed surface brightness profile and a particular parameterized mass model are together used to predict the temperature profile of the X-ray gas. (We use the median temperature profile determined from 100 Monte-Carlo simulations. The outermost pressure is fixed using an iterative technique which ensures a smooth pressure gradient in these regions.) The predicted temperature profile is rebinned to the same binning as the projected/deprojected spectra and compared with the observed spectral deprojection results. The difference between the observed and predicted temperature profiles is then calculated. The parameters for the mass model are stepped through a regular grid of values in the - plane to determine the best-fit values and 68 per cent confidence limits. Spherical symmetry and hydrostatic equilibrium are assumed throughout. with distances calculated using the code of Kayser, Helbig & Schramm (1997). We have parameterized the mass profiles using a Navarro, Frenk & White (1997; hereafter NFW) model with , where is the mass density, is the critical density for closure at redshift , and . The normalizations of the mass profiles may also be expressed in terms of an equivalent velocity dispersion, (with in units of Mpc). The best-fit NFW model parameter values and 68 per cent confidence limits are summarized in Table 2.
In determining the results on the virial properties, we adopt , since is well-matched to the outermost radii at which reliable temperature measurements can be made from the Chandra S3 data. (The values for the NFW models are determined numerically, with confidence limits calculated using the grids. Note that varies from for the clusters in the present sample). We define , the mean gas mass-weighted temperature within , as where and are the gas mass and temperature (in keV) in each radial shell for which an independent spectral determination of the temperature is made. The outer radius of shell is set to be equal to . Similarly, we define , where is the bolometric luminosity in each radial shell. The best-fit values and 68 per cent confidence limits for , and are summarized in Table 3.
| SCDM | CDM | |||||||||||
|---|---|---|---|---|---|---|---|---|---|---|---|---|
| PKS0745-191 | 1.158 | 1.050 | ||||||||||
| Abell 2390 | 1.364 | 1.122 | ||||||||||
| Abell 1835 | 1.401 | 1.135 | ||||||||||
| MS2137-2353 | 1.505 | 1.174 | ||||||||||
| RXJ1347-1145 | 1.748 | 1.271 | ||||||||||
| 3C295 | 1.765 | 1.279 | ||||||||||
We note that the data for PKS0745-191 do not quite reach to and for this cluster we have extrapolated using a power-law fit to the luminosity data in the range . (We assume that the temperature remains constant beyond .) The lensing and X-ray mass results for the clusters in our sample are discussed in detail by Allen et al. (2001b; Abell 2390), Schmidt et al. (2001; Abell 1835), Allen et al. (2001c; RXJ1347-1145) and Allen et al. , in preparation (PKS0745-191; MS2137-2353; see also Wise et al. in preparation). Although independent confirmation of the X-ray mass results for 3C295 (Allen et al. 2001a) is not available, we include this cluster in the analysis of the temperature-luminosity relation since in other ways it appears similar to the other objects in the sample.
3 Results
3.1 A universal temperature profile for relaxed clusters.
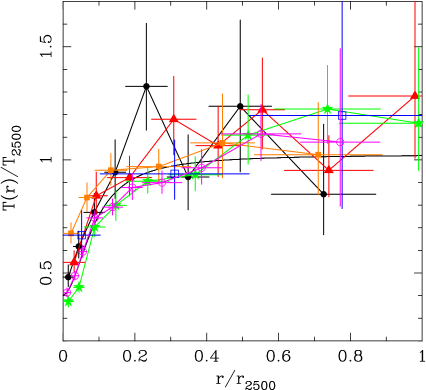
Fig. 1 shows the observed (projected), spectrally-determined temperature profiles in the clusters, in units of the mean gas mass-weighted temperature, and with the radial axis scaled in units of . The CDM cosmology is assumed. The clusters exhibit similar scaled-temperature profiles which rise within and then remain approximately isothermal out to . The combined data set can be modelled using a simple function of the form where , , , and .
3.2 The mass-temperature relation


Fig. 2 shows the relations for the SCDM and CDM cosmologies. Fitting only the data for those clusters for which independent confirmation of the X-ray mass results is available from lensing studies (i.e. excluding 3C295 from the present sample) using a power-law model of the form
| (1) |
and a estimator, we obtain , for SCDM () and , for CDM (). Fixing the slope at , we measure normalizations of (SCDM) and (CDM). Uncertainties are quoted at the 68 per cent confidence level.
Using the modified least-squares estimator of Fasano & Vio (1988), which accounts for errors in both axes, we obtain values , for SCDM and , for the CDM cosmology. We conclude that the measured slope is consistent with the expected value of in all cases.
The dotted curves in Figs. 2a,b show the predicted (zero-redshift) relations for the SCDM [] and CDM [] cosmologies from the hydrodynamical simulations of Evrard et al. (1996) and Mathiesen & Evrard (2001), respectively. We have scaled the predicted curves from to assuming , which is consistent with the range of best-fit NFW mass models, and the SCDM simulations of Evrard et al. (1996; see their Table 5). Note that allowing for the presence of temperature gradients () in the simulated clusters when applying this scaling does not affect the best-fit parameters for the theoretical curves, since the curves are simply mapped onto themselves. For both SCDM and CDM, the predicted normalization lies approximately 40 per cent above the observed value.
3.3 The temperature-luminosity relation
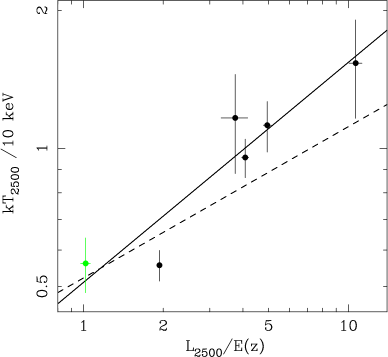
Fig. 3 shows the relation for the CDM cosmology. Fitting the data for all six clusters using a power-law model of the form
| (2) |
and a estimator, we obtain , for SCDM, and , for CDM. Using the BCES() estimator of Akritas & Bershady (1996), which accounts for errors in both axes and the presence of possible intrinsic scatter, we obtain , for SCDM and , for CDM.
We conclude that the slope of the temperature-luminosity relation for the present sample of hot, relaxed clusters is consistent with the predicted value of (Section 1). Fixing results in a poor fit: for 5 degrees of freedom, as opposed to with (CDM).
4 Discussion
We have shown that within radii , corresponding to a fixed density contrast with respect to the critical density at the redshifts of the clusters, the temperature profiles for the present sample of luminous, relatively relaxed lensing clusters exhibit an approximately universal form which rises within and then remains approximately constant out to . The enclosed masses, bolometric luminosities and mean gas mass-weighted temperatures within these radii scale in manner consistent with the predictions from the simple virial relations outlined in Section 1. We have confirmed the presence of a systematic offset of per cent between the normalizations of the observed and predicted curves, in the sense that the predicted temperatures are too low for a given mass, for both the SCDM and CDM cosmologies.
An important aspect of the present study is that independent confirmation of the X-ray mass measurements is available from gravitational lensing studies. For both Abell 2390 and RXJ1347-1145, the X-ray and weak lensing mass profiles are consistent within their 68 per cent confidence limits. For Abell 1835, 2390, MS2137-2353 and PKS0745-191, the observed strong lensing configurations (on scales kpc) can be explained by mass models within the 68 per cent Chandra confidence contours, although redshift measurements for the arcs (which are required to define the lensing masses precisely) are not available in all cases.333For RXJ1347-1145, a two-component mass model, consistent with the complex X-ray structure observed in the southeast quadrant, is required to explain the strong lensing data. Thus, the presence of significant non-thermal pressure support (e.g. arising from turbulent and/or bulk motions and/or magnetic fields) can be excluded. We conclude that the systematic uncertainties associated with the individual mass measurements are small ( per cent).
The offset between the observed and simulated mass-temperature curves cannot be explained by invoking an earlier formation redshift for the observed clusters (we assume that the clusters form at the redshifts they are observed) since, for the measured NFW mass distributions, drops as fast or faster than rises as the formation redshift is increased. Our results suggest that on the spatial scales studied here, important physics may be missing from the reference simulations. One possible candidate is radiative cooling of the X-ray gas, which the Chandra data show to be significant within (e.g. Allen et al. 2001a,b,c; David et al. 2001; Schmidt et al. 2001). Pearce et al. (2000) show that the introduction of radiative cooling into their hydrodynamical simulations can lead to central temperature drops similar to those in Fig. 1. These authors also argue that cooling can lead to a significant increase in the mass-weighted temperature within (as cooled, low-entropy gas is deposited and warmer, high-entropy material flows inwards and is compressed), which may be sufficient to account for the discrepancy between the observed and simulated curves. Detailed simulations of the relation for large a sample of massive clusters, including the effects of radiative cooling, are required to address this issue.
The results presented in this paper should provide a useful calibrator for future studies of the X-ray properties of galaxy clusters. In future work we will examine the constraints that the present data place on radial variations in the X-ray gas mass fraction in the clusters and, therefore, . We will also explore the ability of different parameterized mass models to explain the observed X-ray gas temperature and density profiles.
SWA and ACF acknowledge the support of the Royal Society.
References
- [1] Afshordi N., Cen R., 2001, preprint (astro-ph/0105020)
- [2] Akritas M.G., Bershady M.A., 1996, ApJ, 470, 706
- [3] Allen S.W., 1998, MNRAS, 296, 392
- [4] Allen S.W., Fabian A.C., 1998, MNRAS, 297, L57
- [5] Allen S.W. et al. 2001a, MNRAS, 324, 842
- [6] Allen S.W., Ettori S., Fabian A.C., 2001b, MNRAS, 324, 877
- [7] Allen S.W., Schmidt R.W., Fabian A.C., 2001c, MNRAS, submitted
- [8] Anders E., Grevesse N., 1989, Geochemica et Cosmochimica Acta 53, 197
- [9] Arnaud, K.A., 1996, in Astronomical Data Analysis Software and Systems V, eds. Jacoby G. and Barnes J., ASP Conf. Series volume 101, p17
- [10] Arnaud M., A.E. Evrard, 1999, MNRAS, 305, 631
- [11] Balucinska-Church M., McCammon D., 1992, ApJ, 400, 699
- [12] Bialek J.J., Evrard A.E., Mohr J.J., 2001, ApJ, 555, 597
- [13] Bode P., Bahcall N.A., Ford E.B., Ostriker J.P., 2001, ApJ, 551, 2001
- [14] Böhringer H., Tanaka Y., Mushotzky R.F., Ikebe Y., Hattori M., 1998, A&A, 334, 789
- [15] Bryan G.L., Norman M.L., 1998, ApJ, 495, 80
- [16] Cavaliere A., Menci N., Tozzi P., 1997, ApJ, 484, L21
- [17] David L.P., Nulsen P.E.J., McNamara B.R., Forman W., Jones C., Ponman T., Robertson B., Wise M., 2001, ApJ, 557, 546
- [18] Dickey J.M., Lockman F.J., 1990, ARA&A, 28, 215
- [19] Eke V.R., Cole S., Frenk C.S., 1996, MNRAS, 282, 263
- [20] Evrard A.E., Henry J.P., 1991, ApJ, 383, 95
- [21] Evrard A.E., Metzler C.A., Navarro J.F., 1996, ApJ, 469, 494
- [22] Fasano G., Vio R., 1988, Bull. Inf. Cnt. Données Stellaires, 35, 191
- [23] Finoguenov A., Reiprich T.H., Böhringer H., 2001, A&A, 368, 749
- [24] Hjorth J., Oukbir J, van Kampen E., 1998, MNRAS, 298, 1
- [25] Horner D.J., Mushotzky R.F., Scharf C.A., 1999, ApJ, 520, 78
- [26] Jenkins A., Frenk C.S., White S.D.M., Colberg J.M., Cole S., Evrard A.E., Yoshida N., MNRAS, 2001, MNRAS, 321, 372
- [27] Kaastra J.S., Mewe R., 1993, Legacy, 3, HEASARC, NASA
- [28] Kaiser N., 1991, ApJ, 383, 104
- [29] Kayser R., Helbig P., Schramm T., 1997, A&A, 318, 680
- [30] Lacey C., Cole S., 1993, MNRAS, 262, 627
- [31] Liedhal D.A., Osterheld A.L., Goldstein W.H., 1995, ApJ, 438, L115
- [32] Markevitch M., 1998, ApJ, 504, 27
- [33] Mathiesen B.F., Evrard A.E., 2001, ApJ, 546, 100
- [34] Navarro J.F., Frenk C.S., White S.D.M., 1995, ApJ, 275, 720
- [35] Navarro J.F., Frenk C.S., White S.D.M., 1997, ApJ, 490, 493
- [36] Nevalainen J., Markevitch M., Forman W., 2000, ApJ, 536, 73
- [37] Pearce F.R., Thomas P.A., Couchman H.M.P., Edge A.C., 2000, MNRAS, 317, 1029
- [38] Press W.H., Schechter P., 1974, ApJ, 187, 425
- [39] Schmidt R.W., Allen S.W., Fabian A.C., 2001, MNRAS, in press (astro-ph/0107311)
- [40] Sheth R.K., Mo H.J., Tormen G., 2001, MNRAS, 323, 1
- [41] Thomas P.A., Muanwong O., Pearce F.R., Couchman H.M.P., Edge A.C., Jenkins A., Onuora L., 2001, MNRAS, 324, 450
- [42] White D.A., Jones C., Forman W., 1997, MNRAS, 292, 419