Chemical composition of red horizontal branch stars in the thick disk of the Galaxy††thanks: Based on observations obtained at the Nordic Optical Telescope, La Palma,††thanks: Table 1 is only available in electronic at the CDS via anonymous ftp to cdsarc.u-strasbg.fr (130.79.128.5) or via http://cdsweb.u-strasbg.fr/Abstract.html
High-resolution spectra of 13 core helium-burning stars in the thick disk of the Galaxy have been obtained with the SOFIN spectrograph on the Nordic Optical Telescope to investigate abundances of up to 22 chemical elements. Abundances of carbon were studied using the C2 Swan (0,1) band head at 5635.5 Å. The wavelength interval 7980–8130 Å with strong CN features was analysed in order to determine nitrogen abundances and isotope ratios. The oxygen abundances were determined from the [O i] line at 6300 Å. Abundances in the investigated stars suggest that carbon is depleted by about 0.3 dex, nitrogen is enhanced by more than 0.4 dex and oxygen is unaltered. The ratios are lowered and lie between values 3 and 7 which is in agreement with “cool bottom processing” predictions (Boothroyd & Sackmann 1999). The C/N ratios in the investigated stars are lowered to values between 0.7 and 1.2 which is less than present day theoretical predictions and call for further studies of stellar mixing processes. Abundance ratios of O, Mg, Eu and other heavy chemical elements to iron in the investigated stars show a pattern characteristic of thick disk stars. The results provide evidence that the thick disk population has a distinct chemical history from the thin disk. The onset of the bulk of SN Ia is suggested to appear at [Fe/H] dex.
Key Words.:
stars: abundances – stars: atmospheres – stars: horizontal-branch – Galaxy: formation1 Introduction
“Upgren’s Unclassified Stars: A New Type of G-Giant Stars ?”– was the title of a paper by Sturch & Helfer (1971) in which photometry was presented for 17 stars for which Upgren (1962) could not obtain luminosities. Upgren (1962) had conducted objective-prism observations with dispersion of 580 Å/mm-1 for late-type stars near the north galactic pole. For the G stars, luminosity criteria were the two CN bands at Å and Å. It appeared that for some G stars, luminosity determination from these features was inaccurate. Sturch & Helfer, however, also met with difficulties: the position of stars observed in the diagram matched neither the Hyades nor nearby field dwarfs, nor field giants with pc, nor M or the giant branches of a variety of globular clusters. The authors concluded that these unclassified stars probably belong to the field equivalents of the red horizontal branch (RHB) stars of metal-rich globular clusters. This paper marked the beginning of a serious effort to study red horizontal branch stars in the Galactic field (see Tautvaišienė 1996a for a review).
64 G stars from Upgren’s list were investigated by Rose (1985) using a quantitative three-dimensional spectral classification system employing 2.5 Å resolution spectra in the blue. A number of Upgren’s unclassified stars were found to be dwarfs. Quite a large group of Upgren’s G stars were, however, shown to be evolved, based on the strength of their Sr ii Å line. They were also distinguished from post-main-sequence stars evolving through the same region of the HR diagram because of the unique appearance of their CN and 4216 Å bands. It was concluded that a class of red horizontal-branch stars, similar to those in the “metal-rich” globular cluster M 71, has been identified in the Galactic disk. Moreover, it was noticed that these stars have metallicities and kinematics which are common for the ‘thick disk’ of the Galaxy revealed by Gilmore & Reid (1983). Detailed measurements of kinematic parameters of the stars by Stetson & Aikman (1987) have confirmed that they belong to the thick disk of the Galaxy.
Norris (1987) reported DDO observations for ten of Upgren’s red giants which Rose (1985) identified as RHB stars and presented arguments that these stars could equally well be the core-helium-burning ‘clump’ stars similar to those seen in the old, metal deficient open cluster NGC 2243. Consequently they could be as young as about Gyr rather than about 14 Gyr as would follow from their identity to the population of metal-rich galactic disc globular clusters.
Photometric observations and three-dimensional classification in the Vilnius photometric system were carried out for 13 of the Roses’s RHB stars by Tautvaišienė (1996b). The results were photometric spectral types, metallicities, effective temperatures, surface gravities, absolute magnitudes and ages. The stars form a group with mean [Fe/H] which is between as evaluated by Rose (1985) and as determined by Norris (1987) from the cyanogen excess parameter . An age of about 10–12 Gyr was ascribed to the group from comparison with model isochrones. This age is intermediate between the ages of the disk globular clusters and the oldest open clusters.
The aim of the present study is to perform a high resolution spectroscopic analysis of 13 red horizontal branch stars which were identified in Upgren’s list by Rose (1985). We expect that C/N and 12C/13C abundance ratios, and possibly also the abundances of sodium, aluminium and -process elements, will provide information on the extent of mixing processes in these evolved stars. Abundances of other chemical elements will be useful for the interpretation of the chemical evolution of the thick disk of the Galaxy.
2 Observations and data reductions
The spectra were obtained at the Nordic Optical Telescope (NOT) with the SOFIN échelle spectrograph (Tuominen 1992) in 1997. The 2nd optical camera () and the 3rd optical camera () were used. The spectra were recorded with the Astromed-3200 CCD camera (Mackay 1986) equipped with an EEV P88100 UV-coated CCD of pixels operated at the working temperature of 150 K. With the 2nd camera we observed simultaneously 13 spectral orders, each of 40–60 Å in length, located from 5650 Å to 8130 Å and with the 3rd camera we observed 25 spectral orders, each of 80–150 Å in length, located from 4500 Å to 8750 Å. All spectra were exposed to S/N.
Reductions of the CCD images were made with the 3A software package (Ilyin 1996, 2000). Procedures of bias subtraction, spike elimination, flat field correction, scattered light subtraction, extraction of spectral orders were used for image processing. A Th-Ar comparison spectrum was used for the wavelength calibration. The continuum was defined by a number of narrow spectral regions, selected to be free of lines in the solar spectrum.
The lines suitable for measurement were chosen using the requirement that the profiles be sufficiently clean to provide reliable equivalent widths. Inspection of the solar spectrum (Kurucz et al. 1984) and the solar line identifications of Moore et al. (1966) were used to avoid blends. Lines blended by telluric absorption lines were omitted from treatment as well. The equivalent widths of lines were measured by fitting of a Gaussian function. The line measurements are listed in Table 1 (available in electronic form at CDS).
3 Method of analysis
The spectra were analysed using a differential model atmosphere technique. The method of analysis and atomic line parameters are the same as used recently by Tautvaišienė et al. (2000, Paper I), where the chemical composition of evolved stars in the open cluster M 67 was investigated. The Eqwidth and Spectrum programme packages, developed at Uppsala Astronomical Observatory, were used to carry out the calculations of abundances from measured equivalent widths and synthetic spectra, respectively. A set of plane parallel, line-blanketed, flux constant LTE model atmospheres with solar abundance ratios was computed by M. Asplund (Uppsala Astronomical Observatory) with the updated version of the MARCS code (Gustafsson et al. 1975) using continuous opacities from Asplund et al. (1997) and including UV line blanketing as described by Edvardsson et al. (1993). The solar model atmosphere for the differential analysis was also calculated in Uppsala (Edvardsson et al. 1993).
The effective temperatures for the programme stars were initially taken from Tautvaišienė (1996b), where they were derived using the intrinsic colour index of the Vilnius photometric system. For the star BD +28°2079 the was taken from Bartkevičius & Lazauskaitė (1997) and the same procedure applied. In the work by Tautvaišienė (1996b) as well as in the work by Norris (1987) the interstellar reddening for these stars was accepted to be zero. Although these stars are located in the direction of the North Galactic Pole, where the reddening should be small, Bartkevičius & Lazauskaitė (1997) have found that some of the stars are affected. We decided to introduce a spectroscopic method to solve the problem. We corrected, when needed, the effective temperatures by achieving the LTE exitation balance in the iron abundance results. For nine stars the effective temperatures were adjusted by – K.
The surface gravities were found by forcing Fe i and Fe ii to yield the same iron abundances, 47 Fe i and 5 Fe ii lines were used. The microturbulent velocities were determined by forcing Fe i line abundances to be independent of the equivalent width. The derived atmospheric parameters are listed in Table 2.
Abundances of carbon and nitrogen were determined using the spectrum synthesis technique. The interval of 5632–5636 Å was synthesized and compared with observations in the vicinity of the Swan 0–1 band head at 5635.5 Å. The 5635.5 Å band head is strong enough in our spectra and is quite sensitive to changes of the carbon abundance (see Fig. 1 for illustration). The same atomic data of as used by Gonzalez et al. (1998) and in Paper I were adopted for the analysis.

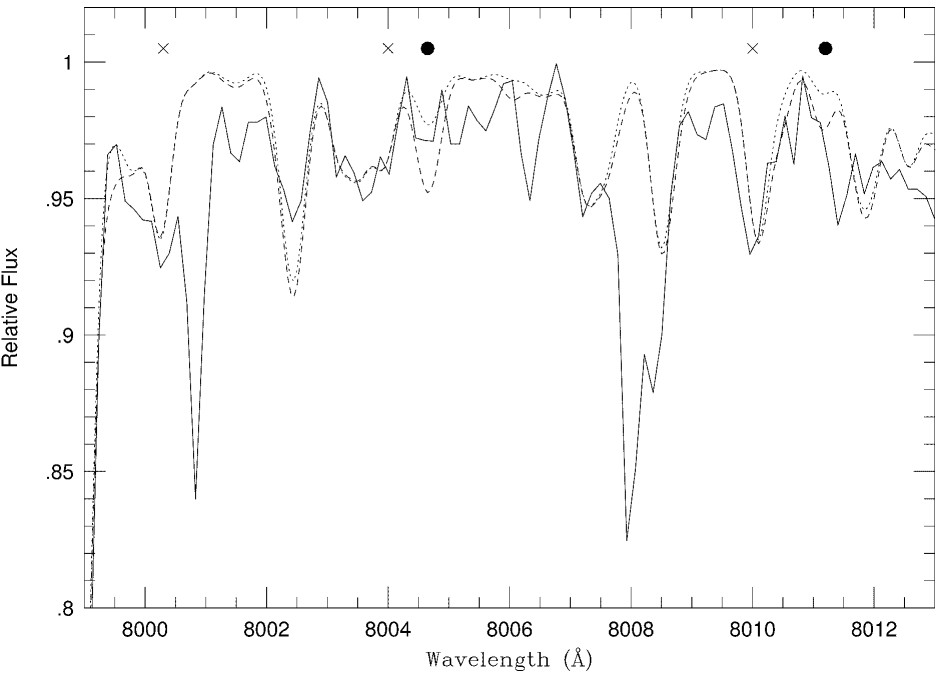
The intervals of 7980–8130 Å with and 8380–8430 Å with , containing strong CN features, were analysed in order to determine the nitrogen abundance. The 12C/13C determination was based on the 8004.728 Å 13CN feature. 11 other weaker 13CN features ( 7989.45, 8010.4, 8011.2, 8016.35, 8022.65, 8036.15, 8043.2, 8048.3, 8051.8, 8056.4, 8058.2 and 8065.0 Å) were used for error estimation. The molecular data for 12C14N and 13C14N were taken from ab initio calculations of CN isotopic line strengths, energy levels and wavelengths by Plez (1999), with all values increased by dex in order to fit our model spectrum to the solar atlas of Kurucz et al. (1984). The 13CN line wavelengths were, however, adopted from laboratory measurements by Wyller (1966). Parameters of atomic lines in the spectral synthesis intervals were adopted from the VALD database (Piskunov et al. 1995). In order to check the correctness of the input data, synthetic spectra of the Sun were compared to the solar atlas of Kurucz et al. (1984) and necessary adjustments were made to the line data.
Fig. 2 illustrates the enhancement of the 13CN line at 8004.7 Å in a spectrum of the star BD +27°2057.
Abundances of oxygen were determined using equivalent widths of the [O i] forbidden line at 6300 Å, widely used in analyses of other late-type stars. This line was recently reexamined in the solar spectrum with a three-dimensional time-dependent hydrodynamical model solar atmosphere and implications of the Ni i blend on oxygen abundances discussed (Prieto et al. 2001). Our test calculations showed that in our sample of stars the influence of the Ni line is very small (oxygen abundance changes do not exceed 0.01–0.03 dex).
The interval of 6643–6648 Å, containing the Eu ii line at 6645 Å, was computed in order to determine the europium abundance (see Fig. 3 for illustration). The oscillator strength of the Eu ii line, , was adopted from Gurtovenko & Kostik (1989). The solar abundance of europium, later used for the differential analysis, , was determined by fitting of the Kurucz et al. (1984) solar flux spectrum. Parameters of other lines in the interval were compiled from the VALD database. CN lines were also included, but none of them seems to affect the europium line significantly.

|
Typical internal error estimates for the atmospheric parameters are: K for , dex for and for . The sensitivity of the abundance estimates to changes in the atmospheric parameters by the assumed errors is illustrated for the star BD +25°2436 (Table 3). It is seen that our estimated parameter uncertainties do not affect the abundances seriously; the element-to-iron ratios, which we use in our discussion, are even less sensitive. The small differences between the chemical composition of the models and the final abundance results have a neglible effect on the results. The ratios are not sensitive to the model parameters or errors in the values since they are determined after fitting the features.
The scatter of the deduced line abundances , presented in Table 4, gives an estimate of the uncertainty coming from the random errors in the line parameters (e.g. random errors in equivalent widths, oscillator strengths and possible undetected line blends). The approximate value of these uncertainties amounts in the mean to = dex. Other sources of observational errors, such as continuum placement or background subtraction problems are partly included in the equivalent width uncertainties. The nitrogen abundance is less dependent on line measurement uncertainties because, depending on the number of spectra observed, the number of CN lines used for the analysis was ranging from 34 to 162.
Since the abundances of C, N and O are tied together by the molecular equilibria in the stellar atmospheres and the abundances were determined in the sequence O (from [O i]) C (from C2) N (from CN), we have investigated how an error in one of them would typically affect our abundance determinations of the others. Calculations for BD +25°2436: a change of the oxygen abundance of would result in , and thus ; a change in would cause , and ; has no appreciable effect on either the oxygen or the carbon molecular equilibria (except for CN). Note in particular that the C/N ratios are sensitive to the carbon abundance uncertainties squared.
|
4 Relative abundances
The abundances relative to hydrogen [A/H]111In this paper we use the customary spectroscopic notation [X/Y] and (the line-to-line scatter) derived for up to 26 neutral and ionized species for the programme stars are listed in Table 4. The abundances of barium are corrected for non-LTE effects by the subtraction of 0.20 dex (see Subsec. 4.5 for discussion).
|
||||||||||||||||||||||||||||||||||||||||||||||||||||||||||||||||||||||||||||||||||||||||||||||||||||||||||||||||||||||||||||||||||||||||||||||||||||||||||||||||||||||||||||||||||||||||||||||||||||||||||||||||||||||||||||||||||||||||||||||||||||||||||||||||||||||||||||||||||||||||||||||||||||||||||||||||||||||||||||||||||||||||||||||||||||||||||||||||||||||||||||||||||||||||||||||||||||||||||||||||||||||||||||||||||||||||||||||||||||||||||||||||||||||||||||||||||||||||||||||||||
4.1 Carbon and nitrogen
|
||||||||||||||||||||||||||||||||||||||||||||||||||||||||||||||||||||||||||||||||||||||||||||||||||||||||||||||||||||||||||||||||||||||||||||||||||||||||||||||||||||||||||||||||||||||||||||||||||||||||||||||||||||||||||||||||||||||||||||||||||||||||||||||||||||||||||||||||||||||||||||||||||||||||||||||||||||||||||||||||||||||||||||||||||||||||||||||||||||||||||||||||||||||||||||||||||||||||||||||||||||||||||||||||||||||||||||||||||||||||||||||||||||||||||||||||||||||||||||||||||
The carbon abundances obtained in our work were compared with carbon abundances determined for dwarf stars in the galactic disk. Gustafsson et al. (1999), using the forbidden [C i] line, performed an abundance analysis of carbon in a sample of 80 late F and early G type dwarfs. Since carbon abundances obtained using the [C i] 8727 Å line and molecular lines are usually consistent (c.f. Clegg et al. 1981), we expect no systematic shift to be present because of the different abundance indicators used. As is seen from Fig. 4, the ratios of [C/Fe] in our stars lie much below the trend obtained for dwarf stars in the Galactic disk (Gustafsson et al. 1999).
Abundances in the investigated stars suggest that carbon is depleted by about 0.3 dex and nitrogen is enhanced by more than 0.4 dex. These abundance alterations of carbon and nitrogen are larger than those we obtained for the clump stars in the old, solar-metallicity open cluster M 67 (Paper I), but smaller than was found for more metal deficient RHB stars by Gratton et al. (2000a). This brings additional evidence that mixing processes are metallicity dependent. The C/N ratios in the investigated stars are lowered to values in the range 0.7 to 1.2 which is less than predicted by present day stellar evolution calculations. Gratton et al. (2000a) receive even smaller C/N ratios for the two red horizontal branch stars with [Fe/H] about dex. The ratios are lowered and lie between values 3 and 7 which indicate extra-mixing processes to be quite strong. Six more metal-deficient RHB stars investigated by Gratton et al. (2000a) show ratios from 6 to 12.

|
||||||||||||||||||||||||||||||||||||||||||||||||||||||||||||||||||||||||||||||||||||||||||||||||||||||||||||||||||||||||||||||||||||||||||||||||||||||||||||||||||||||||||||||||||||||||||||||||||||||||||||||||||||||||||||||||||||||||||||||||||||||||||||||||||||||||||||||||||||||||||||||||||||||||||||||||||||||||||||||||||||||||||||||||||||||||||||||||||||||||||||||||||||||||||||||||||||||||||||||||||||||||||||||||||||||||||||||||||||||||||||||||||||||||||||||||||||||||||||||||||
The theoretical standard stellar evolution of the surface carbon isotopic ratios and carbon to nitrogen ratios along the giant branch was homogeneously mapped by Charbonnel (1994) and more recently by Girardi et al. (2000) for stellar masses between 1 and and different metallicities. Our investigated field RHB stars are somewhat metal deficient () and have masses approximately to (Tautvaišienė 1996b). According to Girardi et al. (2000), the C/N and 12C/13C ratios in such stars should drop after the first dredge-up episode to values of about 3 and 35, respectively. Charbonnel (1994, extrapolation to in Figs. 2 and 4) predicted similar values after the first dredge-up.
It has long been known that giant stars regularly show much larger evolutionary changes in these abundances than standard models predict, see e.g. Boothroyd & Sackmann (1999) for references. This is the case also for our derived 12C/13C and C/N ratios. Because of grave differences between model predictions and observations, Charbonnel (1995), Charbonnel et al. (1998) and Boothroyd & Sackmann (1999) performed calculations of models with deep mixing after the first dredge-up. Boothroyd & Sackmann e.g. fitted a one-parameter recipe for “cool bottom processing” (CBP) after the first dredge-up to the available observations of red-giant abundances. Their CBP results are given for initial stellar masses above . It is difficult to say what were the initial masses of the stars we investigate. It could be that they lost about 0.1–0.3 during their evolution on the giant branch (Renzini 1981; Renzini & Fusi Pecci 1988).
The ratios determined for the investigated stars are in quite good agreement with “cool bottom processing” predictions (Boothroyd & Sackmann 1999) for low mass stars with . The C/N ratios, however, request the initial mass of the stars to be of about . The metal-deficient RHB stars investigated by Gratton et al. (2000a) show higher than predicted by CBP ratios but even lower C/N ratios. The low C/N ratios may be an indication that CBP is stronger in such stars than the metallicity scaling of models suggest. However, in view of the sensitivity of C/N ratios to the carbon abundances, we will not claim that the C/N predictions of Sackmann & Boothroyd are wrong, but rather that the C and N abundances should be checked in further studies employing other atomic and molecular features.
4.2 Sodium and aluminium
|
||||||||||||||||||||||||||||||||||||||||||||||||||||||||||||||||||||||||||||||||||||||||||||||||||||||||||||||||||||||||||||||||||||||||||||||||||||||||
Sodium and aluminium are among the mixing-sensitive chemical elements. The star-to-star variations of Na, the existence of Na versus N correlations, and Na versus O anticorrelations in globular cluster red giants have revealed the possibility of sodium and aluminium are produced in red giant stars (see Kraft 1994 and Da Costa 1998 for reviews). It is found also that Na variations exist in all clusters, while Al variations are greater in the more metal-poor clusters (c.f. Norris & Da Costa 1995, Shetrone 1996, Paper I).
Pilachowski et al. (1996) determined sodium abundances for 60 metal-poor halo subgiants, giants, and horizontal branch stars using high dispersion spectra and concluded that there is an intrinsic difference between halo field giants and globular cluster giants. The bright giants in the field do not show the sodium excesses seen in their globular cluster counterparts. The [Na/Fe] ratios in field stars show a wide scatter (ranging from to nearly ) with a slight tendency for [Na/Fe] to increase with advancing evolutionary stage. In a sample of ten field RHB stars investigated by Tautvaišienė (1997) only two of the more metal rich ([Fe/H]) stars showed sodium overabundances of 0.2–0.3 dex.
The stars in our sample show Na and Al abundances which are typical of unevolved stars in the solar vicinity, as determined from the Na i lines 5682.64 and 6154.23 Å and Al i lines 6696.03, 6698.66, 7835.31 and 7836.13 Å, see Fig. 5. Gratton et al. (2000a) investigated possible non-LTE effects for the Na i lines, and find the probable corrections not to be larger than about 0.02 dex at the temperatures and gravities of the stars analysed here.
Theoretical explanations for the production of Na and Al have been proposed by Sweigart & Mengel (1979), Langer & Hoffman (1995), Cavallo et al. (1996), Mowlavi (1999), Weiss et al. (2000) and other studies. The nature and extent of the phenomenon is, however, still not well understood.
Prochaska et al. (2000) investigated abundances of Na and Al in 10 thick disk dwarfs and found aluminium to be much more overabundant than sodium. Our sample of thick disk stars does not show such a pattern.

4.3 Oxygen and magnesium
Surface abundances of oxygen and magnesium could be altered in stars only by very deep mixing. E.g., in cluster giants with large aluminium enhancements ( dex) produced by very deep mixing, Mg depletions should then be about dex (Langer & Hoffman 1995). Since this is not the case for the investigated stars we will discuss our results for oxygen and magnesium in the context of the thick disk of the Galaxy.
In Figs. 6 and 7, we plot oxygen and magnesium abundance ratios and compare them with the modeled ratios describing the mean trend of the Galactic thin disk (Pagel & Tautvaišienė 1995). Other results obtained for the thick disk stars in recent studies are displayed as well. Prochaska et al. (2000) analysed a sample of 10 thick disk stars with the HIRES spectrograph on the 10 m Keck I telescope. Unfortunately, the forbidden [O i] Å line fell in the inter-order gap and the less trustworthy O i triplet lines at 7775 Å had to be used in their analysis. We adopt for the figures the results for 4 thick disk stars from the work by Gratton et al. (2000b). In the same paper a sample of thick disk candidates was selected from the work by Edvardsson et al. (1993). Stars which have [O/H], [Fe/O] and [Mg/H], [Fe/Mg] and appropriate dynamical parameters were attributed to the thick disk. While plotted, the data make quite a cloud lying above the semiempirical trends modeled for the thin disk of the Galaxy by Pagel & Tautvaišienė (1995), but this can hardly be used to draw any conclusions about the location in terms of metallicity of the transition between the halo and thick disk populations. The high accuracy results for magnesium determined by Fuhrmann (1998) lie at the edge of the distribution. This may be taken as an indication that the transition between the halo phase and the thick disk phase took place around [Fe/H] to . Our oxygen and magnesium to iron ratios tend to indicate the onset of supernova of Type Ia (SN Ia) at about [Fe/H] to . We suggest that a model for the halo and thick disk may look much like the model of Pagel & Tautvaišienė (1995), with the difference that the halo phase continued all the way up to [Fe/H] dex.


4.4 Silicon, calcium and titanium
The -elements silicon, calcium and titanium may also bring information on the thick disk of the Galaxy. A large number of spectral lines with accurate -values are available for the analysis which should provide for good abundance precision. Being produced both in Type II and Ia supernova, Si, Ti and Ca may be expected to show smaller overabundances than O and Mg. As is seen from Fig. 8, abundance ratios of these elements to iron may also exhibit slight overabundances with respect to the mean trend of the thin disk.

4.5 - and -process elements
As already mentioned, the barium abundances in our study are corrected for non-LTE effects by the subtraction of 0.20 dex. Two quite similar Ba ii lines and Å were used for the analysis. According to Mashonkina et al. (1999) and Mashonkina & Gehren (2000), the non-LTE correction for the Ba ii line is dex on average in the metallicity range [Fe/H]. Non-LTE effects for the line were not studied well enough, since this line is too saturated in the solar spectrum to provide an accurate correction. Theoretical non-LTE calculations show that non-LTE effects for this line are not smaller than for , only the weak line Å is quite insensitive. In our study, both and 6496 Å gave approximately the same barium abundances, so we decided to apply the same correction to both. In the work by Prochaska et al. (2000) three Ba ii lines , 6141 and 6496 were used, and a typical correction of 0.17 dex was applied.

Abundance ratios of - and -process-dominated (in the Solar system, Burris et al. 2000) elements to iron as a function of iron [Fe/H] for the thick disk stars analysed in the recent studies are presented in Fig. 9. For a comparison, the modeled abundance trends of the Galactic thin disk by Pagel & Tautvaišienė (1997) are shown. As is the case for oxygen and the elements, these elements fit the models for the thin disk reasonably well if we shift the onset of SN Ia from [Fe/H] to dex. Since europium is an almost pure -process element and supposedly produced with oxygen and magnesium in stars exploding as core-collapse supernovae, the thick-disk Eu abundance trend differ quite dramatically from the thin-disk one and may be very useful for population studies. [Eu/Fe] ratios obtained in our sample of thick disk stars and in ten more stars analysed by Prochaska et al. (2000) and Mashonkina & Gehren (2000) bring quite a clear indication that the thick disk population is chemically discrete from the thin disk.
5 Summary and conclusions
More than ten years have passed since the high-resolution spectroscopic study by Barbuy & Erdelyi-Mendes (1989), in which a spread in [O/Fe] ratios at [Fe/H] was proposed to be an indication of a thick disk phase in the chemico-dynamic evolution of the Galaxy. However, further studies by observers and theoreticians did not bring accurate enough characterization of the thick disk of the Galaxy (c.f. Pagel 2001, Bernkopf et al. 2001, Nissen 1999, Chiappini et al. 1997, Robin et al. 1996). The thick disk still needs to be revisited by new observations.
We have presented a detailed chemical abundance analysis of 13 core helium-burning low-mass stars, representatives of the thick disk of the Galaxy. Abundances in the investigated stars show that carbon is depleted by about 0.3 dex, nitrogen is enhanced by more than 0.4 dex, the ratios are lowered to values from 3 to 7 and C/N ratios to values from 0.7 to 1.2. These abundance ratios can only be accounted for by stellar evolution calculations if extra mixing, e.g. “cool bottom processing” (Boothroyd & Sackmann 1999), after the first dredge-up episode is prescribed.
In agreement with other studies of field core-helium-burning stars, our stars do not show enhanced overabundances of Na and Al.
Abundance ratios of O, Mg, Eu and other heavy elements to iron in the investigated stars provide further evidence that the thick disk population had a different chemical history as compared to the thin disk (c.f. Fuhrmann 1998, Gratton et al. 2000b, Prochaska et al. 2000). We propose that the time-scale for metal enrichment was short for the thick disk population, and thet SN Ia started to contribute with iron-peak nuclei only after the overall metallicity reached [Fe/H] or dex.
Acknowledgements.
We wish to acknowledge B.E.J. Pagel and A.I. Boothroyd for insightful discussion and comments. Heidi Korhonen (NOT) and Eduaras Puzeras (ITPA) are thanked for their help in spectral reductions. Bertrand Plez (University of Montpellier II) and Guillermo Gonzalez (Washington State University) were particularly generous in providing us with atomic data for CN and C2 molecules, respectively. We are very grateful to Martin Asplund (Uppsala Astronomical Observatory) for computing of the necessary stellar model atmospheres. We also thank the referee, J.A. Rose, for valuable comments on the manuscript. This research has made use of Simbad and VALD databases. G.T. acknowledges support from NATO Linkage grant CRG.LG 972172. B.E. was supported by the Swedish Natural Sciences Research Council (NFR). I.T. and I.I. acknowledge the Academy of Finland for the research grants 44153 and 10848.References
- (1) Asplund M., Gustafsson B., Kiselman D., Eriksson K. 1997, A&A 318, 521
- (2) Barbuy B., Erdelyi-Mendes M. 1989, A&A 214, 239
- (3) Bartkevičius A., Lazauskaitė R. 1997, Baltic Astron. 6, 499
- (4) Bernkopf J., Fiedler A., Fuhrmann K. 2001, Nature (in press)
- (5) Boothroyd A.I., Sackmann I.-J. 1999, ApJ 510, 232
- (6) Burris D.L., Pilachowski C.A., Armandroff T.E., Sneden C., Cowan J.J., Roe, H. 2000, ApJ 544, 302
- (7) Cavallo R.M., Sweigart A.V., Bell R.A. 1996, ApJ 464, L79
- (8) Charbonnel C. 1994, A&A 282, 811
- (9) Charbonnel C. 1995, ApJ 454, L41
- (10) Charbonnel C., Brown J.A., Wallerstein G. 1998, A&A 332, 204
- (11) Chiappini C., Matteucci F., Gratton R. 1997, ApJ 477, 765
- (12) Clegg R.E.S., Lambert D.L., Tomkin J. 1981, ApJ 250, 262
- (13) Da Costa G.S. 1998, IAUS 189, 193
- (14) Edvardsson B., Andersen J., Gustafsson B., Lambert D.L., Nissen P.E., Tomkin J. 1993, A&A 275, 101
- (15) Fuhrmann K. 1998, A&A 338, 161
- (16) Gilmore G., Reid N. 1983, MNRAS 202, 1025
- (17) Girardi L., Bressan A., Bertelli G., Chiosi C. 2000, A&AS 141, 371
- (18) Gonzalez G., Lambert D.L., Wallerstein G., et al. 1998, ApJS 114, 133
- (19) Gratton R.G., Sneden C., Carretta E., Bragaglia A. 2000a, A&A 354, 169
- (20) Gratton R.G., Carretta E., Matteucci F., Sneden C. 2000b, A&A 358, 670
- (21) Gurtovenko E.A., Kostik R.I. 1989, Fraunhofer’s spectrum and a system of solar oscillator strengths, Kiev, Naukova Dumka, p. 200
- (22) Gustafsson B., Bell R.A., Eriksson K., Nordlund Å 1975, A&A 42, 407
- (23) Gustafsson B., Karlsson T., Olsson E., Edvardsson B., Ryde N. 1999, A&A 342, 426
- (24) Ilyin I.V. 1996, Remote control observation with the SOFIN spectrograph and reduction of CCD échelle spectra. Licentiate dissertation, Univ. Oulu, Finland
- (25) Ilyin I.V. 2000, High resolution SOFIN CCD échelle spectroscopy, PhD dissertation, Univ. Oulu, Finland
- (26) Kraft R.P. 1994, PASP 106, 553
- (27) Kurucz R.L., Furenlind I., Brault J., Testerman L. 1984, Solar Flux Atlas from 269 to 1300 nm, National Solar Observatory, Sunspot, New Mexico
- (28) Langer G.E., Hoffman R.D. 1995, PASP 107, 1177
- (29) Mackay C.D. 1986, ARA&A 24, 255
- (30) Mashonkina I., Gehren T. 2000, A&A 364, 249
- (31) Mashonkina I., Gehren T., Bikmaev I.F. 1999, A&A 343, 519
- (32) Moore C.E., Minnaert M.G.J., Houtgast J. 1966, The Solar Spectrum 2935 Å to 8770 Å NBS Monogr., No. 61
- (33) Mowlavi N. 1999, A&A 350, 73
- (34) Nissen P.E. 1999, Ap&SS 265, 249
- (35) Norris J. 1987, AJ 93, 616
- (36) Norris J.E., Da Costa G.S. 1995, ApJ 441, L81
- (37) Pagel B.E.J. 2001, in Cosmic Evolution, eds. E. Vangioni-Flam & M. Cassé, Paris IAp Coll., World Scientific (in press)
- (38) Pagel B.E.J., Tautvaišienė 1995, MNRAS 276, 505
- (39) Pagel B.E.J., Tautvaišienė 1997, MNRAS 288, 108
- (40) Pilachowski C.A., Sneden C., Kraft R.P. 1996, AJ 111, 1689
- (41) Piskunov N.E., Kupka F., Ryabchikova T.A., Weiss W.W., Jeffery C.S. 1995, A&AS 112, 525
- (42) Plez B. 1999, private communication
- (43) Prieto C.A., Lambert D.L., Asplund M. 2001, astro-ph/0106360
- (44) Prochaska J.X., Naumov S.O., Carney B.W., McWilliam A., Wolfe A.M. 2000, AJ 120, 2513
- (45) Renzini A. 1981, in Effects of Mass Loss on Stellar Evolution, ed. C. Chiosi & R. Stalio (Dordrecht: Reidel), 319
- (46) Renzini A., Fusi Pecci F. 1988, ARA&A, 26, 199
- (47) Robin A., Haywood M., Crézé M., Ojha D.K., Bienayme O. 1996, A&A 305, 125
- (48) Rose J. A. 1985, AJ 90, 787
- (49) Shetrone M.D. 1996, AJ 112, 1517
- (50) Stetson P.B., Aikman G.Ch. 1987, AJ 93, 1439
- (51) Sturch C., Helfer H.L. 1971, AJ 76, 334
- (52) Sweigart A.V., Mengel J.G. 1979, ApJ 229, 624
- (53) Tautvaišienė G. 1996a, Baltic Astron. 5, 503
- (54) Tautvaišienė G. 1996b, Astron. Nachr. 317, 29
- (55) Tautvaišienė G. 1997, MNRAS 286, 948
- (56) Tautvaišienė G., Edvardsson B., Tuominen I., Ilyin I. 2000, A&A 360, 499, (Paper I)
- (57) Tuominen I. 1992, NOT News, No. 5, p. 15
- (58) Upgren A.R. 1962, AJ 67, 37
- (59) Weiss A., Denissenkov P.A., Charbonnel C. 2000, A&A 356, 181
- (60) Wyller A.A. 1966, ApJ 143, 828.