The Munich Near-Infrared Cluster Survey (MUNICS) – Number density evolution of massive field galaxies to as derived from the -Band Selected Survey
Abstract
We derive the number density evolution of massive field galaxies in the redshift range using the -band selected field galaxy sample from the Munich Near-IR Cluster Survey (MUNICS). We rely on spectroscopically calibrated photometric redshifts to determine distances and absolute magnitudes in the rest-frame -band. To assign mass-to-light ratios, we use an approach which maximizes the stellar mass for any -band luminosity at any redshift. We take the mass-to-light ratio, , of a Simple Stellar Population (SSP) which is as old as the universe at the galaxy’s redshift as a likely upper limit. This is the most extreme case of pure luminosity evolution and in a more realistic model will probably decrease faster with redshift due to increased star formation. We compute the number density of galaxies more massive than , , and , finding that the integrated stellar mass function is roughly constant for the lowest mass limit and that it decreases with redshift by a factor of and by a factor of for the two higher mass limits, respectively. This finding is in qualitative agreement with models of hierarchical galaxy formation, which predict that the number density of objects is fairly constant while it decreases faster for more massive systems over the redshift range our data probe.
1 Introduction
Significant progress has been made in understanding galaxy evolution in recent years due to results of statistically significant and complete redshift surveys spanning the redshift range (Lilly et al., 1995; Ellis et al., 1996; Lin et al., 1997, 1999) and due to detailed kinematic and stellar population studies of small samples of galaxies (e.g. Kelson et al., 2001; van Dokkum et al., 2001; Vogt et al., 1996; Bender et al., 1996). On the theoretical side, semi-analytic models of galaxy formation (Kauffmann et al., 1993; Somerville & Primack, 1999; Cole et al., 2000) try to reproduce properties of galaxies in the local universe and predict their evolution with redshift within the framework of a hierarchical CDM-dominated universe.
The traditional observables used to characterize galaxies are unsuitable for studying the assembly history of galaxies, one of the most fundamental predictions of CDM models, since these observables may be transient. The best observable for this aim is, in principle, total mass, which is on the other hand very hard to measure. It has been argued that the best available surrogate accessible to direct observation is the near-IR -band luminosity of a galaxy which reflects the mass of the underlying stellar population and is least sensitive to bursts of star formation and dust extinction (Rix & Rieke, 1993; Kauffmann & Charlot, 1998; Brinchmann & Ellis, 2000). The main uncertainty involved in the conversion of -band light to mass is due to the age of the population, amounting to only a factor of two in mass uncertainty for populations older than Gyr.
In this paper we use the -band selected field galaxy sample of the medium deep, wide-field Munich Near-IR Cluster Survey (MUNICS) to study the number density evolution of massive galaxies. See Drory et al. (2001) for details of the survey (MUNICS1 hereafter). Data presented here refer to galaxies for which high quality VRIJK imaging covering 0.27 square degrees is available (see §2). The distances of the galaxies are derived from spectroscopically calibrated photometric redshifts (§3) and their masses from rest-frame -band luminosities (§4). We discuss the resulting integrated stellar mass functions at different mass limits and their evolution with redshift (§5).


We assume , throughout this paper. We write Hubble’s Constant as , using unless explicit dependence on is given.
2 The Galaxy Sample
The galaxy sample used here is a subsample of the MUNICS survey, selected for best photometric homogeneity, good seeing, and similar depth. Furthermore, in each of the remaining survey patches, areas close to the image borders in any passband, areas around bright stars, and regions suffering from blooming are excluded. The subsample covers 0.27 square degrees in (23.5), (23.5), (22.5), (21.5), and (19.5); the magnitudes are in the Vega system and refer to 50% completeness for point sources.
Stars were identified following the procedure described in MUNICS1 which relies on the combined information of PSF shape and colors in the vs. plane. The color criteria may also exclude compact blue galaxies. Such galaxies are very unlikely to be present in the -selected sample. Since we restrict our analysis to this is anyway not a problem.
The final catalog covers an area of 997.7 square arc minutes and contains 5132 galaxies. The fields included in this analysis are S2, S3f5–8, S5, S6, and S7f5–8. See Table 1 in MUNICS1 for nomenclature and further information on the survey fields.
3 Photometric Redshifts
Photometric redshifts were derived using the method presented in Bender et al. (2001). This method is a template matching algorithm rooted in Bayesian statistics. It closely resembles the method presented by Benítez (2000). The templates are derived by fitting stellar population models of Maraston (1998) to combined broad-band energy distributions of MUNICS galaxies with spectroscopic redshifts. In this way, representative galaxy templates of mixed stellar populations (variable age, metallicity, and dust extinction) optimized for the MUNICS dataset are obtained.
The use of photometric redshifts can introduce systematic errors in the derived galaxy distances. To investigate these errors, we performed the following tests: 1) Templates were derived for a subsample of objects with spectroscopic redshifts and their suitability for the whole galaxy sample was verified using the remaining objects with spectroscopy. 2) Using subsets of the template library, we estimated the errors in the luminosity and mass functions introduced by a finite (and incomplete) set of templates. These were included in our error budget in the analysis. 3) Monte-Carlo simulations were performed to investigate the influence of photometric redshift errors on the luminosity function (LF) and the galaxy number densities. The shape of the LF is not significantly biased as long as the photometric redshifts scatter symmetrically around the true redshifts (see also Subbarao et al., 1996) and their errors are smaller than the bin size in over which the luminosity function is averaged.
Fig. 1 shows the comparison of photometric and spectroscopic redshifts for 310 objects within 5 MUNICS fields. The typical scatter in the relative redshift error is 0.075. The mean bias is negligible. The distribution of photometric redshifts peaks around . and has a tail extending to .
To further strengthen the confidence in the photometric redshifts we show the restframe -band luminosity function (LF) obtained from these data in Fig. 2.

The LF shows no significant evolution up to a redshift of 1.2, in agreement with the finding of Cowie et al. (1996) from a much smaller spectroscopic sample.
4 The Integrated Stellar Mass Function
The integrated stellar mass function , the comoving number density of objects having stellar mass exceeding , is computed using the formalism to account for the fact that some fainter galaxies are not visible in the whole survey volume. Each galaxy in a given redshift bin contributes to the number density an amount inversely proportional to the volume in which the galaxy is detectable in the survey:
| (1) |
where is the comoving volume element, is the survey area, is the maximum redshift at which galaxy having absolute magnitude is still detectable given the limiting apparent magnitude of the survey and the galaxy’s SED (the best-fit SED from the photometric redshift determination).
Additionally, the contribution of each galaxy is weighted by the inverse of the detection probability, , where we assume that the detection probability is independent of the galaxy type and can be approximated by that of point-like sources. We use only objects with , such that this correction is always small. We have checked that this correction does not bias our results by comparing to what we get for higher completeness limits.
To compute the stellar mass of a galaxy, we use an approach which maximizes the stellar mass for any -band luminosity at any redshift. Noting that is a monotonically rising function of age for Simple Stellar Populations (SSPs), we find that the likely upper limit for is the mass-to-light ratio of a SSP which is as old as the universe at the galaxy’s redshift. This is the most extreme case of passive luminosity evolution (PLE) one can adopt. It corresponds to a situation where all massive galaxies would be of either elliptical, S0, or Sa type. We take the mass-to-light ratios from the SSP models published by Maraston (1998), using a Salpeter IMF. Similar dependencies on age are obtained from the models of Worthey (1994) and Bruzual & Charlot (1993) although the absolute values of vary somewhat. The which we obtain with our cosmological parameters at are approximately consistent with of local galaxies (Bell & de Jong, 2001). To obtain a more realistic estimate of , we used our VRIJK color information and the photometric redshift to fit the age and SFR of each galaxy using a grid of composite stellar populations with exponential star formation timescales ranging from 1 to 8 Gyr. We obtain the same slope in the evolution of the average with redshift as the one obtained under the PLE assumption. This modelling will be described in detail in a forthcoming paper.
The mass in solar units is given by
| (2) |
using .
The number density in each redshift bin, , is finally computed by summing over all galaxies in the bin whose stellar mass is exceeding ,
| (3) |
The resulting integrated mass functions for , , and are shown in Fig. 3 along with the integrated luminosity functions for comparison. The mean values of in the maximum PLE model in the four redshift bins are , , , and , as computed from the look-back time in our cosmology. With these mean values the mass limits correspond to absolute -band magnitudes of , , , and , respectively, for . For the numbers are , , , and . Finally, for we have , , , and (magnitudes with respect to ).
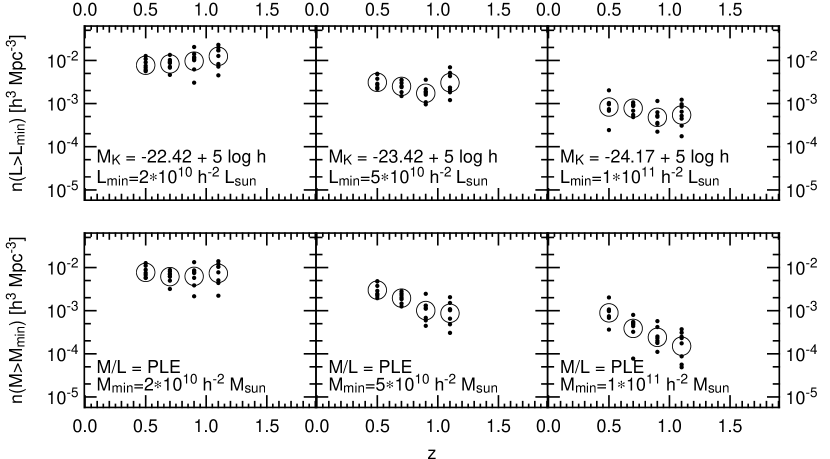
5 Discussion
Fig. 3 compares the evolution of the integrated luminosity to the integrated mass. It is evident that the number density of luminous -band selected galaxies does not evolve significantly (given our uncertainties) to . However, because of the inevitable evolution of the mass-to-light ratio with , the number density of massive systems does change. Transforming luminosities into masses with our maximum PLE scheme yields a roughly constant number density for our lowest mass limit, , and a decrease of the number density with redshift by a factor of for a mass limit of , and by a factor for objects more massive than . As the true at high redshift will most likely be lower than in our maximum PLE model, the true number densities are likely to decrease more rapidly with redshift.
The steepening of the curves with increasing limiting mass in the maximum PLE case (despite them all having the same mass-to-light ratios at any given redshift) is due to the invariance of the LF with redshift and its steepness at the bright end. At increasing limiting mass, one is moving down the steepening bright end of the LF, so that the same change in the mass-to-light ratio yields a higher change in the number density.
The main uncertainty in this conclusion is still the field to field variation, in spite of the relatively large area surveyed, followed by the choice of SED templates used in the photometric redshift code (see above). The size of the open symbols in Fig. 3 represents our estimate of the total uncertainty of the mean values. If we assume a Gould IMF (Gould et al., 1998) instead of a Salpeter IMF, the evolving curve becomes lower in its normalization as the mass-to-light ratio becomes smaller due to the reduced number of low-mass stars. The slope does not change significantly.
The observed density evolution as a function of mass is qualitatively consistent with the expectation from hierarchical galaxy formation models. Most rapid evolution is predicted for the number density of the most massive galaxies while the number density of -galaxies should evolve much less. E.g. Baugh et al. (1998) predict that the number density of galaxies of a stellar mass of decreases by a factor of over redshift range (for the cosmological parameters as used here). Though this agreement is encouraging, both more elaborated models and improved sets of data are required. The latter can be obtained by larger and deeper samples, and more realistic estimates of .
References
- Baugh et al. (1998) Baugh, C. M., Cole, S., Frenk, C. S., & Lacey, C. G. 1998, ApJ, 498, 504
- Bell & de Jong (2001) Bell, E. F., & de Jong, R. S. 2001, ApJ, 550, 212
- Bender et al. (2001) Bender, R., et al. 2001, in ESO/ECF/STScI Workshop on Deep Fields, ed. S. Christiani (Berlin: Springer), 327
- Bender et al. (1996) Bender, R., Ziegler, B., & Bruzual, G. 1996, ApJ, 463, L51
- Benítez (2000) Benítez, N. 2000, ApJ, 536, 571
- Brinchmann & Ellis (2000) Brinchmann, J., & Ellis, R. S. 2000, ApJ, 536, L77
- Bruzual & Charlot (1993) Bruzual, G. A., & Charlot, S. 1993, ApJ, 405, 538
- Cole et al. (2000) Cole, S., Lacey, C. G., Baugh, C. M., & Frenk, C. S. 2000, MNRAS, 319, 168
- Cowie et al. (1996) Cowie, L. L., Songaila, A., Hu, E. M., & Cohen, J. G. 1996, AJ, 112, 839
- Drory et al. (2001) Drory, N., Feulner, G., Bender, R., Botzler, C. S., Hopp, U., Maraston, C., Mendes de Oliveira, C., & Snigula, J. 2001, MNRAS, 325, 550
- Ellis et al. (1996) Ellis, R. S., Colless, M., Broadhurst, T., Heyl, J., & Glazebrook, K. 1996, MNRAS, 280, 235
- Gould et al. (1998) Gould, A., Flynn, C., & Bahcall, J. N. 1998, ApJ, 503, 798
- Kauffmann & Charlot (1998) Kauffmann, G., & Charlot, S. 1998, MNRAS, 297, L23
- Kauffmann et al. (1993) Kauffmann, G., White, S. D. M., & Guiderdoni, B. 1993, MNRAS, 264, 201
- Kelson et al. (2001) Kelson, D. D., Illingworth, G. D., Franx, M., & van Dokkum, P. G. 2001, ApJ, 552, L17
- Kochanek et al. (2001) Kochanek, C. S., et al. 2001, ApJ, submitted
- Lilly et al. (1995) Lilly, S. J., Le Fevre, O., Crampton, D., Hammer, F., & Tresse, L. 1995, ApJ, 455, 50
- Lin et al. (1997) Lin, H., Yee, H. K. C., Carlberg, R. G., & Ellingson, E. 1997, ApJ, 475, 494
- Lin et al. (1999) Lin, H., Yee, H. K. C., Carlberg, R. G., Morris, S. L., Sawicki, M., Patton, D. R., Wirth, G., & Shepherd, C. W. 1999, ApJ, 518, 533
- Loveday (2000) Loveday, J. 2000, MNRAS, 312, 557
- Maraston (1998) Maraston, C. 1998, MNRAS, 300, 872
- Rix & Rieke (1993) Rix, H., & Rieke, M. J. 1993, ApJ, 418, 123
- Somerville & Primack (1999) Somerville, R. S., & Primack, J. R. 1999, MNRAS, 310, 1087
- Subbarao et al. (1996) Subbarao, M. U., Connolly, A. J., Szalay, A. S., & Koo, D. C. 1996, AJ, 112, 929
- van Dokkum et al. (2001) van Dokkum, P. G., Franx, M., Kelson, D. D., & Illingworth, G. D. 2001, ApJ, 553, L39
- Vogt et al. (1996) Vogt, N. P., Forbes, D. A., Phillips, A. C., Gronwall, C., Faber, S. M., Illingworth, G. D., & Koo, D. C. 1996, ApJ, 465, L15
- Worthey (1994) Worthey, G. 1994, ApJS, 95, 107