Determining the location of Gamma-Ray Bursts through the evolution of their soft X-ray absorption
Abstract
We investigate through dedicated numerical simulations the evolution of the soft X-ray absorption properties of a cloud surrounding a gamma-ray burst source. We show that the absorption properties of the material are strongly modified by the ionization induced by the intense burst flux. We derive the temporal evolution of the measured column density as a function of the density and size of the absorbing medium. Even if their statistical significance is not extremely compelling, we find that the detection in several bursts of variable absorption during the gamma-ray phase can be accounted for if these bursts are associated to overdense regions in molecular clouds with properties similar to those of star formation globules. We fit our model variable column density to the data of GRB 980329 and GRB 780506, showing that with this method the size, density and density distribution of the material surrounding a burst can be measured.
keywords:
Gamma-rays: bursts — X-rays: general — X-rays: ISM1 Introduction
An important way to unveil the nature of the Gamma-Ray Burst (GRB) progenitors is to investigate the properties of the ambient medium surrounding them. The most popular models for GRB formation involve either the collapse of a single massive star or the coalescence of two compact objects such as two neutron stars or a neutron star and a black hole (Eichler et al. 1989; Narayan et al. 1992; Woosley 1993) These models could be constrained by knowing the GRB environment. Massive stars have very short lives, thus they will explode in star-forming regions, which are typically characterized by very dense environments. On the other hand, most merging neutron stars would be very old and would have typically traveled far from their birthplace. The scenario of compact merger progenitors could thus be suggested by medium to low density environments. Recent observations (see e.g. Kulkarni et al. 1999) for the subclass of long bursts seem to suggest their association with star-forming regions.
Within the context of GRB progenitors involving the collapse of a massive star, several proposals have been made: the so-called “hypernova” scenario (Paczyński 1998; MacFadyen & Woosley 1998) predicts a simultaneous explosion of the burst with a Type Ic supernova, while the “Supranova” model by Vietri & Stella (1998) predicts a two-step explosion, in which the burst onset follows a supernova explosion by several months. While the rebrightening of the optical afterglows detected in several bursts days after the burst explosion (Bloom et al. 1999; Reichart 1999; Galama et al. 2000) is suggestive of the first scenario, the detection of iron emission and absorption features in the X-ray emission of the bursts and afterglows (Amati et al. 2000; Piro et al. 2000) can be better explained with a two-step explosion (Lazzati et al. 2001a). Independent tests of these different scenarios are therefore needed. A study of the density distribution in the close environment of the bursts can be a powerful diagnostic of the type of progenitors. In fact, if the burst explodes simultaneously with the supernova, the photons propagate through the pre-explosion stellar wind [], while in the two-step scenario a high density metal enriched supernova remnant is expected to surround the burst explosion site (Lazzati et al. 1999).
Various methods have been proposed to investigate the properties of the GRB environment. It has been shown that the effect of the surrounding material on the propagation of photons can be a probe of the material itself through the detection of absorption features and their time evolution (Perna & Loeb 1998; Meszaros & Rees 1998; Böttcher et al. 1999; Ghisellini et al. 1999; Lazzati et al. 2001abc; Ramirez-Ruiz et al. 2001a). In X-rays, it is particularly interesting the possibility to detect iron absorption edges (Ghisellini et al. 1999; Böttcher et al. 1999, Weth et al. 2000) and their time evolution (Lazzati et al. 2001c; Böttcher et al. 2001). In the optical, the evolution of the equivalent width of absorption features has been investigated by Perna & Loeb (1998). On the other hand, modelling the afterglow spectral and intensity evolution in the framework of the external shock synchrotron model can also constrain the type of environment (Wijers & Galama 1999; Berger et al. 2000; Panaitescu & Kumar 2001, Ramirez-Ruiz et al. 2001b). In the first case, however, the search for the signatures of the material is made difficult by the low signal-to-noise ratio of the lines, while the second procedure heavily relies on a particular model, and hence depends on its assumptions.
In this paper, rather than considering the feature produced by a particular transition, we consider the continuum soft X-ray absorption caused by the photoionization of low-intermediate atomic number () atoms along the line of sight to the burst (Morrison & McCammon 1983). This absorption is usually quantified by means of the quantity , the column density of neutral material with solar metallicity that would cause the observed absorption (in the simulations we use abundances from Anders & Ebihara 1982). The presence of is generally much easier to detect with respect to a Fe absorption edge. In fact, the opacity of iron at keV is less than one hundredth of the opacity at 1 keV of a material with solar iron abundance (Morrison & McCammon 1983). On the other hand, the precise measurement of the absolute value can be model dependent. In fact, the measurement is performed by computing the difference of the observed soft X-ray flux with respect to an assumed model in the same band. A spectral break at keV may for this reason induce a high spurious measurement.
In the following sections we present the results of numerical simulations for the evolution of the measured as a function of the time elapsed after the onset of a source of ionizing photons in its centre. We consider in particular the possibility of detecting a variation of the column density during the seconds of duration of a typical GRB. By imposing that the should remain above the detection threshold for a reasonable time (1 s) but vary in less that the GRB duration, we can strongly constrain the geometrical properties of the material surrounding the GRB. We then compare our results with the measurements performed in the early emission of GRB 980329 (Frontera et al. 2000) and GRB 780506 (Connors & Hueter 1998).
2 Numerical Simulations

In the case of a single atomic transition it is possible to derive analytical equations to describe the time evolution of its opacity in the optically thin regime (Lazzati et al. 2001c). In the case of continuum absorption the calculation is complicated by the need of keeping track of all the ionization states of the various elements and relative cross sections. For this reason the problem can be faced only with the use of numerical simulations.
We have used the time-dependent photoionization code described in Lazzati et al. (2001c), which is based on routines developed by Raymond (1979) and specialized to the case of GRBs and their remnants by Perna, Raymond & Loeb (2000) and Perna & Raymond (2000). As described by Perna et al. (2000), this code computes in a fully time-dependent fashion the ionization state of the 12 most abundant astrophysical elements, while updating, at each time step, the temperature of the plasma111See also Schwarz 1973 for related work.. The ionizing continuum is simulated in the range [0.01-10] keV with a spectrum relevant to GRB emission222Note that the ionizing continuum has to be simulated in a spectral band wider than the one in which the absorption is measured since soft photons can ionize ions that contribute to the opacity at higher frequencies.. We adopted a photon index and constant luminosity erg s-1 in the [2–10] keV band for . We considered three different radial distributions of the density of absorbers: a uniform cloud with cm, a shell with cm and and a wind with for cm and for smaller radii. For the uniform and shell geometries, we performed simulations with initial column densities ranging from cm-2 to cm-2, logarithmically spaced by a factor . In the case of the wind geometry, we considered only high values of the initial column density because of its very rapid decrease with time, and we performed simulations for the initial values , and cm-2.
Even though the simulations for the uniform and shell geometries are performed for a single value of the outer radius of the absorber distribution (see above), these can be applied to rescaled matter distributions. In fact, given a distribution of absorbers and the ionizing luminosity , the results of the simulations can be extended to any distribution (where is a scale parameter) and any luminosity . The time of photoionization of an ion is proportional to the flux, which scales as , where is the distance of the ion from the photon source and the luminosity of the ionizing photons. For this reason
| (1) |
where is the column density as a function of time from the simulation and is the column density as a function of time for the ionizing luminosity and the distribution of absorbers .
2.1 Computation of the “observed” column density evolution
The above described numerical code produces frequency and time-dependent opacities by fully accounting for the spectral variation with time of the opacity as the gas makes the transition from neutral to fully ionized; as such, however, the output of the code contains much more information than the observational data. This is particularly true for the GRB prompt X-ray emission, usually detected with proportional counter detectors, such as the BeppoSAX Wide Field Cameras (WFC). In particular, what is usually measured from the observed spectra is the amount of soft X-ray absorption, parameterized with the hydrogen column density in the assumption that all the material is cold, i.e. neutral (Morrison & McCammon 1983). We hence applied an analogous procedure to our synthetic dataset, averaging the opacity in the observed band in order to reduce the information contained in the simulated spectrum to a column density to be compared with the observations. This is equivalent to assume that the time and frequency-dependent opacity can be decomposed as , where is the average cross section at frequency , independent of time, weighted with the abundance of each element. Our procedure is also justified by the fact that the most widely used software for X-ray data analysis (XSPEC; Arnaud 1996) neglects the change of with ionization to compute the column density (model WABS) when the single ion features cannot be resolved333Note that there are cases, such as that of the warm absorbers, where the effects of the spectral variations of the opacity can actually be observed through the enhancement of the absorption edges of intermediate elements (see, e.g., Fabian et al. 1994 for a more refined treatment of warm absorbers). In our case, however, the situation is made more difficult by the fact that the absorber is not in the same ionization state at a given time . The inner regions will be completely ionized at a time in which the outer regions are still cold, while gas at intermediate distance is warm.. The consequence of this assumption is that the column density at a given time has a small dependence on the band in which it is measured. In the present paper we consider the energy range [2–10] keV, since our aim is to compare our results with the measurements performed with the BeppoSAX WFC.
In the above approximation, we compute the column density as:
| (2) |
where the symbol represents the average over the frequency range [2–10] keV. In Fig. 1 we show the results of a simulation for a uniform cloud with cm-2 and cm. The opacities as a function of frequency are plotted for several times after the burst onset, while the inset shows the evolution of the column density in the first 100 s of the simulation.
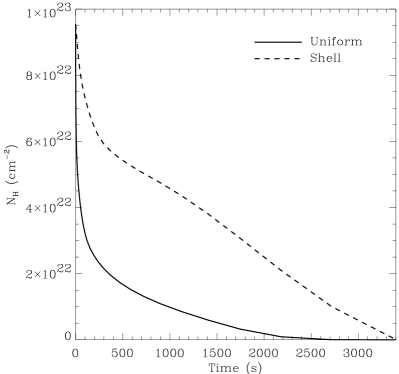
In Fig. 2 we show the results of two simulations with identical initial conditions, but for different geometries of the absorbing material. The evolution of the absorbing column density in a uniform cloud and a shell are shown with a solid and a dashed line, respectively. The column density of a shell environment has a roughly linear decay, slower than that of the uniform cloud. This is due to the fact that in a shell geometry all the material is located at a large distance from the source of ionizing photons, and hence the ionization time is longer. With a good dataset, this difference can be succesfully used to investigate the radial structure of the absorbing medium.
3 Burst environment
In several bursts, detection of variable low-energy X-ray absorption has been claimed (GRB 780506, Connors & Hueter 1998; GRB 980329, Frontera et al. 2000; GRB 990705, Amati et al. 2000; GRB 010222, in’t Zand et al. 2001). In this section we examine under which conditions such an evolution of the measured column density can be detected during the prompt emission of the bursts.
In order to detect an variation it is sufficient (but also necessary) that the following two constraints be satisfied. First, the spectrum of the GRB must be integrated in order to perform a measurement of column density. The minimum integration time (see e.g. Frontera et al. 2000) is of the order of several seconds. Variations of the column density can then be detected only if
| (3) |
where is the measured one second after the burst onset, and is the Galactic column density. With this condition we ensure that the column density in the surroundings of the GRB gives a detectable signal in the first integration bin.
On the other hand, in order to detect a variation, the column density must sensibly decrease during the GRB emission time. Our second condition is then that the observed column density decrease by a factor of two in less than 100 seconds, the average burst duration444The factor that we use in Eq. 4 has been chosen since a sizable decrease of the absorbing column is needed in order to have a significant measurement of its variation (see below). We tested different values (namely 1.1 and 10) finding that the allowed region changes slightly, but the conclusions are not significantly affected.:
| (4) |
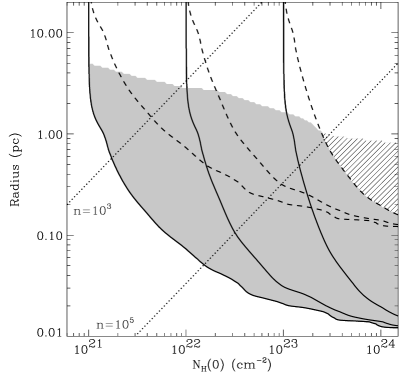
We must also consider that the burst itself has to be detected. Since the soft -rays, in which GRBs are usually detected, are not attenuated by photoabsorption, we consider Thomson scattering as the most effective attenuation process. We then have cm-2. If cm-2, the [2–10] keV flux is completely absorbed and only a lower limit to the column density can be measured. In the extreme case of a large and dense cloud (line-shaded region in Fig 3, 4 and 6) the opacity in the [2–10] keV range is larger than unity for the whole duration of the bursts, and no flux can be detected in this band.
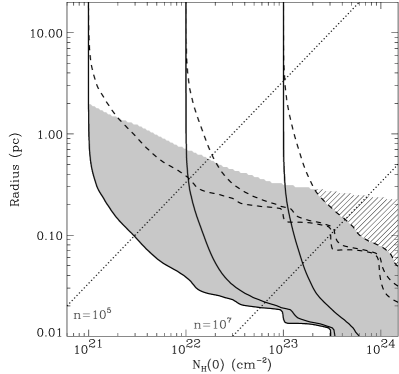
In Fig. 3, 4 and 5 we show that conditions (3) and (4) can be satisfied only in a limited range of cloud radii, geometries and initial column densities. In Fig. 3 we show the column density at time s and s as a function of the cloud radius and initial column density with solid and dashed contours, respectively. The shaded area underlines the region in which both conditions are satisfied. This shows that, in order to detect variations during the prompt emission of the burst, the absorbing region surrounding the GRB must be compact, with a radius pc and initial column density cm-2. This translates to volume densities cm-3 (dotted lines). Figure 4 shows the same results but for a shell with .

The possible contribution of a wind environment to the column density evolution is considered in Fig. 5. In the figure we plot the measured as a function of time for three different initial column densities: from a thin cm-2 wind to a maximum value of cm-2. Figure 5 shows how, no matter the initial value of the column density, it drops to an undetectable level in less then a fraction of a second. This is due to the fact that, in the case of a wind geometry, the column density is dominated by the region very close to , for which the ionization time is very short.
In order to compare the inferred cloud properties with the properties of Galactic molecular clouds, in Fig. 6 we compare the gray region in the parameter space with the properties of Galactic molecular clouds and their denser regions. We assume that the burst explodes in the centre of these regions. In Fig. 6, the circles show the properties of a sample of cloud radii and masses presented in Leisawitz et al. (1989), from which we derived average column densities. There are no circles that fall in the allowed region shaded in grey. Inside molecular clouds, however, there are overdense regions, where star formation is supposed to take place. The triangles show the position in the diagram of a sample of dense molecular cloud cores, selected for their presence of H2O masers and in which massive star formation is taking place (Plume et al. 1997). Their radii and column densities are consistent with the shaded region. In some cases the column density is even too high. A sample of Bok globules (Launhardt et al. 1998), thought to be directely related to star formation, is shown with asterisks. Their properties are fully consistent with the shaded region. Finally, we plot with diamonds the properties of dense cores in the Taurus molecular clouds, where low-mass star formation is though to happen (Zhou et al. 1994). These are too compact with respect to the shaded regions. It is however worth mentioning that the properties of these overdense regions at the time of the burst explosion may be somewhat different, due to the radiation pressure exerted by the luminosity of the massive star progenitor to the burst.
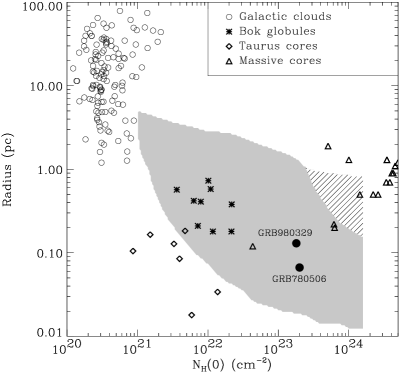
Should these variations be confirmed, they indicate that the burst progenitors (or at least some of them) are located inside overdense regions of molecular clouds. The properties of these regions are consistent with those of the places in which massive star formation takes place.
3.1 GRB 980329
To date, three GRBs detected by the WFC on board BeppoSAX showed evidence of variable soft X-ray absorption. Published data are available for GRB 980329 (Frontera et al. 2000). These data are shown, along with their uncertainties, in Fig. 7. The error bars on the last two measurements, non quoted in the original paper, have been assumed equal to the measurements themselves. The timescale has been reported to the beginning of the flaring activity of the burst, which starts s after the trigger (see Fig. 1 of Frontera et al. 2000)
We fitted our uniform-cloud and shell models for the evolution of the column density to the data. For the uniform model we obtained the best values cm-2 and pc ( cm-3), while in the shell case we obtain cm-2 and pc. In Fig. 7, the best fit models are shown with a solid line (uniform) and dashed line (shell). The shell model has a better value, but due to the large uncertainties in the measurement, the two geometries cannot be significantly disentangled. The upper right inset shows the , 90 per cent and 99 per cent confidence contours for the two parameters in both cases. Since the statistical significance of the variation of the column density is not compelling, the 99 per cent confidence contour is not closed. The different evolution of the two models shows, however, that with good quality data it is in principle possible to understand what is the geometry of the medium surrounding GRBs.

A problem in the fit of GRB 980329 data is the lack of a redshift measurement of the burst. In fact all our simulations are performed in the rest frame. The model should be however modified in two ways if the source of absorption lies at redshift . First, the timescale is stretched by a factor . Most importantly, if a column density surrounds a source at redshift , the soft X-ray absorption measurement will yield a measured value , where the exponent holds in the redshift range . This implies that for a source at redshift the measured column density is underestimated by a factor . The modelling of the data with a known redshift may hence give a best fit which is an even more compact and dense cloud.
3.2 GRB 780506

Besides the three bursts detected by the BeppoSAX WFC, a measurement of column density was possible in a burst serendipitously detected in 1987 by the HEAO-1 satellite with the A-4 and A-2 instruments (GRB 780506, Connors & Hueter 1998). The burst spectrum was fitted with a three component model: a power-law, a thermal component and an absorption component, with the column density free to vary. The lightcurve was integrated in time bins of 10.24 s each and the six spectra were fitted indipendently. The measured values are shown in Fig. 8. In the first time bin a very significant () soft X-ray absorption was detected, while the fits in the remaining 5 time intervals yielded only upper limits. Fitting our uniform cloud model to the data, again without the possibility to correct for the redshift of the burster, we find a best fit cloud with cm and cm-2. Since only one positive measurement was possible, as shown by the inset in Fig. 8, the radius and initial column density of the cloud cannot be precisely determined simultaneously. We can safely conclude, however, that the density of the cloud was cm-3. Since for this burst only one positive measurement was obtained, it is not possible to distinguish between a uniform and a shell geometry.
4 Discussion and Conclusions
We have performed numerical simulations to compute the evolution of the soft X-ray absorption of a cloud under the ionization flux of a Gamma-Ray Burst exploded at its centre. We have considered a uniform cloud, a shell and a wind geometry, and we have shown that variations of the column density during the duration of a GRB can be detected only under well-defined geometrical conditions of the absorbing material.
The column density of a wind, in which the bulk of the material responsible for the absorption is close to the GRB, cannot survive the first milliseconds of the illumination and is undetectable with the present instrumentation. On the other hand, if the material is spread uniformly over a region with size pc, the soft X-ray absorption can be observed to evolve in time. Present data do not allow to firmly detect the evolution of the column density, nor to tell if the material is uniformly spread around the source or rather concentrated in a shell at distance from the burster. By comparing the allowed properties of molecular clouds with the results presented here, we conclude that the weak evidence of variation during the prompt X-ray emission of some GRBs can be accounted for if they are associated to compact overdense regions similar to the cocoon of star formation within molecular clouds or to Bok globules.
A number of approximations have been applied to this analysis and are worth a discussion. First, we consider an ionizing flux with fixed spectrum and luminosity. Both these assumptions are coarse approximations of a GRB lightcurve and spectral evolution. Even though GRB are frantically variable, the results of our simulations are exact if the time is substituted with the quantity , where is the total burst duration. Since in this work the detailed time variability of the lightcurve is not addressed, the approximation of constant luminosity is reasonable.
A more important issue is the variation of the spectral slope with time. More complete simulations of time-dependent column densities will be presented in a forthcoming paper (Perna et al. in preparation), in which the dependence of the observed column density on the ionizing spectrum will be discussed in detail. However, is a good value for the average time integrated low-energy slope of GRBs (Preece et al. 2000).
We have assumed that the medium is at rest during the photoionization process. While Lazzati et al. (2001c) showed that the fireball interaction is not important, radiation pressure may accelerate the medium. The ratio of the timescale of photoionization over the timescale of acceleration is given, for a spectrum, by:
| (5) |
where is the break energy of the GRB spectrum and is the average photoionization cross section at the threshold energy weighted with the element solar abundance (Anders & Ebihara 1982). Even for iron, the relevant element with the highest threshold energy, the acceleration timescale is several orders of magnitude longer than the photoionization one.
Finally, as discussed in §4.1, the redshift of the burst introduces time dilation and decreases the observed column density at a given time. All these factors have not been taken into account in Fig. 3 and Fig. 4, so that the gray shaded regions should be considered indicative, with uncertainties up to a factor of order unity. Nevertheless we can firmly conclude that if a column density variation is observed in the first seconds of the prompt emission of a GRB, then it must be located within a cloud with properties roughly consistent with those of Fig. 3 or inside a shell (Fig. 4). We have not considered here the possibility of a beamed fireball. In the case of a conical jet, as discussed to date for GRB fireballs (Sari et al. 1999, Ghisellini & Lazzati 1999, Panaitescu & Kumar 2001), beaming does not affect our calculations, since all processes take place along the line of sight. In the case of a cylindrical jet, the radial dilution of photons would be different, and our computations are not appplicable.
Variations in the soft X-ray absorption have indeed been claimed in several bursts. Only one of them, however, shows this evidence quite clearly. GRB 780506, serendipitously observed by the HEAO-1 satellite (Connors & Hueter 1998) has a highly significant soft X-ray absorption in the first time integration bin, which vanishes in the rest of the burst lightcurve (Fig. 8). GRB 980329 (Frontera et al. 2000), shows a very well defined trend of the to decrease with time, which can be fit in our model (see Fig. 7), but with large statistical uncertainties. GRB 990705 (Amati et al. 2000) shows evidence of time dependent iron absorption features. An evolution of the column density is also claimed, but the data are not published. Finally, GRB 010222 (in ’t Zand et al. 2001) shows clear evidence of variations, but the column density appears to rise and fall, a behavior that cannot be explained in our model and is likely due to the presence of a spectral break that moves inside and outside the observing window.
As a consequence of the high density () described above, the afterglow of the bursts should evolve more rapidly than in a very low density environment. In particular, the time at which the relativistic to non-relativistic transition takes place is d (see, e.g. Wijers, Rees & Meszaros 1997), where is the isotropic fireball energy in units of erg and the density of the surrounding medium in units of cm-3. Unfortunately, there are not accurate afterglow lightcurves for any of the bursts described in this paper. Indeed, a very high density of the surrounding medium is required in GRB 990705 (Lazzati et al. 2001a). In the case of GRB 010222, which displays variations but cannot be straightforwardly included in our model, a very high density of the surrounding medium is claimed (in ’t Zand et al. 2001) on the base of spectral and lightcurve considerations.
The HETE2 satellite has on-board two experiment, the Soft X-ray Camera (SXC) and the Wide Field X-ray Monitor (WXM) potentially sensitive to variations. The SXC, has an effective area of cm2, is sensitive in the [0.5–10] keV range and has a field of view of 0.91 sr. The WXM has a larger effective area (175 cm2) and field of view ( sr) but is sensitive in the harder [2–25] keV band, where continuum absorption is less severe. The combination of these two instruments, however, will hopefully clarify the properties and time variability of the soft X-ray absorption in the early prompt X-ray spectra of GRBs.
Acknowledgments
We wish to thank the anonymous referee for his/her careful reading of the manuscript and useful comments. We thank Gabriele Ghisellini, Enrico Ramirez-Ruiz, Martin Rees, Luigi Stella and Mario Vietri for very useful discussions and suggestions. We thank John Raymond for his help in the process of updating the numerical code used in this work.
References
- [1] Amati L., et al., 2000, Science, 290, 953
- [2] Anders, E., & Ebihara, N. 1982, Geochim. Cosmochim. Acta, 46, 2363
- [3] Arnaud, K. A., 1996, in ASP Conf. series, Astronomical Data Analysis Software and Systems V, eds. G. H. Jacoby & J Barnes (S. Francisco: ASP), 17
- [4] Berger E. et al., 2000, ApJ, 545, 56
- [5] Bloom J. S. et al., 1999, Nat., 401, 453
- [6] Böttcher M., Dermer C. D., Crider A. W., Liang E. P., 1999, A&A, 343, 111
- [7] Böttcher M., Dermer C. D., Amati L., Frontera F., 2001, in Proc. of the 2nd Workshop “Gamma-Ray Bursts in the afterglow era”, Rome, Eds. ???
- [8] Connors A, Hueter G. J., 1998, ApJ, 501, 307
- [9] Eichler, D., Livio, M., Piran, T., & Schramm, D. N. 1989, Nature, 340, 126
- [10] Fabian A. C. et al., 1994, PASJ, 46, L59
- [11] Frontera F. et al., 2000, ApJS, 127, 59
- [12] Galama T. J. et al., 2000, ApJ, 536, 185
- [13] Ghisellini G., Haardt F., Campana S., Lazzati D., Covino S., 1999, ApJ, 517, 168
- [14] Ghisellini G., Lazzati D., 1999, MNRAS, 309, L7
- [15] in ’t Zand J. J. M., et al., 2001, ApJ in press (astro-ph/0104362)
- [16] Kulkarni S. R. et al., 1999, in Proceedings of the 5th Huntsville Gamma-Ray Bursts Symposium, Eds. Kippen R. M ., Mallozzi R. S., Fishman G. J., AIP conference proceedings 256
- [17] Launhardt R., Evans N. J., Wang Y., Clemens D. P., Henning T., Yun J. L., 1998, ApJS, 119, 59
- [18] Lazzati D., Campana S, Ghisellini G., 1999, MNRAS, 304, L31
- [19] Lazzati D., Ghisellini G., Amati L, Frontera F., Vietri M., Stella L., 2001a, ApJ, 556, 471
- [20] Lazzati D., Covino S., Ghisellini G., 2001b, MNRAS submitted (astro-ph/0011443)
- [21] Lazzati D., Perna R., Ghisellini G., 2001c, MNRAS, 325, L19
- [22] Leisawitz D., Bash F. N., Thaddeus P., 1989, ApJS, 70, 731
- [23] MacFadyen, A., & Woosley, S. E. 1999, ApJ, 524, 262
- [24] Meszaros, P. & Rees, M. J. 1998, MNRAS, 299, 10
- [25] Morrison R., McCammon D., 1983, ApJ, 270, 119
- [26] Narayan, R., Paczyński, B., & Piran, T. 1992, ApJ, 395, 183
- [27] Paczyński, B. 1998, ApJ, 494, L4
- [28] Panaitescu A., Kumar P., 2001, ApJ, 554, 667
- [29] Perna R., Loeb, A., 1998, ApJ, 501, 467
- [30] Perna, R., Raymond, J., 2000, ApJ, 539, 706
- [31] Perna R., Raymond J., Loeb A., 2000, ApJ, 533, 658
- [32] Plume R., Jaffe D. T., Evans N. J., Martín-Pintado J., Gómez-González J., 1997, ApJ, 476, 730
- [33] Preece R. D., Briggs M. S., Mallozzi R. S., Pendleton G. N., Paciesas W. S., Band D. L., 2000, ApJS, 126, 19
- [34] Ramirez-Ruiz E., Trentham N., Blain A.W., 2001a, MNRAS in press (astro-ph/0103239)
- [35] Piro L. et al., 2000, Science, 290, 955
- [36] Ramirez-Ruiz E., Dray L. M., Madau P., Tout C. A., 2001, MNRAS, 327, 829
- [37] Raymond J. C., 1979, ApJS, 39, 1
- [38] Reichart D. E., 1999, ApJ, 521, L111
- [39] Sari R, Piran T., Halpern J. P., 1999, ApJ, 519, L17
- [40] Schwarz, J. 1973, ApJ, 182, 449
- [41] Vietri, M. & Stella, L. 1998, 507, L45
- [42] Weth C., Mészáros P., Kallman T., Rees, M. J., 2000, ApJ, 534, 581
- [43] Wijers R. A. M. J., Rees M. J., Meszaros P., 1997, MNRAS, 288, L51
- [44] Wijers R. A. M. J., Galama, T. J., 1999, ApJ, 523, 177
- [45] Woosley S. E., 1993, ApJ, 405, 273
- [46] Zhou S., Evans N. J., Wang Y., Peng R., Lo K. Y., 1994, ApJ, 433, 131