The Chandra Deep Field South: the 1 Million Second Exposure11affiliation: Based on observations made at the European Southern Observatory, Paranal, Chile. The EIS observations have been carried out using the ESO New Technology Telescope (NTT) at the La Silla observatory (ESO LP 164.O-O561).
Abstract
We present the main results from our 940 ksec observation of the Chandra Deep Field South (CDFS), using the source catalog described in an accompanying paper (Giacconi et al. 2001). We extend the measurement of source number counts to in the soft 0.5–2 keV band and in the hard 2–10 keV band. The hard band Log N–Log S shows a significant flattening (slope) below , leaving at most 10–15% of the X–ray background (XRB) to be resolved, the main uncertainty lying in the measurement of the total flux of the XRB. On the other hand, the analysis in the very hard 5–10 keV band reveals a relatively steep Log N–Log S (slope ) down to . Together with the evidence of a progressive flattening of the average X–ray spectrum near the flux limit, this indicates that there is still a non negligible population of faint hard sources to be discovered at energies not well probed by Chandra, which possibly contribute to the 30 keV bump in the spectrum of the XRB. We use optical redshifts and identifications, obtained with the VLT, for one quarter of the sample to characterize the combined optical and X–ray properties of the CDFS sample. Different source types are well separated in a parameter space which includes X–ray luminosity, hardness ratio and color. Type II objects, while redder on average than the field population, have colors which are consistent with being hosted by a range of galaxy types. Type II AGN are mostly found at , in contrast with predictions based on AGN population synthesis models, thus suggesting a revision of their evolutionary parameters.
1 Introduction
With deeper and deeper exposures the Chandra X–ray Observatory has resolved an increasingly large fraction of the X–ray background (Mushotzky et al. 2000; Hornschemeier et al. 2000, 2001; Giacconi et al. 2001–Paper I; Tozzi et al. 2001–Paper II; Brandt et al. 2001a), particularly at high ( keV) energies. With the completion of two 1 Megasec Chandra exposures early this year, the Chandra Deep Field South (CDFS, the subject of this Paper) and North (CDFN, Brandt et al. 2001b), the original X–ray glow discovered by Giacconi et al. in 1962 is now almost completely resolved in individual sources by confusion-free Chandra images. Observational and theoretical studies over the last two decades have lead to a picture in which the X–ray background (XRB) is due to accretion onto super-massive black holes, integrated over cosmic time. With these new observations, the general interest is now focusing on understanding the physical nature and the cosmic evolution of these extragalactic sources, and their role in models of galaxy evolution (e.g. Fabian 1999; Gilli, Salvati & Hasinger 2001).
In Paper I, we presented the first results from a 118 ks exposure. In Paper II, we extended the statistical analysis of the X–ray properties to 200 sources from a 300 ks exposure, and reported on the optical identification and redshifts of a sizeable subsample from the first results of our on–going spectroscopic program with the VLT. The X–ray spectra were found to become progressively harder at fainter fluxes, with an average stacked spectrum well fitted in the 1–10 keV range by a power law with photon index , i.e., very close to the known spectral shape of the XRB (Marshall et al. 1980; Gendreau et al. 1995). The Log N–Log S relation from the 300 ks observations showed a significant flattening down to a flux limit of when compared to previous ASCA determinations at fluxes larger than (e.g. Cagnoni et al. 1998; Della Ceca et al. 1999) and fluctuation analysis from Beppo SAX down to (Perri & Giommi 2000). These sources accounted for 60-90% of the hard XRB, the main uncertainty lying in the measurement of its absolute value with previous X–ray missions. In Paper II, we also found that the optical spectra and X–ray luminosities for most of the hard sources are those typical of Type II AGN, in keeping with expectations of AGN population synthesis models of the XRB (e.g. Setti &Woltjer 1989; Madau, Ghisellini & Fabian 1993; Comastri et al. 1995, Gilli, Salvati & Hasinger 2001).
We present here the main results from the analysis of the 940 ks exposure (hereafter 1 Msec) of the CDFS. In Section 2, the Log N–Log S relations are used to estimate the resolved fraction of the XRB in the soft (0.5–2 keV) and hard (2–10 keV) bands. In Section 3 we discuss some of the optical properties of the source population in light of the spectroscopic identification of 83 sources to date. The underlying catalog of X–ray sources used in this Paper is presented in Giacconi et al. (2001, hereafter Paper III) along with optical identifications in deep R band imaging data.
The spectroscopic dataset, which is being collected with on–going observations with the FORS spectrograph at the VLT, is presented elsewhere (Szokoly et al. in prepration), while a detailed analysis of the X–ray spectra of the CDFS sources and a comparison with AGN models are presented in a forthcoming paper (Gilli et al. in preparation).
2 Statistical properties of the X–ray source population
The Mega second dataset of the CDFS is the result of the coaddition of 11 individual Chandra ACIS–I (Garmire et al. 1992; Bautz et al. 1998) exposures with aimpoints only a few arcsec from each other. The nominal aim point of the CDFS is 3:32:28.0, 27:48:30 (J2000). We selected this field in a patch of the southern sky characterized by a low galactic neutral hydrogen column density ( cm-2) and a lack of bright stars. The diary of observations is given in Paper III. The processing method (data filtering, photon stacking, calibration procedures) is described in Papers II and III. Due to different roll angles of the individual pointings, the final image covers 0.109 deg2. The decrease of effective exposure time and degradation of the angular resolution at large off–axis angles cause the sky coverage to drop below in the soft and hard bands respectively (Papers II and III).
In Figure 1, we show the color composite image of the CDFS. This was constructed by combining images (first smoothed with a Gaussian with ) in three bands (0.3–1 keV, 1–2 keV, 2–7 keV), which contain approximately equal numbers of photons from detected sources. Blue sources are those undetected in the soft (0.5–2 keV) band, most likely due to intrinsic absorption from neutral hydrogen with column densities cm-2. Very soft sources appear red. A few extended low surface brightness sources are also readily visible in the image.
Papers II and III describe in detail detection algorithms and photometric procedures used. By using a signal–to–noise threshold of 2.1, we detected 346 sources in the 0.5–7 keV band; 307 have in the soft band, 251 in the hard band and 110 in the very hard (5–7 keV) band. This S/N criterium was chosen to limit the total number of spurious sources to less than 10, as established with extensive simulations (see Paper II). The faintest detected sources have approximately 10 counts in the soft band and 13 in the hard band.
For a power law source spectrum with a photon index , absorbed by a Galactic column densities of , we obtain a conversion factor of per count s-1 in the soft band (count rate in 0.5–2 keV to flux in the same band), per count s-1 in the hard band (count rate in 2–7 keV to flux in 2–10 keV), and per count s-1 in the very hard band (count rate in 5–7 keV to flux in 5–10 keV). The assumed source spectrum is justified by the stacked spectral analysis of all detected sources (see below). The uncertainty in the conversion factors corresponds to the observed range of the average spectral index ().
With these conversion factors, the on–axis flux limits for the soft, the hard and the very hard bands are , , and respectively. These values refer to the fluxes at which the sky coverage drops to zero for the assumed detection threshold. We should stress that point sources at fluxes fainter than these limits can statistically be detected in the CDFS, at the expenses of increasing substantially the number of spurious sources. This approach would not have any significant benefit however, since the area covered at these fluxes is and therefore only a handful of real sources would add to the sample. In addition, the sky coverage becomes increasingly inaccurate at very faint detection limits, making the faint end of the number counts very uncertain.
In Paper III we also presented a catalog of sources characterized as extended. Visual inspection and optical colors indicate that some of them are groups or isolated early type galaxies at . In several cases however, the X–ray emission is dominated by a central, hard component which is likely due to low–level nuclear activity. The mean surface brightness of these diffuse sources is as low as , i.e. between 10 and 20 times fainter than the faintest extended sources discovered by ROSAT (Rosati et al. 1995).
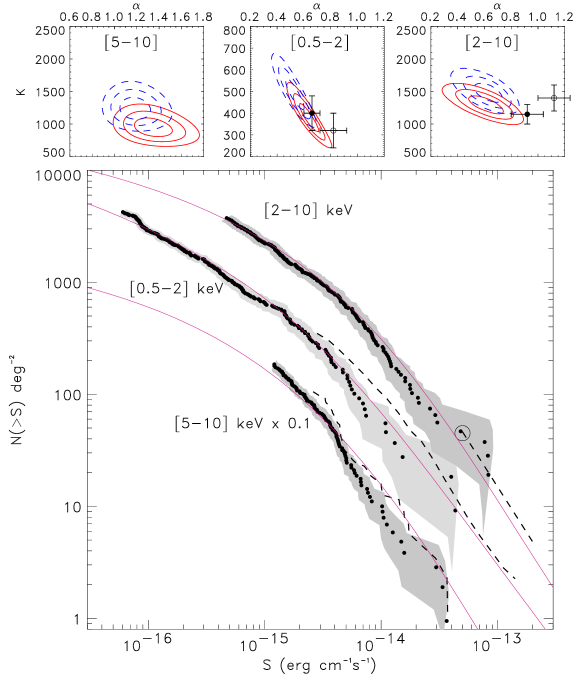
In Figure 2, we show the cumulative number counts in three bands: soft, hard and very hard (5–10 keV). The hard and soft counts now cover several orders of magnitude in flux, therefore a single power law is no longer a good fit. We perform a double power–law fit to the differential number counts with four parameters: faint–end normalization and slope, bright–end slope and flux where the break occurs. Likelihood contours for the faint end slope and normalization are shown at the top of Figure 2.
In the soft band, the Chandra data extend the results from previous surveys down to . We find the differential soft counts to be consistent with an euclidean slope at the bright end, and a slope (1 error) at the faint end, with a break at . Thus, below erg s-1 cm-2, the slope of the cumulative number count is (see top panels of Figure 2). The normalization, computed at erg s-1 cm-2, is , which is consistent with previous values found in Papers I and II.
The Log N–Log S distribution for sources in the hard band is extended down to a flux limit of erg s-1 cm-2 with the present data. As in Paper II, the hard counts are normalized at the bright end () with the ASCA data by Della Ceca et al. (1999). The best fit bright–end slope is consistent with an Euclidean slope, whereas the faint end has a slope of . The break occurs at and . This confirms a further flattening when compared with the 300 ks CDFS exposure (Paper II) and shallower Chandra fields (e.g. Stern et al. 2001a; Mushotzky et al. 2000; see the top panels in Figure 2).
In order to test the impact of cosmic variance in these relatively small fields (), we compare our faint number counts with those derived from the public CDFN data using our method of analysis (i.e. photon file processing, detection algorithm, etc.). The slope and normalization of the faint end are found to be consistent within two sigma level (see dashed contours in the top panels of Figure 2), whereas the CDFN counts at bright fluxes are significantly higher than in the CDFS. We find and at the faint end of the soft counts, and and at the faint end of the hard counts. Our best fit values for the CDFN Log N–Log S are in very good agreement with those recently published by Brandt et al. (2001b) with a completely different method of detection, calibration and sky coverage computation. This suggests that differences in number counts are not due to systematics in methods of analysis, but rather to field to field variations.
We compared our Log N–Log S with the predictions of the AGN population synthesis models described in Gilli, Salvati & Hasinger (2001). We consider their model B, where the number ratio between absorbed and unabsorbed AGNs is assumed to increase with redshift from 4, the value measured in the local Universe, to 10 at , where is unknown. This model was found to better describe observations with respect to a standard model where at all redshifts. The value of R is assumed to be independent of the luminosity, and therefore a large population of obscured QSOs is included in such a model. In this Paper, the parameters of the AGN X–ray luminosity functions assumed in the model B are renormalized to fit the background intensity measured by HEAO–1 ( in the 2–10 keV band). The predictions for the source counts (solid line in Figure 2) in the hard and soft bands are in very good agreement with the Chandra Log N–Log S at all fluxes.
The resolved fraction of the hard X–ray background, after including the bright end as observed by ASCA (Della Ceca et al. 1999), amounts to erg s-1 cm-2 deg-2. This value, which is computed down to the limiting flux of erg s-1 cm-2, has now reached, if not exceeded, the value of the total (unresolved) X–ray background erg s-1 cm-2 deg-2 measured by UHURU and HEAO–1 (Marshall et al. 1980). If we assume more recent measurements of the integrated background from ASCA surveys (Ishisaki et al. 1999; Ueda et al. 1999), the resolved fraction of the hard XRB is 80–90%. The BeppoSAX measurement (Vecchi et al. 1999; see Paper II) is likely too high to be accounted for by our number counts.
Field to field variations have also a non negligible impact on these measurements. For example, we have shown that the differences at the bright end, and to a lesser extent at the faint end, of the Log N–Log S in the CDFS and CDFN fields are likely an effect of cosmic variance. The total contribution to the XRB in the CDFN amounts to erg s-1 cm-2 deg-2, which is 8% higher than the CDFS value.
The existence of a fainter and progressively harder population of sources which are likely to fill the remaining fraction of the hard XRB is confirmed by the steep counts in the very hard band (5–10 keV), also plotted in Figure 2. A single power–law fit yields a slope of , with a normalization , somewhat lower than the value obtained with XMM observations of the Lockman Hole in the same band (Hasinger et al. 2001), and lower than the extrapolation of the bright 5–10 keV counts of the Hellas2XMM survey (Baldi et al. 2001). The best fit values in the CDFN are and . A double power law fit indicates a break at erg s-1 cm-2, but with large uncertainties on the slopes due to the smaller number of sources (110) and to the smaller flux range probed. The steeper slope with respect to the 2-10 keV number counts is mainly due to the hardening of the average spectrum at low fluxes. In fact, by running our detection algorithm in the 5–7 keV band alone, we find only 5 additional sources which are just below the detection threshold in the 2–7 or 0.5–7 keV bands. Forthcoming XMM observations of the CDFS will be crucial to investigate the nature of these sources which, in light of our first spectroscopic identifications, are expected to be strongly absorbed AGN, at relatively low redshift
It is also interesting to quote the contribution of all CDFS sources to the soft band, which we restrict to 1–2 keV to be compared with the measurement of the total flux measured by ROSAT, (see Hasinger et al. 1998). We find a resolved contribution of deg-2 for fluxes lower than erg s-1 cm-2, corresponding to % of the total value. When we include the integrated contribution of point–like sources at higher fluxes as measured by ROSAT, the total resolved contribution at fluxes larger than (our flux limit in the 1–2 keV band) adds up to deg-2, corresponding to 83% of the total value. In addition, X–ray clusters are known to contribute 6% of the ROSAT 1–2 keV background (10% in the 0.5–2 keV band, see Rosati et al. 1998). This sets an upper limit of % for the diffuse emission from warm gas. Incidentally, we note that we resolved completely the value found by ASCA (Gendreau et al. 1995), which, however, must be considered a lower limit to the 1–2 keV total background (see discussion in Hasinger et al. 1998).
3 Spectral properties, X–ray and optical colors
The cumulative spectral properties of the CDFS sample show an increasing hardness at fainter fluxes (Paper I and II; Brandt et al 2001b). The analysis of the stacked spectrum of the total sample (see Paper II for technical details) gives now an average photon index of (error at 90% confidence level) with in the 1–10 keV range, after fixing the absorbing column density to the Galactic value ( cm-2). The average spectrum is consistent with the shape of the total hard background , confirming previous findings. To quantify the progressive hardening of the spectral shape as a function of the hard flux, we divided the sample of sources which are detected in the hard band in 4 subsamples, defined in order to have roughly the same number of net source counts ( 3000): bright ( erg s-1 cm-2), medium ( erg s-1 cm-2), faint ( erg s-1 cm-2), and very faint ( erg s-1 cm-2, with only counts). The best fit slope of the stacked spectra is , , , and respectively. Incidentally, by assuming a varying as a function of the flux, we verify that the changes in the Log N–Log S are well within the quoted errors (less than 5%).
In Figure 3 we show the hardness ratio as a function of the luminosity in the 0.5–10 keV band for 83 sources for which we have optical spectra and secure classification (Szokoly et al. in preparation). The hardness ratio is defined as where and are the net count rates in the hard (2–7 keV) and the soft band (0.5–2 keV), respectively. The X–ray luminosities are not corrected for internal absorption and are computed in a critical universe with km s-1 Mpc-1. Different source types are clearly segregated in this plane. Type I AGNs (marked with circles) have luminosities between erg s-1 and erg s-1, with hardness ratios in a narrow range around . This corresponds to an effective , commonly found in Type I AGN. Type II AGN are skewed towards significantly higher hardness ratios (), with (absorbed) luminosities in the range erg s-1 . Note that the unabsorbed, intrinsic luminosities of Type II AGN would fall in the same range as that of Type I’s (see Gilli et al. in preparation). A subset of objects characterized by spectra of normal galaxies (marked with triangles) have very low luminosities ( erg s-1) and very soft spectra (several with ), as expected in the case of starbursts or thermal halos. However, a separate subset has harder spectra (), and luminosities larger than erg s-1. In these galaxies the X–ray emission is likely due to a mixture of low level AGN activity and a population of low mass X–ray binaries (see also Fiore et al. 2000; Barger et al. 2001). In Figure 3, we also include two Type II QSOs (asterisks), which are the most luminous sources in the HR–LX plane with HR. We discovered one in the CDFS itself (Norman et al. 2001); the second one was recently found by Stern et al. (2001b) in the Lynx field.
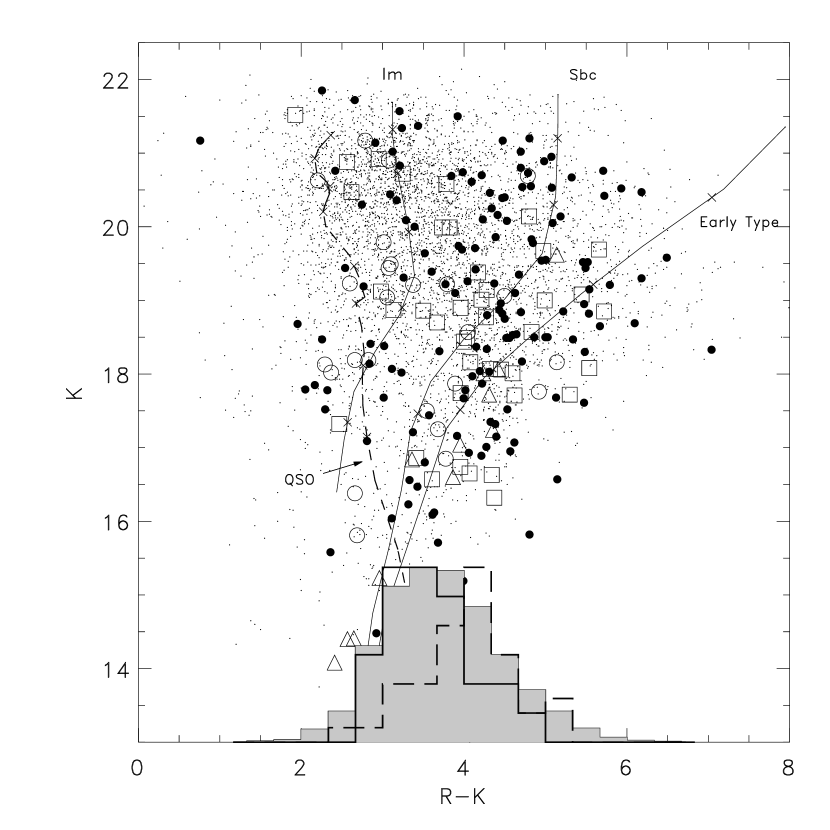
In Figure 4, we present a color-magnitude diagram, vs , for all CDFS sources with available photometry and optical counterparts. Vega magnitudes are derived from our survey with FORS–VLT (Program-ID 64.O-0621) and from the ESO Imaging Survey (EIS, Vandame et al. 2001; Arnouts et al. 2001). Optical spectral classification is used as in Figure 3. As a control sample, field galaxies are also shown. Type II sources are, on average, significantly redder than Type I sources and the overall field population, as expected in objects with dust and gas obscured AGN activity (e.g. Alexander et al. 2001). As a reference, on the same diagram we plot evolutionary tracks of an early and three late type galaxies using the template library of Coleman, Wu, Weedman (1980) (for E/S0, Sbc, Scd and Irr), whose spectral energy distributions (SEDs) have been extended to the near-IR and far UV using Bruzual &Charlot (2000) models. Magnitudes are normalized to the measured local value , no dust extinction is assumed. The QSO track was obtained using an empirical template from the Sloan Digital Sky Survey (Vanden Berk et al. 2001). The QSO SED was extended in the near IR using the Granato et al. (1997) models and normalized to .
The color-magnitude region spanned by the evolutionary tracks of galaxies ranging from late to early types encompasses most of the CDFS sources (with the exception of the bluest Type I objects which lie along the QSO track). Similarly, the template tracks in the vs plot in Figure 5 cover the color space of the optical counterparts of the CDFS source. This coverage becomes even more uniform if a range of dust extinctions is taken into account. This suggests that Type I and Type II AGN are hosted by a broad range of galaxy types. These findings are in agreement with the results of Schreier et al. (2001) and of Koekemoer et al. (2001) who found morphological types of CDFS sources to be uncorrelated with their hardness ratio from high-resolution HST imaging data.
4 Conclusions
In this Paper, we have reported the main results from the 1 Ms exposure of the Chandra Deep Field South, using the catalog of 346 sources presented by Giacconi et al. (2001). These observations reach a flux limit of in the 0.5–2 keV band, erg s-1 cm-2 in the 2–10 keV band (or in the 2–8 keV band), and in the 5–10 keV band.
The source number counts in the hard (2–10 keV) band show a significant flattening () below . The two deepest Chandra surveys, CDF South and North (Brandt et al. 2001b), have substantially resolved the hard XRB in individual sources, the main uncertainty now lying in the measurement of its total value. Nonetheless, we find the number counts at the hardest energies probed by Chandra (5–10 keV band) to be significantly steep (). Together with the evidence that the progressive steepening of the average X–ray spectrum of the faint population seems to continue at fluxes near or below our flux limit, this indicates that there is still a not negligible population of faint hard sources to be discovered with better sensitivity at high energies. Such sources are expected to generate the 30 keV bump in the XRB spectrum. XMM may play an important role in unveiling this population, if not affected by confusion.
We have shown that fluctuations in the number counts among different Chandra fields can be as large as at low fluxes and up to at bright fluxes (a more detailed analysis of this effect is presented in Tozzi et al. 2001b). These differences correspond to 1–2 Poissonian fluctuations (see top panels of Figure 2). Fluctuations of counts in excess of the Poisson noise are expected as a result of significant source clustering over scales comparable to the field size. By extrapolating the detected angular two–point correlation function for –ray sources (e.g., Vikhlinin et al. 1995; Giacconi et al. 2001) out to the typical scale of Chandra fields, we find the contribution of clustering to cosmic variance to be negligible.
Using optical identification and redshifts for a quarter of the total sample, our on–going spectroscopic observations indicate that the bulk of the obscured Type II AGN (with HR) lies at a median redshift (Paper II; see also Crawford et al. 2000; Barger et al. 2001). A stacked spectrum analysis of these sources reveals that they are characterized by an intrinsic absorption with , assuming a median redshift of . These sources are on average redder than the field galaxy population, however, they still span a portion in color–color diagrams which is covered by a broad range of host galaxy spectral types. The fact that Type II AGN may not be segregated just within one morphological class of galaxies is corroborated by HST/WFPC2 imaging of several of these sources (Koekemoer et al. 2001).
Even accounting for the incomplete spectroscopic identification of our sample, the redshift ditribution of sources is in stark contrast with AGN population synthesis models which predicts a peak at redshifts (e.g. Gilli, Salvati & Hasinger 2001). A similar distribution at low redshift has been observed in the Lockman Hole (Hasinger et al. 2001). Together with the evidence that the observed effective spectral slope of the faint X–ray population is harder than the model predictions (see Figure 8 in Paper II), this suggests that such models will have to be modified to incorporate different evolutionary scenarios (Gilli et al. in preparation).
A substantial fraction (11%) of the CDFS sources remain unidentified even in deep VLT optical images () or moderately deep near–IR imaging (a 15% fraction down to ). The hardness ratio distribution of these “blank” sources is similar to the overall distribution in the CDFS, making it difficult to comment on the nature of these sources with current data.
A great deal of spectroscopic work with 8–10m class telescopes, as well as deep multi-wavelength photometry to constrain redshifts and SEDs of the faintest population ( of the CDFS sources are fainter than ), will be needed to characterize the nature and the evolution of the AGN population. Scheduled mid–IR observations with SIRTF of the two Chandra Deep fields (the GOODS project, Dickinson et al. 2001) will play a prominent role in this study, by probing heavily obscured objects at virtually any redshift.
References
- (1) Alexander, D.M., Brandt, W.N., Hornschemeier, A.E., Garmire, G.P., Schneider, D.P., Bauer, F.E., & Griffiths, R.E. 2001, AJ in press, astro-ph/0107450
- (2) Arnouts et al. 2001, A&A submitted, astro-ph/0103071
- (3) Baldi, A., Molendi, S., Comastri, A., Fiore, F., Matt, G., & Vignali 2001, ApJ in press, astro-ph/0108514
- (4) Barger, A.J., Cowie, L.L., Mushotzky, R.F., Richards, E.A. 2001, AJ, 121, 662
- (5) Bautz, M., et al. 1998, in Proc. SPIE Vol. 3444, X–ray Optics, Instruments and Missions, eds. R.B. Hoover & A.B. Walker, 210
- (6) Brandt, W.N., et al. 2001a, AJ, 122, 1
- (7) Brandt, W.N., et al. 2001b, ApJ in press, astro-ph/0108404
- (8) Bruzual, G.A., & Charlot S. 1993, ApJ, 405, 538
- (9) Cagnoni, I., Della Ceca, R., & Maccacaro, T. 1998, ApJ, 493, 54
- (10) Coleman, G.D., Wu, C.C. & Weedman, D.W, 1980, ApJS, 43, 393
- (11) Comastri, A., Setti, G., Zamorani, G., & Hasinger, G. 1995 A& A, 296, 1
- (12) Crawford, C. S., Fabian, A. C., Gandhi, P.,Wilman, R. J., Johnstone, R. M. 2000, MNRAS, 324, 427
- (13) Della Ceca, R., Castelli, G., Braito, V., Cagnoni, I. & Maccacaro, T. 1999, ApJ, 524, 674
- (14) Dickinson, M., et al. 2001, AAS, 198, 250
- (15) Fabian. A. 1999, MNRAS, 308, L39
- (16) Fiore, F., La Franca, F. Vignali, C. Comastri, A., Matt, G., Perola, G.C., Cappi, M., Elvis, M., Nicastro, F. 2000, New Astr., 5, 143
- (17) Garmire, G.P., et al. 1992, ApJ, 399, 694
- (18) Gendreau, K.C., et al. 1995 Publ. Astron. Soc. Jpn. 47, L5-L9
- (19) Giacconi, R., Gurksy, H., Paolini, F.R., & Rossi, B.B., 1962, Phys. Rev. Letters, 9, 439
- (20) Giacconi, R., Rosati, P., Tozzi, P., et al. 2001a, ApJ, 551, 624 (Paper I)
- (21) Giacconi, et al. 2001b, ApJSup, submitted (Paper III)
- (22) Gilli, R., Salvati, M., & Hasinger, G. 2001, A&A, 366, 407
- (23) Granato G.L., Danese L., Franceschini A. 1997, ApJ, 486, 147
- (24) Hasinger, G., Burg, R., Giacconi, R., Schmidt, J., Truemper, J., & Zamorani, G. 1998, A&A 329, 482
- (25) Hasinger, G., et al. 2001a, A&A 365, L45
- (26) Hornschemeier, A.E., et al. 2000, ApJ, 541, 49
- (27) Hornschemeier, A.E., et al. 2001, ApJ, 554, 742
- (28) Ishisaki, Y., Makishima, K., Takahashi, T., Ueda, Y., Ogasaka, Y., & Inoue, H. 1999, ApJ submitted
- (29) Koekemoer, A.M., et al. 2001, ApJ, in press, astro-ph/0110385
- (30) Madau, P., Ghisellini G., & Fabian, A. C. 1993, ApJ, 410, L7
- (31) Marshall, F. et al. 1980, ApJ, 235, 4
- (32) Mushotzky, R.F., Cowie, L.L., Barger, A.J., & Arnaud, K.A. 2000, Nature, 404, 459
- (33) Norman, C., et al. 2001, ApJ submitted, astro-ph/0103198
- (34) Perri, M., Giommi, P., 2000, A&A, 362, L57
- (35) Rosati, P., Della Ceca, R., Burg, R., Norman, C., Giacconi, R. 1995, ApJ, 445, L11
- (36) Rosati, P., Della Ceca, R., Burg, R., Norman, C., Giacconi, R. 1998, ApJ, 492, L21
- (37) Schreier, E., et al. 2001, ApJ in press, astro-ph/0105271
- (38) Setti, G. & Woltjer, L. 1989, A&A, 224, L21
- (39) Stern et al. 2001a, AJ submitted
- (40) Stern et al. 2001b, ApJ submitted
- (41) Tozzi, P., et al. 2001, ApJ in press, astro-ph/0103014 (Paper II)
- (42) Tozzi, P., et al. 2001b, proceedings of “Tracing Large Scale Structures”,
- (43) Ueda, Y., et al. 1999, ApJ, 518, 656
- (44) Vandame et al. 2001, A&A submitted, astro-ph/0102300
- (45) Vanden Berk D. et al. 2001, AJ, 122, 549
- (46) Vecchi, A., Molendi, S., Guainazzi, M., Fiore, F., & Parmar, A.N. 1999, A&A, 349, 73
- (47) Vikhlinin, A., & Forman, W. 1995, ApJ, 455, L109