The Main Sequence Luminosity Function of Palomar 5 from HST111Based on observations with the NASA/ESA Hubble Space Telescope, obtained at the Space Telescope Science Institute, which is operated by AURA, Inc., under NASA contract NAS 5-26555.
Abstract
A low mass, large core radius, low central concentration, and strong tidal tails suggest that the globular cluster Palomar 5 has lost a large fraction of its initial mass over time. If the dynamical evolution of Palomar 5 has been dominated by the effects of mass loss, then theoretical arguments suggest that the luminosity function should be deficient in low-mass stars. Using deep WFPC2 F555W and F814W photometry, we determine the main sequence luminosity functions both near the cluster center and in a field near the half-light radius. A comparison of these luminosity functions yields no compelling evidence of mass segregation within the cluster, in accord with expectations for low-concentration clusters. On the other hand, a comparison of the global mass function of Palomar 5 with that of Cen and M55 indicates an increasing deficiency of stars with progressively lower masses. A fit of the observed luminosity function to theoretical models indicates a mass function for Palomar 5 of , which is notably more deficient in low-mass stars than other globular clusters that have been studied with HST. The flatness of the mass function is consistent with models of the dynamical evolution of globular clusters that have lost 90% of their original stellar mass. We suggest that, like NGC 6712, Pal 5 has lost a large percentage of its original stellar content as a result of tidal shocking.
1 Introduction
The halo of the Milky Way galaxy contains a number of globular clusters that have both very low mass and low central mass concentration. Included among such objects are the Palomar clusters identified by Abell (1955). Whereas much effort has been put into understanding the internal dynamics and evolution of more highly condensed systems, such as core-collapse clusters, the history of the lowest concentration globular clusters (, where and are the tidal and core radii) remains uncertain. The models of Chernoff & Weinberg (1990) suggest that low- systems experience considerable dynamical evolution and that they are very susceptible to tidal disruption. Consequently, clusters that presently have low concentration are considered to have evolved from higher concentration objects by the loss of a large fraction of their original mass.
Suggestive evidence that the Palomar-like clusters have lost a substantial fraction of their original mass comes from the finding by van den Bergh & Morbey (1984) that a number of these systems in the outer halo exhibit an anticorrelation between integrated magnitude and half-mass radius . Smith (1985) noted that this group of clusters follow a mass-radius relation of the form Such a relation would result if these clusters originally had similar masses and sizes, but lost different fractions of their original mass and expanded adiabatically as a consequence, according to the precepts of Hills (1980).
Pryor et al. (1991) argued that low- clusters lost much of their original stellar mass over extended periods of time through the evaporation and stripping of stars. Such star loss can be induced by an internal process such as two-body relaxation, and by the tidal shocking that occurs when clusters pass through the Galactic bulge or disk (Gnedin & Ostriker 1997; Gnedin, Lee, & Ostriker 1999). The effects of dynamical relaxation on the stellar mass function with respect to position within a globular cluster have been modeled by Pryor, Smith, & McClure (1986) and others. These models show that the slope of the mass function becomes flatter in the inner regions of a cluster as low-mass stars migrate outwards from the core. Any mechanism which removes stars from the outer regions of a cluster will consequently contribute to a preferential loss of low-mass stars. For example, the rate of evaporation of stars from a cluster due to two-body relaxation is greater for lower-mass stars (Spitzer 1987, Giersz & Heggie 1997). The models of Vesperini & Heggie (1997) show quantitatively the degree to which the stellar mass function of a globular cluster can be altered by such processes.
Pryor et al. (1991) suggested that observational verification of such a cluster mass-loss scenario could come from the main-sequence luminosity function, which should show a depletion in low-mass stars. They fitted the surface brightness and radial velocity profiles of the cluster NGC 5466 () with multi-mass King-Michie models having a sharp cut-off at the lower end of the mass function. Their best model fit to the NGC 5466 data had a global ratio of 1.0 and required a lower limit to the stellar mass function of 0.4 M⊙. Since the Palomar clusters have even lower masses and central concentrations than NGC 5466, such systems ought to provide a valuable testing ground for these models.
Palomar 5 is one of the most accessible examples of the low-mass, low- globular clusters in the Galactic halo. The deepest color-magnitude diagram (CMD) of Pal 5 is that of Smith et al. (1986), which is based on CTIO 4-m CCD data and extends to . The apparent distance modulus derived by these authors is , so that their CMD reaches to , or about 2.8 mag below the main-sequence turnoff. Below the MSLF derived from these data shows a deficiency of stars relative to that of M3. However, the Smith et al. (1986) data are not definitive on this point, since the turnover is only seen within one magnitude of the limit of their data, and so is subject to photometric errors and incompleteness uncertainties. To investigate the MSLF of Pal 5 to fainter limits we present in this paper the results of deep imaging obtained with the Wide Field/Planetary Camera 2 (WFPC2) on the Hubble Space Telescope (HST).
Our work is underscored by the recent discovery by Leon, Meylan, & Combes (2000), and Odenkirchen et al. (2001) (the latter using SLOAN Digital Sky Survey commissioning data) of strong, extensive tidal tails emanating from either side of Pal 5. This greatly strengthens the case for continued evaporation and stripping of stars, though it does not rule out expansion of the cluster during its formative period as a consequence of gas loss.
2 Observations and Photometry
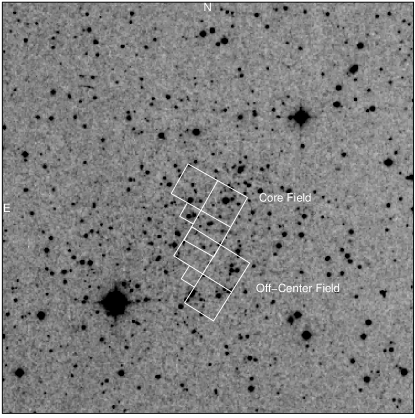
The WFPC2 images for this program were taken on 10 and 19 August 1999. The observations are summarized in Table 1. The two WFPC2 fields of view are shown overlaid on the Digital Sky Survey in Figure 1. The two fields were selected to sample both the core region and the half-mass radius of the cluster (henceforth referred to as the core and off-center fields). The core, half-mass, and tidal radii of Pal 5 are 2′.90, 2′.96, and 15′.9 respectively (Harris 1996),111The radii quoted are from the 1999 version of this catalog available at the web site http://physun.physics.mcmaster.ca/Globular.html. giving the cluster a central concentration of . One field was placed on the cluster center at RA(2000) = 15:16:04.1, dec(2000) = 00:06:45, while the second field was situated 2′ 20′′ south of the cluster center. The off-center field is located just within the half-mass radius, and well within the tidal radius. Given the relatively low surface density of stars in Pal 5, we opted not to stray too far from the cluster center to be certain that we would detect a sufficient number of stars to produce a statistically robust luminosity function. Two 1200s and two 1300s exposures were taken in the F814W () bandpass, while the F555W () images comprise four 1300s exposures in each field.
| Field | RA(2000) | Dec(2000) | Filter | Exp time (s) | Date | Dataset |
|---|---|---|---|---|---|---|
| Pal 5 center | 15 16 04.18 | 00 06 45.4 | F814W | 1200 | 10 Aug 1999 | U4ZL0101R |
| Pal 5 center | 15 16 04.18 | 00 06 45.4 | F814W | 1200 | 10 Aug 1999 | U4ZL0102R |
| Pal 5 center | 15 16 04.14 | 00 06 45.2 | F814W | 1300 | 10 Aug 1999 | U4ZL0103R |
| Pal 5 center | 15 16 04.14 | 00 06 45.2 | F814W | 1300 | 10 Aug 1999 | U4ZL0104R |
| Pal 5 center | 15 16 04.18 | 00 06 45.4 | F555W | 1300 | 10 Aug 1999 | U4ZL0105N |
| Pal 5 center | 15 16 04.18 | 00 06 45.4 | F555W | 1300 | 10 Aug 1999 | U4ZL0106R |
| Pal 5 center | 15 16 04.14 | 00 06 45.2 | F555W | 1300 | 10 Aug 1999 | U4ZL0107R |
| Pal 5 center | 15 16 04.14 | 00 06 45.2 | F555W | 1300 | 10 Aug 1999 | U4ZL0108R |
| Pal 5 off-center | 15 16 04.19 | 00 09 05.0 | F814W | 1200 | 19 Aug 1999 | U4ZL0201R |
| Pal 5 off-center | 15 16 04.19 | 00 09 05.0 | F814W | 1200 | 19 Aug 1999 | U4ZL0202R |
| Pal 5 off-center | 15 16 04.15 | 00 09 04.9 | F814W | 1300 | 19 Aug 1999 | U4ZL0203R |
| Pal 5 off-center | 15 16 04.15 | 00 09 04.9 | F814W | 1300 | 19 Aug 1999 | U4ZL0204R |
| Pal 5 off-center | 15 16 04.19 | 00 09 05.0 | F555W | 1300 | 19 Aug 1999 | U4ZL0205R |
| Pal 5 off-center | 15 16 04.19 | 00 09 05.0 | F555W | 1300 | 19 Aug 1999 | U4ZL0206R |
| Pal 5 off-center | 15 16 04.15 | 00 09 04.9 | F555W | 1300 | 19 Aug 1999 | U4ZL0207R |
| Pal 5 off-center | 15 16 04.15 | 00 09 04.9 | F555W | 1300 | 19 Aug 1999 | U4ZL0208R |
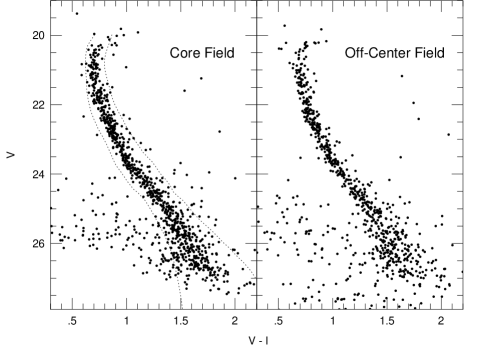
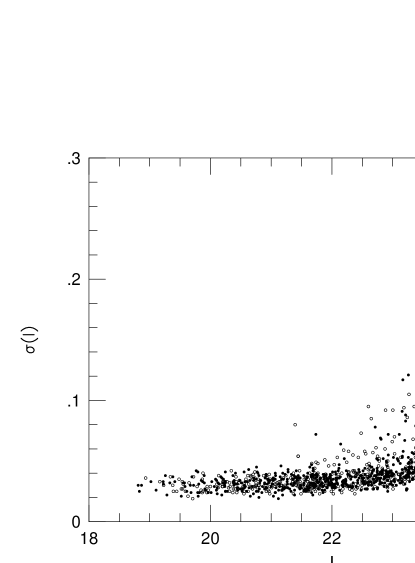
Photometry was carried out using the DAOPHOT II/ALLFRAME suite of PSF-fitting routines (Stetson 1987; Stetson 1994). For each cluster field, all eight WFPC2 frames were processed individually using DAOPHOT II/ALLSTAR, and simultaneously using ALLFRAME. Small regions of each frame surrounding obviously extended background objects were excised from the final star list. The F555W and F814W magnitudes were transformed to and using the prescription of Holtzman et al. (1995). A combined total of stars were detected and measured down to a limiting magnitude of in the two fields. The versus color-magnitude diagrams for the central and off-center fields are shown in Figures 2a and 2b, respectively. The formal errors in the derived magnitudes, , as calculated by DAOPHOT II/ALLSTAR, are plotted versus in Figure 3 for the stars found in both the core and off-center fields.
Completeness corrections were determined by adding to the original WFPC2 frames 300 artificial stars at each of nine different magnitudes from to . The colors of the artificial stars were selected to follow the locus of main sequence stars, and were identical for the core and off-center fields. The frames were then processed using DAOPHOT II and ALLFRAME in a manner identical to that applied to the original data (including the exclusion of regions surrounding extended objects). The resulting completeness fractions are plotted in Figure 4. Owing to the very low central surface density of stars in this cluster, the completeness fractions in the core and off-center fields behave almost identically. Interestingly, the largest deviations from the mean completeness curve occur, for both core and halo fields, in the WF3 chip, which shows systematically lower completeness fractions at all magnitudes. However, the difference amounts to only 0.2 magnitudes, and while we correct our luminosity functions using the completeness fractions appropriate to each detector, we have not investigated the source of this difference any further. Our limiting magnitude, taken to be where the completeness fraction drops below 0.5, occurs just brightward of ().

3 The Color-Magnitude Diagram and Luminosity Function
The main sequences shown in Figures 2a and 2b are well sampled in both fields and appear in most respects to be identical. There are a number of faint blue objects with and in both the central and off-center fields. There are comparable numbers of such objects in both the core and off-center fields. Visual examination of the WFPC2 frames reveals extended galaxies in both fields, with a somewhat higher surface density of obviously extended objects in the core field. On the other hand, a large number of the blue objects in the off-center field are so faint as to prevent unambiguous identification as background galaxies. Since the crowding and completeness in the two fields is almost identical, it is possible that we are seeing variations in the mean color and morphology of background galaxies over the region spanned by the two fields.
In order to avoid contaminating our sample with blue background objects and to measure only the stellar luminosity function (LF) of Pal 5, we adopted the hand-drawn, main sequence envelope shown in Figure 2. All objects within this envelope are considered to be main sequence stars. For the region of the CMD within this envelope and to (the limit of our completeness computations) the observed luminosity functions in the and bands are given in Table 2 for both the central and off-center fields, together with corrections for completeness. The completeness-corrected luminosity functions are shown in Figure 5. We have transformed to absolute magnitudes using a distance to Pal 5 of 23.2 kpc and E(B-V) = 0.03 (from the McMaster globular cluster database). Also shown is the main sequence LF (MSLF) of Cen (), as derived from extensive WFPC2 observations by De Marchi (1999), and the MSLF of M55 () given by Paresce & De Marchi (2000). Of the globular clusters for which MSLFs have been observed using HST, these are among the most relevant for comparison with Pal 5 because of their relatively low central mass concentrations.
| NaaObserved number of stars | NCbbNumber counts corrected for incompletness | NaaObserved number of stars | NCbbNumber counts corrected for incompletness | |
|---|---|---|---|---|
| Core | Off-Center | |||
| 20.00 | 2 | 2.1 | 4 | 4.3 |
| 20.50 | 20 | 21.0 | 14 | 15.2 |
| 21.00 | 39 | 40.9 | 24 | 26.0 |
| 21.50 | 36 | 37.7 | 33 | 35.3 |
| 22.00 | 41 | 43.0 | 37 | 40.2 |
| 22.50 | 63 | 66.0 | 57 | 61.6 |
| 23.00 | 58 | 60.9 | 37 | 39.8 |
| 23.50 | 47 | 49.5 | 47 | 50.6 |
| 24.00 | 68 | 72.2 | 34 | 36.7 |
| 24.50 | 61 | 64.7 | 51 | 54.9 |
| 25.00 | 61 | 64.7 | 49 | 53.1 |
| 25.50 | 78 | 82.9 | 51 | 55.5 |
| 26.00 | 85 | 92.1 | 67 | 75.7 |
| 26.50 | 87 | 112.5 | 58 | 81.5 |
| 27.00 | 33 | 65.9 | 35 | 84.9 |
| NaaObserved number of stars | NCbbNumber counts corrected for incompletness | NaaObserved number of stars | NCbbNumber counts corrected for incompletness | |
|---|---|---|---|---|
| Core | Off-Center | |||
| 19.33 | 4 | 4.2 | 7 | 7.5 |
| 19.83 | 18 | 18.9 | 11 | 12.0 |
| 20.33 | 42 | 44.1 | 27 | 29.2 |
| 20.83 | 43 | 45.1 | 35 | 37.6 |
| 21.33 | 44 | 46.1 | 44 | 47.7 |
| 21.83 | 83 | 87.0 | 61 | 65.8 |
| 22.33 | 53 | 55.6 | 46 | 49.5 |
| 22.83 | 88 | 93.3 | 58 | 62.6 |
| 23.33 | 87 | 92.1 | 64 | 68.9 |
| 23.83 | 72 | 76.6 | 60 | 65.5 |
| 24.33 | 112 | 120.4 | 81 | 89.9 |
| 24.83 | 104 | 137.7 | 70 | 98.3 |
| 25.33 | 32 | 67.4 | 34 | 80.9 |
The Pal 5 LF appears somewhat “bumpier” than that of Cen, and although it is tempting to attribute this to counting limitations for the less populous Pal 5, it is noteworthy that, fainter than , the same peaks and troughs are evident in both the core and off-center fields (though perhaps more exaggerated in the core field), lending apparent weight to their significance.
A feature in the MSLF of Pal 5 not observed in the other clusters is a drop in the counts at . How robust is this feature? Based purely on Poisson statistics, the completeness calculations in our faintest bin are accurate to about 20%. Thus, we cannot rule out a mere leveling off of the counts in the off-center field, though the drop in the core field is more significant at about the level. Of course, this neglects possible systematic effects which are not properly reflected in the completeness calculations, or in the exclusion of background stars from the counts. It remains for deeper data to substantiate a faint turnover in the LF of Pal 5.
Irrespective of the faintest magnitude bin in the Pal 5 WFPC2 data, the LF slopes in the region (which is common to all data sets) are significantly shallower for Pal 5 than they are for Cen and M 55. Least-squares fits to the data in this region yield and for M 55 and Cen, respectively. For Pal 5 we obtain and for the core and off-center fields, respectively. Thus it appears that Pal 5 is deficient in faint main sequence stars compared to M55 and Cen.222This conclusion is unlikely to alter even if the observed LF could be corrected for any background sources that fall within the Pal 5 main-sequence region. Due to limitations on telescope time we did not request WFPC2 images of a nearby background region that would have enabled such a correction. Background objects might be expected to increase in number with increasing , so if the LF in Fig. 5 were to be corrected for background sources, we would expect the slope of the Pal 5 LF to be even shallower than noted in the text. This difference could be the result of dynamical evolution, differences in the extent of mass segregation in these clusters, or it might reflect a difference between the initial mass function (IMF) of Pal 5 and the other two clusters.
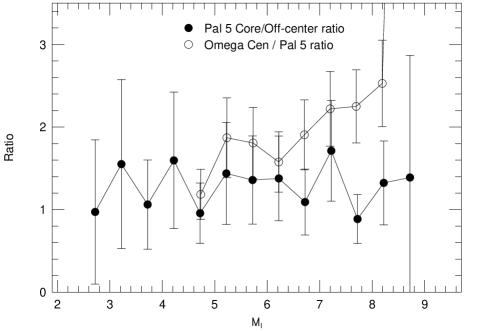
Figure 6 shows the ratio in the number of stars per 0.5 magnitude bin in the Pal 5 core field to the number in the off-center field. There is no trend apparent in this ratio and we conclude that the two MSLFs are identical to within the uncertainties. Also shown is the ratio of the surface density of stars in the outer Cen field of De Marchi (1999) to that of our core and off-center Pal 5 fields combined. This ratio evidently increases progressively to the limits of the data, consistent with the differences in LF slopes noted above, and graphically illustrates the apparent depletion of faint stars in Pal 5.
The WFPC2 data go considerably fainter than the color-magnitude diagram of Smith et al. (1986). Whereas their ground-based data indicated a possible turn down in the LF at , this is not seen in the WFPC2 data, which extends much fainter, and we conclude that the former is a consequence of incompleteness and/or other observational effects in the Smith et al. (1986) data. This further cautions against over-interpretation of the apparent drop off in the MSLF observed at the limit of the WFPC2 data.
4 Discussion
The most immediate conclusions of this paper are that the MSLF of Pal 5 is reasonably well populated down to the limit of the photometry, and that there is very little evidence for mass differentiation between the core of the cluster and the half-mass radius. This second result is in accord with the computations of Pryor et al. (1986). Figure 1 of their paper shows that in multi-mass King-Michie models for clusters with concentrations as low as there is negligible variation in the local mass function within the core radius (which for such low- clusters is close to the half-mass radius). Only beyond the half-mass radius do the models of Pryor et al. (1986) for exhibit a steepening of the mass function due to the migration of low-mass stars from the core to the outer regions, but even here the effect is estimated to be small. Within clusters having the Pryor et al. (1986) models therefore indicate that the effects of mass segregation are small, and so the observed similarity between the MSLFs in the central and half-mass region of Pal 5 seems in accord with the models.333For clusters with mass segregation becomes more important, and the King-Michie models show that this can cause a very measurable steepening of the luminosity function beyond the core radius, while in the most condensed clusters the central mass function can be depopulated to such an extent as to cause a turn-down in the apparent mass function. Note however that the Pryor et al. (1986) models do not incorporate the effects of tidal shocking, which may be very important for Pal 5, as discussed below.
There is no obvious truncation to the Pal 5 MSLF, i.e., no sharp cutoff in the mass function, in the luminosity range covered by the WFPC2 data. The models of Pryor et al. (1991) found that a mass function truncated sharply at M⊙ best fitted their radial velocity data for the cluster NGC 5466. The WFPC2 Pal 5 data go about 1 mag fainter than this mass limit. A relationship between main-sequence star mass and absolute magnitude applicable to Pal 5 is plotted in Figure 7 from models of Bergbusch & VandenBerg (1992) for stellar parameters [Fe/H] = , [O/Fe] = , , and an age of 16 Gyr. This is close to the metallicity of Pal 5. A Baraffe et al. (1997) model for [M/H] = , [Fe/H] = , [O/Fe] = , and an age of 10 Gyr is also shown. An apparent distance modulus of (from the Harris 1999 tabulation) is adopted for Pal 5. The limit of the WFPC2 photometry at () then corresponds to a stellar mass of 0.28 M⊙, while a mass of 0.4 M⊙ corresponds to (). The data show no evidence for a sharp truncation in the mass function of Pal 5 down to a stellar mass of M⊙, although as noted above there is a turn-over of uncertain significance at the faintest limits of the WFPC2 data.

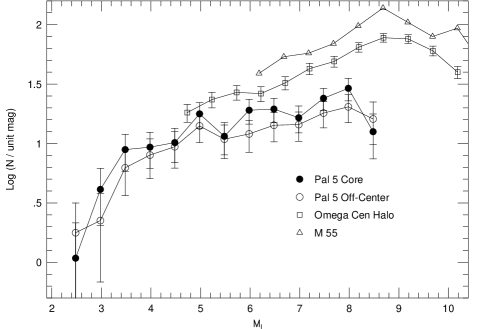
The combined -band luminosity function for the sum of the core plus off-center fields in Pal 5 is shown in Figure 8. These data can be compared to model LFs from Bergbusch & VandenBerg (1992), which are based on a power-law mass spectrum of the form . Their extensive grid gives values of , where is the relative number of stars in the magnitude range to , computed for a range of stellar compositions, ages, and values of the exponent . As with Fig. 7, their models for [Fe/H] = and an age of 16 Gyr are shown. If their 14 Gyr models were adopted instead this would change in the models by 0.05 at for , with smaller changes for steeper mass functions. The model LFs for and 0.5 are plotted as solid lines in Figure 8 superimposed on the observed data. The theoretical LFs are normalized by Bergbusch & VandenBerg to a value of in a 0.2 mag bin centered on . This is brighter than the magnitude range covered by the WFPC2, and so to compare the models with the observational data the latter have been normalized to a value of in the 0.5 mag bin centered at . This normalized version of the Pal 5 LF is related to the actual numbers of stars counted in the WFPC2 frames via the equation , where is the completeness-corrected number of stars in the two Pal 5 fields per 0.5 mag bin.

We have also computed a model MSLF using the mass- relation of Baraffe et al. (1997) for [M/H] = -1.0, [Fe/H] = , [O/Fe] = , and an age of 10 Gyr. A spline fit was made to their relation with mass as the dependent variable, then for 0.1 magnitude steps in the value of the stellar mass was computed. In the case of the above power-law mass spectrum, the number of stars with masses between and is . Using this relation, the number of stars were computed per 0.2 mag bin for an exponent of normalized at to the model of Bergbusch & VandenBerg (1992) in Fig. 8 for the same exponent. The resultant model LF is shown as a dashed line in Fig. 8. Although the Baraffe et al. (1997) model gives a somewhat different MSLF than that of Bergbusch & VandenBerg (1992) (as one might expect from the differences in the mass-magnitude relation in Fig. 7), both sets of model LFs indicate that the current stellar mass function of Pal 5 is quite flat, with a value of .
Piotto & Zoccali (1999) find that the current values of for globular clusters studied with WFPC2 range from 0.3 to (where the Salpeter mass function has a value of ). The current mass function that we derive for Pal 5 is therefore amongst the flattest found to date in a globular cluster. Piotto & Zoccali (1999) showed that for the clusters in their sample the exponent correlates with the relaxation time and the cluster disruption timescale. One interpretation of this trend is that differences in among globular clusters are due to differences in the degree of dynamical evolution (Piotto, Cool, & King 1997; Piotto & Zoccali 1999). In this respect, the mass function of Pal 5 is in accord with the suggestion that, at least for this cluster, the low concentration is a consequence of the dynamical evolution and mass loss predicted by the models of Chernoff & Weinberg (1990).
The loss of mass, both in the form of gas expelled from individual stars, and the escape of stars themselves from a cluster, accompanies dynamical evolution. Vesperini & Heggie (1997) have modeled the evolution of the stellar mass function of globular clusters as they evolve dynamically and lose mass by stellar evolution, evaporation of stars due to two-body relaxation, and the effects of Galactic disk shocking. They find that dynamical evolution will transform an initial stellar mass function having into a mass function with by removing some 90% of the original mass. Thus if Pal 5 started out with an initial mass function similar to the Salpeter function these models suggest that its mass is now only the original mass. The relatively low value of for Pal 5 suggests that it has lost a larger percentage of its initial mass than the clusters included in the study of Piotto & Zoccali (1999). In the context of the models of Chernoff & Weinberg (1990) and Vesperini & Heggie (1997), it seems reasonable to attribute the low overall mass and low concentration of Pal 5 to evolutionary processes accompanied by mass loss. The total absolute magnitude of Pal 5 is , which suggests a mass of M⊙ for a ratio of 1. Pal 5 may have evolved from a cluster whose initial mass was M⊙.
One globular cluster which provides an interesting comparison with Pal 5 is NGC 6712. This system is more metal-rich than Pal 5 ([Fe/H] = versus according to the 1999 McMaster catalog), and much closer to the Galactic plane ( versus 16.7 kpc for Pal 5). The current position of NGC 6712 places it 3.5 kpc from the Galactic Center versus 18.6 kpc for Pal 5. The -component of the space motion of NGC 6712 was found by Cudworth (1988) to be km/s, indicative of halo membership. NGC 6712 has a similar central mass concentration () to Pal 5, but a higher mass ( versus ), and a central luminosity density /pc3 times that of Pal 5. Deep main-sequence luminosity and mass functions have been derived from VLT imaging by Andreuzzi et al. (2001) and De Marchi et al. (1999). Despite a greater mass, NGC 6712 has a main sequence mass function that is even more extreme than that of Pal 5, and is actually inverted, so that the number of stars per unit magnitude decrease to fainter magnitudes, even at the half-mass radius.
De Marchi et al. (1999) attributed the depleted MSLF of NGC 6712 to the loss of low-mass stars from the cluster as a result of tidal stripping. As described by Gnedin & Ostriker (1997) and Gnedin, Lee, & Ostriker (1999), key mechanisms which influence the rate at which stars are lost from globular clusters are internal two-body relaxation, and tidal shocking accompanying close passages to the Galactic bulge and disk. The first of these mechanisms acts in all globular clusters, but the second is very sensitive to the orbit of a cluster within the Galaxy. The energy input into a globular cluster from tidal shocking due to Galactic bulge encounters is dependent on the perigalactic distance of the cluster. The perigalacticon of NGC 6712 is quite small, 0.9 kpc (Dinescu et al. 1999), which lead De Marchi et al. (1999) to argue that bulge shocking was the main cause of the depletion of low-mass stars from the cluster. Could such a mechanism also be responsible for the depleted main sequence luminosity function of Pal 5?
The orbits of both Pal 5 and NGC 6712 within the Galaxy have been studied by Dinescu, Girard, & van Alterna (1999) and Odenkirchen et al. (2001). Using the measured space motion of Pal 5, Dinescu et al. (1999) calculated that this cluster is an orbit of eccentricity and a perigalacticon of 2.3 kpc. Thus even though Pal 5 is currently situated at relatively large distances from the Galactic Center and above the Galactic plane, the orbit is such that close encounters with the Galactic bulge could be important. In fact, Dinescu et al. (1999) find that in the case of both Pal 5 and NGC 6712 tidal shocking has a greater influence on cluster evaporation than does two-body relaxation. By contrast, Odenkirchen et al. (2001) find from modeling of the morphology of the tidal tails of Pal 5 that the perigalactic distance is a much less extreme 7 kpc, but they do calculate that Pal 5 has made three passages through the disk of the Galaxy over the past 500 Myr, two of which occurred at Galactocentric radii of 8-9 kpc. Thus disk shocking may have been a major contributor to mass loss from Pal 5. The tidal tails contain the number of stars as the cluster itself, indicating that whatever the mechanism responsible for these tails, it continues to remove a considerable amount of mass from the cluster.
Despite their current differences in total mass, it is possible that both Pal 5 and NGC 6712 have lost a large fraction of their initial mass due to tidal shocking induced either by bulge or disk encounters. We speculate that NGC 6712 originally began as a more massive cluster than Pal 5, but because it has evolved in an orbit passing closer to the Galactic bulge, it has been subjected to more extreme tidal shocking and concomitant stripping. NGC 6712 has perhaps lost a greater fraction of it’s original mass than Pal 5, but remains more massive than Pal 5 today simply because it had a much larger mass to begin with.
Calculations of the disruption time of the “current” version of Pal 5 have been made by both Gnedin & Ostriker (1997) and Dinescu et al. (1999), though their results differ substantially. Based on the Galactic orbit derived from the observed space motion, Dinescu et al. (1999) computed a disruption time of only 0.1 Gyr. Gnedin & Ostriker (1997) adopted a more statistical formalism for treating cluster orbits and derived disruption times of 1 Gyr and 50 Gyr according to two different Galactic mass models. Hence, while there remains considerable uncertainty, these calculations are entirely consistent with the idea that tidal shocking and stripping played a major role in depleting mass function of Pal 5
The above arguments suggest that mass loss may have been an important factor in determining particularly the low-mass end of the Milky Way globular cluster mass function (GCMF). Theoretical models by Vesperini (1998) demonstrate this point, showing that even an initial power-law GCMF can be turned into a log-normal mass function as a consequence of dynamical evolution and cluster mass loss. If so, flat or declining stellar luminosity functions such as those of Pal 5 and NGC 6712 should be expected among other clusters which populate the faint end of the Milky Way GCMF. This would include systems such as Pal 13 (Siegel et al. 2001) and E3 (van den Bergh, Demers, & Kunkel 1980), whose depleted giant branches, low total mass and concentration, and high specific frequency of blue straggler stars and binaries are all consistent with the preferential loss of lower-mass stars. The main sequence luminosity function of E3 derived from deep ground-based images does indeed decline towards faint magnitudes (McClure et al. 1985) in a way that recalls NGC 6712. As our knowledge of the orbital kinematics of Glactic globular clusters grows, understanding the causes and effects of stellar mass loss in globular clusters may well have important consequences for our understanding of the structure and formation of both our Galaxy and other galaxies with globular cluster systems. In the meantime, constraining the models will clearly benefit from a larger sample of HST-quality LFs of the lower-mass Milky Way globulars.
References
- (1)
- (2) Abell, G. O. 1955, PASP, 67, 258
- (3)
- (4) Andreuzzi, G., De Marchi, G., Ferraro, F. R., Pulone, L., Buonanno, R., & Ferraro, F. R. 2001, A&A, 372, 851 1
- (5) Baraffe, I., Chabrier, G., Allard, F., & Hauschildt, P. H. 1997, A&A, 327, 1054
- (6)
- (7) Bergbusch, P. A., & VandenBerg, D. A. 1992, ApJS, 81, 163
- (8)
- (9) Chernoff, D. & Weinberg, M. 1990, ApJ, 351, 121
- (10)
- (11) Cudworth, K. M. 1988, AJ, 96, 105
- (12)
- (13) De Marchi, G. 1999, AJ, 117, 303
- (14)
- (15) De Marchi, G., Leibundgut, B., Paresce, F., & Pulone, L. 1999, A&A, 343, L9
- (16)
- (17) Dinescu, D. I., Girard, T. M., & van Alterna, W. F. 1999, AJ, 117, 1792
- (18)
- (19) Giersz, M., & Heggie, D. C. 1997, MNRAS, 286, 709
- (20)
- (21) Gnedin, O. Y., & Ostriker, J. P. 1997, ApJ, 474, 233
- (22)
- (23) Gnedin, O. Y., Lee, H. M., & Ostriker, J. P. 1999, ApJ, 522, 935
- (24)
- (25) Hills 1980, ApJ, 235, 986
- (26)
- (27) Harris, W. E. 1996, AJ, 112, 1487
- (28)
- (29) Holtzman, J.A., Burrows, C.J., Casertano, S., Hester, J.J., Trauger, J.T., Watson, A.M., & Worthey, G. 1995, PASP, 107, 1065
- (30)
- (31) Leon, S., Meylan, G., & Combes, F. 2000, A&A, 359, 907
- (32)
- (33) McClure, R. D., Hesser, J. E., Stetson, P. B., & Stryker, L. L. 1985, PASP, 97, 665
- (34)
- (35) Odenkirchen, M. et al. 2001, ApJ, 548, L165
- (36)
- (37) Paresce, F., & De Marchi, G. 2000, ApJ, 534, 870
- (38)
- (39) Peterson, C. 1993, in Structure and Dynamics of Globular Clusters, p. 373, S. Djorgovski & G. Meylan (eds.), ASPCS vol. 50
- (40)
- (41) Paresce, F., & De Marchi, G. 2000, ApJ, 534, 870
- (42)
- (43) Piotto, G., Cool, A. M., & King, I. R. 1997, AJ, 113, 1345
- (44)
- (45) Piotto, G., & Zoccali, M. 1999, A&A, 345, 485
- (46)
- (47) Pryor, C., Smith, G. H. & McClure, R. D. 1986, AJ, 92, 1358
- (48)
- (49) Pryor, C., McClure, R. D., Fletcher, J. M., & Hesser, J. E. 1991, AJ, 102, 1026
- (50)
- (51) Siegel, M. H., Majewski, S. R., Cudworth, K. M., & Takamiya, M. 2001, AJ, 121, 935
- (52)
- (53) Smith, G. H. 1985, ApJ, 298, 249
- (54)
- (55) Smith, G. H., McClure, R. D., Stetson, P. B., Hesser, J. E., & Bell, R. A. 1986, AJ, 91, 842
- (56)
- (57) Spitzer, L. 1987, Dynamical Evolution of Globular Clusters, Princeton Univ. Press; Princeton NJ.
- (58)
- (59) Stetson, P. 1987, PASP, 99, 191
- (60)
- (61) Stetson, P. B. 1994, PASP, 106, 250
- (62)
- (63) van den Bergh, S., Demers, S., & Kunkel, W. E. 1980, ApJ, 239, 112
- (64)
- (65) van den Bergh, S., & Morbey, C. L. 1984, A Expr, 1, 1
- (66)
- (67) Vesperini, E. 1998, MNRAS, 299, 1019
- (68)
- (69) Vesperini, E., & Heggie, D. C. 1997, MNRAS, 289, 898
- (70)