The Transformation of Galaxies within the Large Scale Structure around a Cluster 11affiliation: Based on data collected at Subaru Telescope, which is operated by the National Astronomical Observatory of Japan.
Abstract
We present deep, panoramic multi-color imaging of the distant rich cluster A 851 (Cl 0939+4713, ) using Suprime-Cam on Subaru. These images cover a 27′ field of view, Mpc at , and by exploiting photometric redshifts estimated from our imaging we can isolate galaxies in a narrow redshift slice at the cluster redshift. Using a sample of probable cluster members brighter than , we trace the network of filaments and subclumps around the cluster core. The depth of our observations, combined with the identification of filamentary structure, gives us an unprecedented opportunity to test the influence of the environment on the properties of low luminosity galaxies. We find an abrupt change in the colors of galaxies at a local density of 100 gal. Mpc-2, with the population in lower density regions being predominantly blue, while those in higher density regions are red. The transition in the color-local density behavior occurs at densities corresponding to subclumps within the filaments surrounding the cluster. Identifying the sites where the transition occurs brings us much closer to understanding the mechanisms which are responsible for establishing the present-day relationship between environment and galaxy characteristics.
Subject headings:
cosmology: observations — galaxies: clusters: individual (A 851, Cl 0939+4713) — galaxies: evolution1. Introduction
Clusters of galaxies are a very visible constituent of the structure of the Universe at the present-day. Redshift surveys of the local Universe, , illustrate the filamentary nature of large scale structure (e.g. Peacock et al. 2001), and the presence of clusters at the intersections of these filaments and walls. N-body simulations have been particularly successful in reproducing these filamentary features, showing that they are a natural consequence of gravitationally-driven structure formation (e.g. Moore et al. 1998). The precursors of the filaments should be present around distant clusters, containing many of the galaxies which will subsequently infall onto the virialized core and form the cluster population we see today.
The influence of environment on the star formation histories of the galaxies is a critical question for models of galaxy evolution. The striking variation in the stellar populations of galaxies in different environments (e.g. Larson, Tinsley & Caldwell 1980; Butcher & Oemler 1984; Balogh et al. 1999; Norberg et al. 2001) clearly indicates the importance of such environmental influences on star formation. Since clusters (which are dominated by passive galaxy populations) are continuously growing through the accretion of galaxies and groups from the field, which is dominated by actively star-forming galaxies, this activity must be quenched during the assimilation of the galaxies into the cluster. This transformation is a key process in creating the environmental dependence of galaxy properties, and may also underpin the observed evolution of galaxy properties in distant clusters (e.g. Butcher & Oemler 1984; Kodama & Bower 2001). However, the physical mechanism which is responsible for these changes has not yet been identified (Moore et al. 1996; Abadi et al. 1999; Balogh et al. 2000). Recent studies have begun to focus on tracing the variation of galaxy properties from the cores of clusters, out to the surrounding field in an attempt to identify the environment where the decline in the star formation in accreted galaxies begins (e.g. Abraham, et al. 1996; Balogh et al. 1999; Pimbblet et al. 2001).
The advent of Suprime-Cam, a revolutionary wide-field camera on the Subaru telescope, has provided an unique new tool to tackle programs requiring deep, high quality imaging across large fields. In this Letter, we analyze unique deep, panoramic, multi-color imaging of the cluster A 851. We estimate photometric redshifts for galaxies across the field and isolate a narrow redshift slice around the cluster. Our two-dimensional map covers Mpc, over a much wider field of view than the previous studies (e.g. Iye et al. 2000), allowing us to identify a wealth of filamentary structures extending from the cluster core. We use the depth and wide range in environment spanned by our observations, over two orders of magnitude in galaxy surface density, to investigate the dependence of faint galaxy properties on local environment.
§2 describes the observations and reduction, §3 details the analysis of our photometric catalog and discusses our results, while §4 gives our main conclusions. We adopt km s-1 Mpc-1 and a cosmology.
2. Observations, Reduction and Analysis
2.1. Observations and Reduction
We obtained deep, multi-band imaging of the rich cluster A 851 (Cl 0939+4713), using the optical mosaic camera, Suprime-Cam, on the 8.3-m Subaru Telescope, Mauna Kea, Hawaii. These observations were undertaken on 2001 January 21–22 as a common-user program during the first semester of telescope operations. The weather conditions were good and photometric during the observations. Total exposure times of 3.6, 2.2, 4.0 and 1.3 ks were obtained in respectively, with seeing measured off the stacked frames of 1.1, 0.7, 1.0, 0.7′′. These frames have 5- limiting magnitudes of , , and , sufficient to detect a passively evolving early-type galaxy as faint as at in all passbands.
We used iraf and purpose-written software: nekosoft (Yagi 1998); developed by the Suprime-Cam team, to reduce the data. This entailed bias subtraction, flat fielding using super sky-flats constructed from the median of the dithered science frames (9 frames), matching the point spread function (PSF) between the mosaic chips, relative calibration of the fluxes between chips, mosaicing, and photometric calibration using standard stars from Landolt (1992). We then constructed an -band selected sample using SExtractor v.2.1.6 (Bertin & Arnouts 1996). For each object we use the phot package in iraf to measure photometry within a 3′′ diameter aperture in all the passbands, after matching the PSF. Hereafter, we employ the aperture photometry for colors and SExtractor’s mag_best for total magnitudes. The final catalog used in our analysis has 15,055 galaxies brighter than ( at ).
2.2. Foreground/background subtraction
To trace the properties of galaxies inhabiting the large scale structure around the cluster core, we need to map the distribution of cluster members out to very low density regions. The key requirement for our analysis is therefore the removal of unassociated galaxies in the foreground and background, to maximize the contrast of the cluster on the sky.
Spectroscopy is the ideal method to remove the field contamination from our sample. However, it is not practical to obtain spectroscopy for the ,000 very faint galaxies required for our analysis. We therefore exploit photometric redshift techniques, as an observationally efficient and reliable method to map the three dimensional distribution and properties of faint galaxies over a large field. We apply our photometric redshift code (Kodama, Bell & Bower 1999) to the galaxies in our catalog. To test the reliability of our photometric redshifts we compare the predicted redshifts with spectroscopic measurements for the 67 confirmed cluster members from Dressler et al. (1999). For S/N detections, the dominant source of uncertainty in the photometric redshifts is the match between the model spectrum and the true galaxy spectrum. Thus, although the magnitude limit of our photometric sample is fainter than that of the spectroscopic sample, the error estimated from this comparison is a good indication of the uncertainties for all galaxies with . The photometric redshifts, , for the spectroscopic members exhibits a tail at lower redshifts, showing that they tend to be underestimated for some of the galaxies by up to . This is largely due to the lack of -band data, which is important to discriminate the blue cluster members at from the foreground galaxies (e.g. Kodama et al. 1999). We note that this modest photometric bias will only serve to weaken the trends we uncover in §3.2. We adopt a range of for the photometric membership to ensure that we include the bulk of the cluster population, %, while still reducing the field contamination by a factor of 10 at .
As a final step, we estimate the expected field contamination in our photometric redshift slice using similar observations of a blank field. This correction accounts both for field galaxies genuinely in the cluster redshift slice and for galaxies whose redshifts are miss-classified by the photometric analysis. In this case we use comparably deep imaging of the ‘Subaru/XMM Deep Field’ over a similarly large area, 618 arcmin2 (Ouchi et al. 2001). After transforming the SDSS -band to Cousins -band (Fukugita et al. 1995), we apply the same photometric redshift code to the galaxies in this field observed in the same combination of passbands and adopt the same redshift cut of . We find that the averaged surface number density of field galaxies down to that fall within this redshift range is arcmin-2. We subtract this remaining contamination statistically (§3.2).
3. Results and Discussion
3.1. Large scale structure
Having applied our photometric redshift selection, it is straightforward to map out the distribution of galaxies which are likely to be associated with the cluster. The full field of our observations is shown in Fig. 1. Several large scale structures are visible around the cluster core: two large subclumps (4 Mpc) to the West and South and a number of filamentary extensions coming out directly from the core. Importantly, most of these extensions from the core are aligned with the surrounding subclumps. The alignment of structures visible to the Northeast, Northwest and South are all good examples, each extending out to 3–5 Mpc. Since the field contamination is only 20% at the lowest density contour, most of the structures traced by the contours in Fig. 1 are expected to be real.
The structures identified in this region are qualitatively similar to those seen in cosmological simulations of the growth of clusters which exhibit the filamentary/clumpy substructures on similar scales (e.g. Ghigna et al. 1998). It appears therefore that we are witnessing A 851 as it assembles through the accretion of galaxies and groups along the filaments onto the cluster core from the surrounding field. Many of the systems in these filaments will have been assimilated into the cluster population by the present-day, given their likely infall speeds of km s-1 (1 Mpc/Gyr).
![[Uncaptioned image]](/html/astro-ph/0110354/assets/x1.png)
Fig. 1. — A wide-field map of A 851 from our Suprime-Cam imaging. The field is 11 Mpc on a side. The points identify cluster members based on photometric redshifts. Note that the remaining field contamination is not subtracted (see §3.2). The large and small circles identify the color of galaxies redder or bluer than , corresponding to 0.5 mag bluer than the color-magnitude sequence, respectively. The contours indicate the local surface density of the member galaxies defined by 10 nearest neighbors, corresponding to , 2.0 (thick) and 2.5 Mpc-2 (after correcting for field contamination; see §3.2), respectively. The thick contour traces the boundary where the color distribution of galaxies changes dramatically (see §3.3). Large scale structure is clearly visible around the cluster core, with several filaments and subclumps coming out from the main body of the cluster and extending to 5 Mpc. The overall shape resembles an ‘octopus’, with a round head and many legs.
The combination of the depth of our observations and their complete sampling, compared to spectroscopic surveys, means that our map of this cluster provides one of the most detailed views of large scale structure around clusters (West et al. 1995; Bardelli et al. 2001; Connolly et al. 1996; Lubin et al. 2000; Clowe et al. 2000; Abraham et al. 1996). The application of the photometric redshift technique to multi-color deep, panoramic CCD imaging allows us for the first time to efficiently trace weak filamentary structures across large fields of view. Furthermore, because the cluster is at relatively high redshift, the contrast between the red galaxies in the cluster core and the blue colors of the field galaxy population is greatly enhanced, providing a much stronger gradient across the transistion zone between these two regimes (§3.2).
We have also compared the structures in Fig. 1 with the X-ray emission from a 14.2-ks ROSAT PSPC exposure (Schindler et al. 1998). However, we cannot see any significant emission from the subclumps or filaments, except for the cluster core. This is not surprising given the steep slope of the mass-X-ray luminosity relation seen in local groups (Mulchaey 2000).
3.2. Environmental dependence of galaxy properties
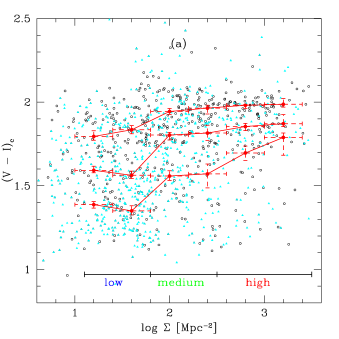
By exploiting the striking large scale structure around this cluster, we can investigate the influence of environment on the photometric properties of galaxies across more than two orders of magnitude in local density. We define the environment for each galaxy using the local surface number density, , of members, calculated from the 10 nearest neighbors (including that galaxy) brighter than our magnitude cut, . Secondly, we correct for residual field contamination in the redshift slice. We statistically subtract galaxies based on the local number density and the color and magnitude distribution of the galaxies in the blank field (§2.2) using a Monte Carlo simulation. The density is also corrected for the field contamination. The statistical uncertainty in the resultant color and magnitude distributions of the cluster members arising from this field correction is negligible. Even if we assume a large variation in field density of 20%, the median color in the lowest density bin would change only by 0.02 mag (Fig. 2a).
In the following we use color and magnitude to characterize the galaxy population. These roughly correspond to and in the rest-frame, providing a good measure of the relative importance of recent and past star formation. We divide the density distribution into three regimes as indicated in Fig. 2a. There is a close correspondence between the local density and structure: the high density region corresponds to the cluster core within Mpc; the medium density region includes the structures defining the filaments surrounding the cluster; and the low density region comprising the rest of the volume (Fig. 1).
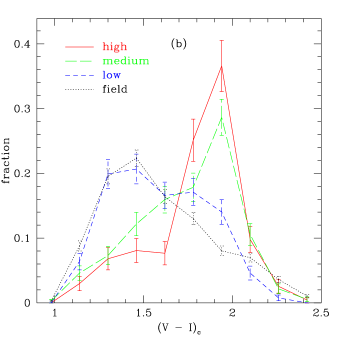
As shown in Fig. 2b, the color distribution in the high density region is strongly peaked at , the color of an early-type cluster member. However, as we move to lower densities, the distribution becomes dramatically bluer. In the lowest density regions, there are only a small fraction (15%) of galaxies as red as the early-type color magnitude sequence seen in higher density regions, with most of the galaxies being much bluer, , similar to the field population, which is dominated by star-forming galaxies at these redshifts (Ellis et al. 1996). Fig. 2a shows that this color transition with local density occurs quite abruptly at , indicating a threshold effect in transforming galaxy properties. We performe a test to verify the significance of the sharpness of the color transition, and found that a linear (smooth) dependence of median color on local density is rejected at greater than 3 sigma confidence. The boundary corresponding to this critical density is highlighted in Fig. 1. One important clue to the physical origin of this transition is that over 80% of the galaxies in the ‘transition zone’ () reside in subclumps outside the core (1.5 Mpc from the cluster center).
The origin of the color-density correlation is hotly debated. It has been suggested that it may reflect a primordial imprint of the regions in which the galaxies were formed. However, this is unlikely to give rise to a sharp transition in the colors of galaxies at a particular density threshold at the observed epoch. Our data suggest a recent and environmentally driven transformation that is closely linked to the galaxy environment at . This sharp color change is equivalent to supressing the median star formation rate by a factor of 6, based on the simple ‘tau’ models with exponentially decaying star formation histories (e.g. Kodama & Bower 2001). Our ability to pin-point this environment is a fundamental step towards identifying the dominant mechanism.
There are three mechanisms which are favored in the literature: ram-pressure stripping (where cold gas in the galaxy disk is removed as the galaxy passes through a hot intra-cluster medium; Gunn & Gott 1972); galaxy–galaxy collisions (which cause cold disk gas to be driven to the galaxy center creating a star burst; Moore et al. 1996); and ‘suffocation’ (where warm gas in the galaxy’s halo is shock heated by the intra-cluster medium so that it can no longer cool and replenish the cold gas in the disk; Larson et al. 1980). The subclumps are unlikely to have sufficiently high gas densities (§3.1), or high enough relative velocities for the galaxies within them, for ram-pressure stripping to operate effectively (Abadi et al. 1999). In contrast, we note that the threshold density corresponds to the point at which the dark matter halos of individual galaxies will begin to overlap (Brainerd et al. 1996). Under these circumstances, galaxy–galaxy collision become important, as does ‘suffocation’. Our data do not distinguish directly between these possibilities, although they do suggest where to look. In particular, the two mechanisms predict very different bulge luminosity functions for the resulting galaxies. Strong galaxy interactions thicken galaxy disks and brighten bulges, in contrast, suffocation should leave the bulge luminosity function unchanged (Dressler 1980; Balogh et al. 2001).
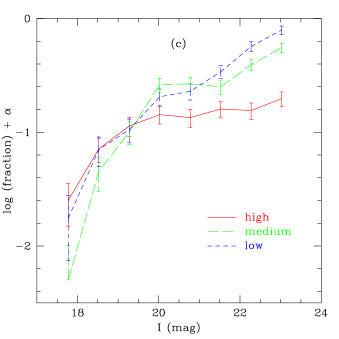
It is important to note that the changes in galaxy properties as a function of local density are most prominent in galaxies fainter than (Fig. 2a). This is mirrored to the dramatic change in the shape of the luminosity function with local galaxy density: where we see a steepening of the faint end slope of the luminosity function with decreasing density (Fig. 2c). Assuming that their star formation effectively ceases, the relative absence of low-luminosity galaxies at projected densities of can be understood as they will fade by mag as their star formation declines (e.g. Kodama & Bower 2001). This will put many of their descendents below our magnitude limit (). This is also qualitatively consistent with the presence of large numbers of very low luminosity, , passive dwarf galaxies in local clusters (Binggeli et al. 1988; Trentham 1998).
4. Conclusions
We have presented a photometric analysis of the galaxy population in A 851 at using sensitive multiband observations from Subaru. These cover a (11 Mpc) field allowing us to compare galaxy properties in a wide range of environments in the cluster periphery. By using photometric redshift techniques to identify cluster galaxies as faint as , we have traced the network of filaments and subclumps around this rich cluster, and been able to investigate the relation between environment and star formation in faint galaxies.
The colors of faint galaxies show a strong dependence on their local galaxy density, with an abrupt transition in galaxy colors occurring at . Thus, for faint galaxies, the transformation of their properties seems to be almost complete before they have entered the cluster core. The changes in the color distribution and in the luminosity function as a function of local density are coupled: there is a decreasing fraction of blue, faint galaxies in higher density regions. This density threshold corresponds to the point at which galaxy halos lose their individual identity and become incorporated into groups along the filaments surrounding the cluster.
We have now identified where the transformation of these galaxies occurs. The key remaining question is to identify why. Two mechanisms: ‘suffocation’ and galaxy–galaxy collisions are both good candidates in these environments, but they can be distinguished by tracing the variation in the individual components of galaxies, bulges and disks, between the cluster and the field.
References
- (1) Abraham, R. G., Smecker-Hane, T. A., Hutchings, J. B., Carlberg, R. G., Yee, H. K. C., et al., 1996, ApJ, 471, 694
- (2) Adabi, M. G., Bower, R. G., Navarro, J. F., 2000, MNRAS, 314, 759
- (3) Bardelli, S., Zucca, E., Baldi, A., 2001, MNRAS, 320, 387
- (4) Balogh, M. L., Morris, S. L., Yee, H. K. C., Carlberg, R. G., Ellingson, E., 1999, ApJ, 527, 54
- (5) Balogh, M. L., Navarro, J. F., Morris, S. L., 2000, ApJ, 540, 113
- (6) Balogh, M. L., et al., 2001, ApJ, submitted
- (7) Bertin, E., Arnouts, S., 1996, A&AS, 117, 393
- (8) Binggeli, B., Sandage, A., Tammann, G. A., 1988, ARA&A, 26, 509
- (9) Brainerd, T. G., Blandford, R. D., Smail, I., 1996, ApJ, 466, 623
- (10) Butcher, H., Oemler, A., 1984, ApJ, 285, 426
- (11) Clowe, D., Luppino, G. A., Kaiser, N., Gioia, I. M., 2000, ApJ, 539, 540
- (12) Connolly, A. J., Szalay, A. S., Koo, D., Romer, A. K., Holden, B., Nichol, R. C., Miyaji, T., 1996, ApJ, 473, L67
- (13) Dressler, A., 1980, ApJS, 424, 565
- (14) Dressler, A., Smail, I., Poggianti, B. M., Butcher, H., Couch, W. J., Ellis, R. S., Oemler, A., 1999, ApJS, 122, 51
- (15) Ellis, R. S., Colless, M. M., Broadhurst, T., Heyl, J., Glazebrook, K., 1996, MNRAS, 280, 235
- (16) Fukugita, M., Shimasaku, K., Ichikawa, T., 1995, PASP, 107, 945
- (17) Ghigna, S., Moore, B., Governato, F., Lake, G., Quinn, T., Stadel, J., 1998, MNRAS, 300, 146
- (18) Gunn, J. E., Gott, J., R., 1972, ApJ, 176, 1
- (19) Iye, M., et al., 2000, PASJ, 52, 9
- (20) Landolt, A. U., 1992, AJ, 104, 372
- (21) Larson, R. B., Tinsley, B. M., Caldwell, C. N., 1980, ApJ, 237, 692
- (22) Lubin, L. M., Brunner, R., Metzger, M. R., Postman, M., Oke, J. B., 2000, ApJ, 531, L5
- (23) Moore, B., Katz, N., Lake, G., Dressler, A., Oemler, A., 1996, Nature, 379, 613
- (24) Moore, B., Governato, F., Quinn, T., Stadel, J., Lake, G., 1998, ApJ, 499, L5
- (25) Mulchaey, J. S., 2000, ARA&A, 38, 289
- (26) Norberg, P., et al., 2001, MNRAS, submitted
- (27) Kodama, T., Bell, E. F., Bower, R. G., 1999, MNRAS, 302, 152
- (28) Kodama, T., Bower, R. G., 2001, MNRAS, 321, 18
- (29) Ouchi, M., et al., 2001, ApJ, 558, L83
- (30) Peacock, J. A., et al., 2001, Nature, 410, 169
- (31) Pimbblet, K. A., Smail, I., Kodama, T., Edge, A. C., Couch, W. J., Zabludoff, A. I., O’Hely, E., 2001, MNRAS, submitted
- (32) Schindler, S., Belloni, P., Ikebe, Y., Hattori, M., Wambsganss, J., Tanaka, Y., 1998, A&A, 338, 843
- (33) Trentham, N., 1998, MNRAS, 293, 71
- (34) Yagi, M., 1998, PhD Thesis, University of Tokyo
- (35) West, M. J., Jones, C., Forman, W., 1995, ApJL, 451, L5