The UCSD HIRES/Keck I Damped Ly Abundance Database: I. The Data
Abstract
We present new chemical abundance measurements of 16 damped Ly systems at and update our previous abundance analyses. The entire database presented here was derived from HIRES observations on the Keck I telescope, reduced with the same software package, and analysed with identical techniques. Altogether, we present a large, homogeneous database of chemical abundance measurements for protogalaxies in the early universe, ideal for studying a number of important aspects of galaxy formation. In addition, we have established an online directory for this database and will continuously update the results.
Accepted to the Astrophysical Journal Supplements: June 8, 2001
1 INTRODUCTION
Since their discovery nearly twenty years ago (Wolfe et al., 1986), the damped Ly systems have provided an extraordinary means for probing the properties of high redshift galaxies. For example, Wolfe and his collaborators have led a number of observing programs to trace the universal neutral baryonic content, a study made possible by the fact that the damped Ly systems are the dominant neutral gas reservoirs at every epoch (e.g. Wolfe et al., 1995; Lanzetta et al., 1995; Storrie-Lombardi et al., 1996; Storrie-Lombardi and Wolfe, 2000). Through accurate metallicity measurements, damped Ly studies also provide an examination of the chemical enrichment history of the universe (Pettini et al. 1994, 1997; Prochaska & Wolfe 2000; Prochaska, Gawiser, & Wolfe 2001, hereafter PGW01). In addition, the advent of high resolution echelle spectrographs on 10m class telescopes have enabled researchers to trace the relative chemical abundances of these systems, measurements which provide direct insight into processes of nucleosynthesis and dust depletion in the early universe (Lu et al. 1996, hereafter L96; Prochaska & Wolfe 1999, hereafter PW99; Pettini et al. 2000).
In this paper, we build on previous observations of the chemical abundances of damped Ly systems. In particular, we introduce new measurements of over 15 damped Ly systems and revise the measurements of our previously analysed systems (PW99). The principle goal of this paper is to provide the community with a uniform, homogeneous database of damped Ly abundances. To this end, we have created a web site111http://kingpin.ucsd.edu/hiresdla where we will continuously update our observations and possibly include measurements from throughout the community. Our new observations include spectra with wavelength coverage extending blueward of Ly where elements like Ar, P, S, N, and O can be examined. In the second paper in this series (Paper II; Prochaska & Wolfe, 2001a), we address the implications of the complete data set on chemical evolution, dust depletion, dust obscuration, and nucleosynthesis. In companion papers, we address the N/O abundance of the damped Ly systems, examine the kinematic characteristics of the full sample (Prochaska & Wolfe, 2001b), infer the star formation rate of the damped systems (Wolfe, Prochaska, & Gawiser, 2001), and investigate the observational evidence for photoionization in these systems.
2 OBSERVATIONS AND ANALYSIS
All of the observations presented in this paper were acquired with the High Resolution Echelle Spectrograph (HIRES; Vogt et al., 1994) on the Keck I 10m telescope. The HIRES spectrograph is mounted at the Nasmyth focus of Keck I and is equipped with an image rotator, two collomators (red and blue sensitive), and a Tektronix 20482048 CCD. For each observation, we implemented either a or slit which provides a resolution of FWHM and 6.3 km/s respectively. The HIRES spectrograph affords Å of wavelength coverage per setting with continuous coverage below Å. Table 1 summarizes all of the new observations; refer to PW99 for previous observations.
| QSO | Alt. name | Wavelength | Date | Exposure | Resolution | SNR | |
|---|---|---|---|---|---|---|---|
| (Å) | (s) | (km/s) | (pix-1) | ||||
| J0255+00 | … | 4.02 | 5100–8160 | F99,F00 | 20200 | 6.3 | 15 |
| Q033601 | … | 3.22 | 3940–6390 | F99 | 5400 | 8.2 | 10 |
| Q034738 | … | 3.23 | 3600–5900 | F98 | 4500 | 8.2 | 6 |
| HS0741+4741 | 3.20 | 3600–5900 | F98,S00 | 10800 | 8.2 | 25 | |
| 5050–7470 | F00 | 5400 | 6.3 | 30 | |||
| Q095104 | BRI09510450 | 4.37 | 5720–8150 | F99 | 7200 | 8.2 | 10 |
| BRI 09520115 | … | 4.43 | 5700–8150 | S99 | 28800 | 8.2 | 15 |
| PSS0957+33 | … | 4.25 | 6440–8760 | F00 | 7200 | 6.3 | 15 |
| BRI 11080747 | … | 3.92 | 5950–8340 | F98,F99 | 12600 | 8.2 | 20 |
| Q1210+17 | 2.54 | 3760–6170 | S00 | 7200 | 8.2 | 20 | |
| Q1223+17 | 2.92 | 4780–7160 | S98 | 19600 | 8.2 | 30 | |
| 3560–5900 | S98 | 5000 | 8.2 | 7 | |||
| BRI1346–0322 | 3.99 | 4280–6600 | S00 | 7200 | 8.2 | 4 | |
| PSS1443+27 | 4.41 | 6070–8500 | S99 | 25200 | 8.2 | 20 | |
| 6790–9180 | S00 | 11000 | 8.2 | 15 | |||
| Q1759+75 | GB1759+7539 | 3.05 | 3500–5800 | S00 | 22200 | 8.2 | 30 |
| Q1946+7658 | 2.99 | 3470–5055 | F98 | 47970 | 8.2 | 50 | |
| Q2344+12 | 4.30 | 3400–4985 | F98 | 4000 | 8.2 | 12 | |
| Q2348–01 | 3.01 | 5060–7480 | F99,F00 | 16200 | 8.2 | 15 |
All of the data were reduced with the MAKEE package as tailored for HIRES observations by T. Barlow222http://spider.ipac.caltech.edu/staff/tab/makee. This package flat-fields the exposures, optimally extracts the spectra from the 2-D images traced by a standard star or pinhole image, removes cosmic rays, and wavelength calibrates the spectra by cross-correlating each object’s Th-Ar calibrations with a large database of calibrated HIRES data. We then continuum fit each spectrum with an in-house routine similar to the IRAF task CONTINUUM. For quasars with multiple exposures, the individual spectra were coadded (weighting by S/N and rejecting bad pixels) to produce a single 1-D spectrum with 2 km/s pixels.
3 IONIC COLUMN DENSITIES
In this section, we present ionic column density measurements for all of the new systems as well as a number of transitions excluded in PW99. All of the ionic column densities were derived with the apparent optical depth method (AODM; Savage and Sembach, 1991). This technique corrects for hidden saturation by comparing the apparent column density, , for multiple transitions from a single ion. This technique also gives an efficient means of calculating total column densities for each ion. The analysis involves calculating for each pixel from the optical depth equation
| (1) |
where , is the oscillator strength, is the rest wavelength, and and are the incident and measured intensity. By summing over the velocity profile of a given transition one calculates the total column density,
| (2) |
and a error on the column density through standard error propagation
| (3) |
In previous papers (Wolfe et al., 1994; Prochaska & Wolfe, 1996, 1997), we showed that the damped Ly profiles are not contaminated by hidden saturation. Furthermore, we demonstrated the total column densities derived with the AODM agree very well with line-profile fitting, which should give a more accurate measure of the ionic column densities when hidden saturation is negligible. As the AODM is easier to apply to a large data set, we have chosen to use this technique to measure the ionic column densities for the damped Ly sample.
| Transition | Ref | ||
|---|---|---|---|
| HI-19 914 | 914.0390 | 0.00019700 | 1 |
| HI-18 914 | 914.2860 | 0.00023000 | 1 |
| HI-17 914 | 914.5760 | 0.00027000 | 1 |
| HI-16 914 | 914.9190 | 0.00032100 | 1 |
| HI-15 915 | 915.3290 | 0.00038600 | 1 |
| NII 915 | 915.6120 | 0.14490000 | 1 |
| HI-14 915 | 915.8240 | 0.00046900 | 1 |
| HI-13 916 | 916.4290 | 0.00057700 | 1 |
| PIII 917 | 917.1180 | 0.40490000 | 1 |
| HI-12 917 | 917.1806 | 0.00072260 | 1 |
| HI-11 918 | 918.1294 | 0.00092100 | 1 |
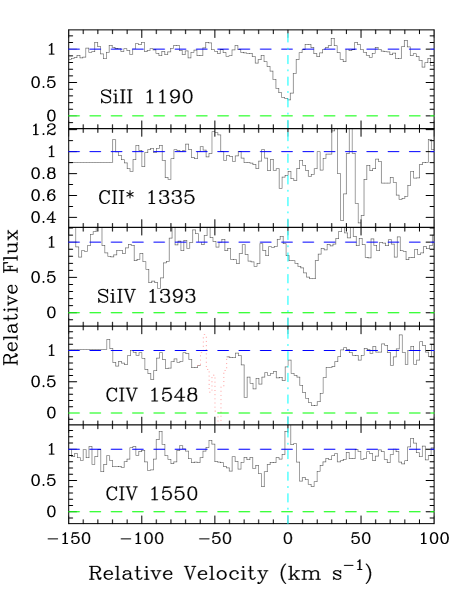
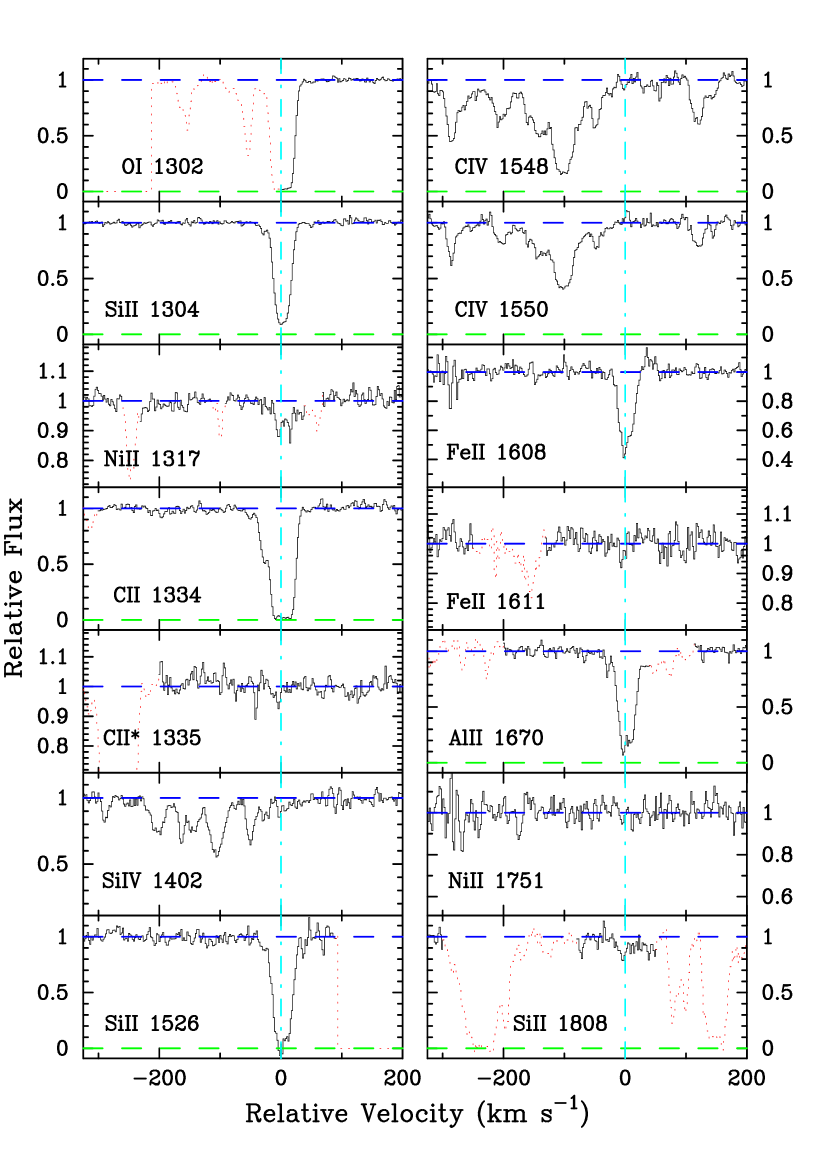
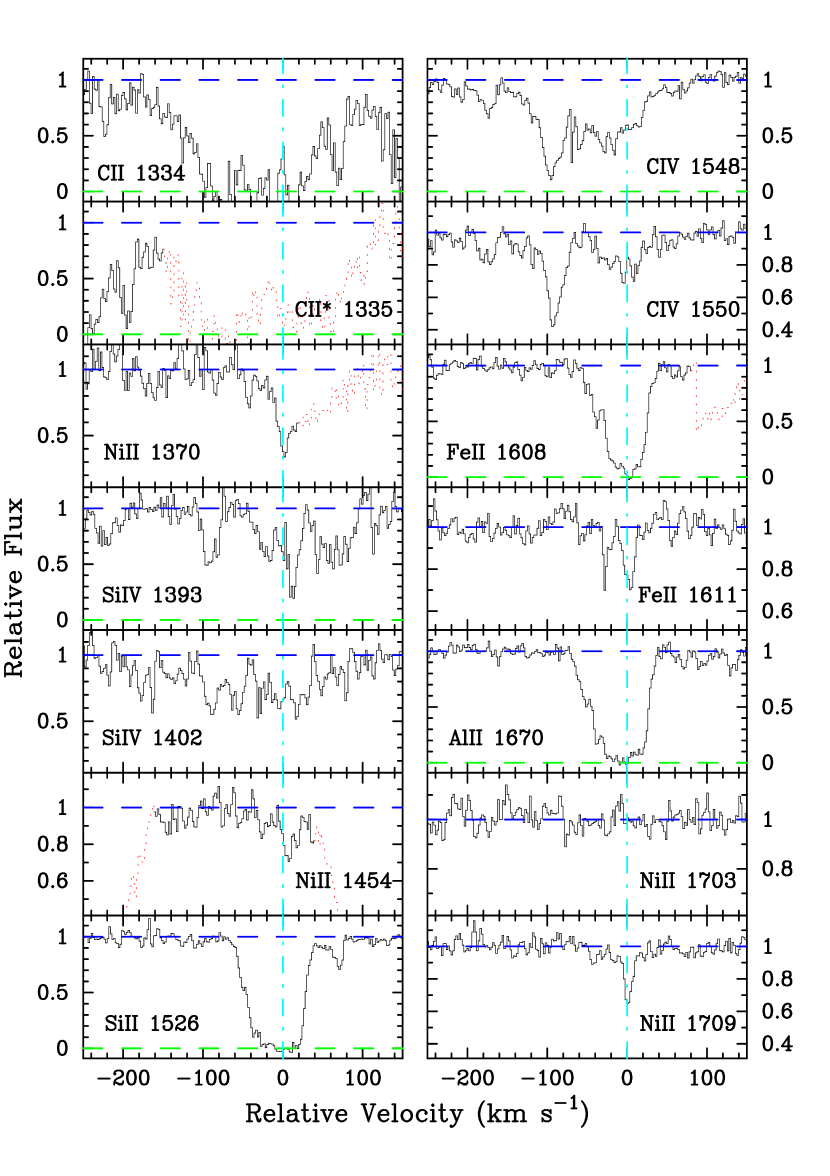
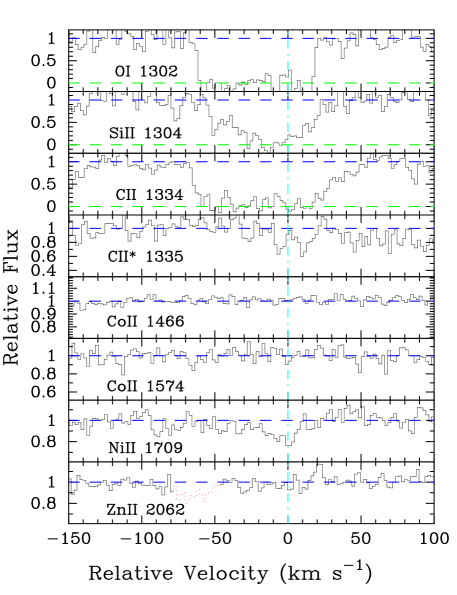
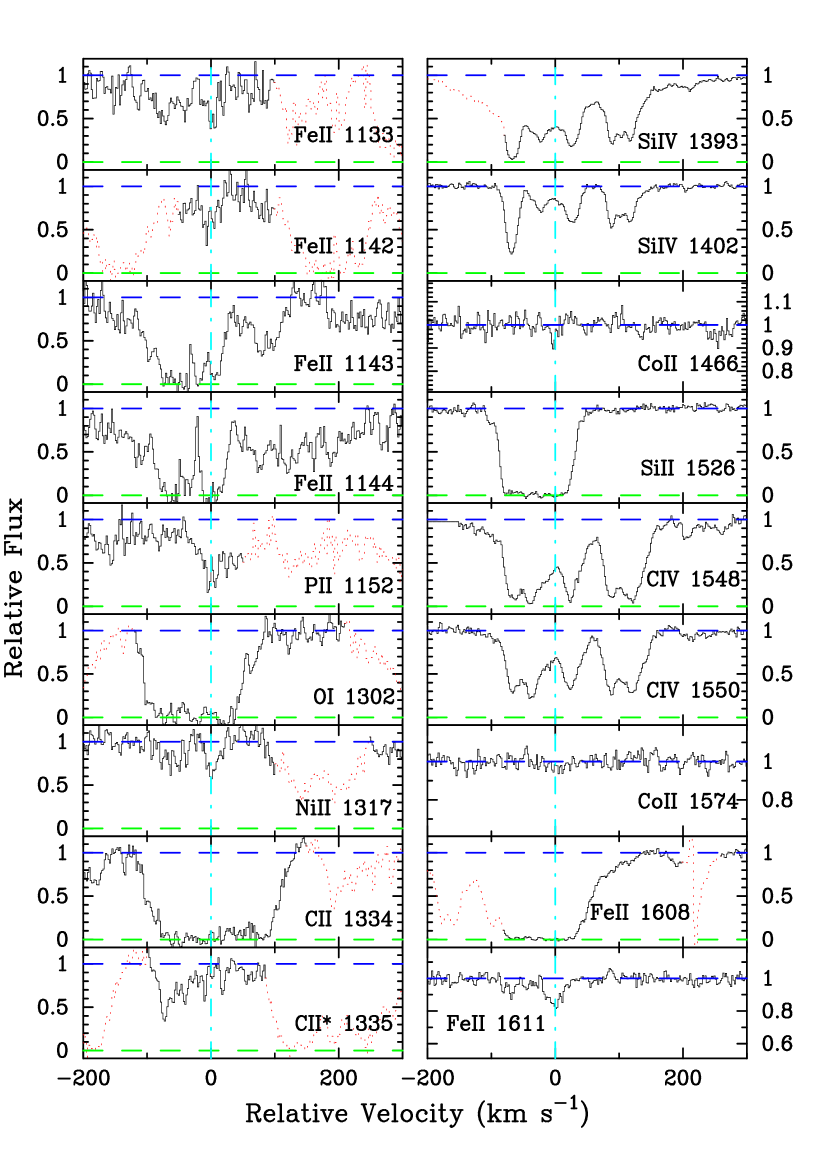
Tables 340 present the results of the abundance measurements including an estimate of the error. For those transitions where the profile saturates, i.e. in at least one pixel, the column densities are listed as lower limits. The values reported as upper limits are limits except in the cases where we set an upper limit due to significant line blending. We have ignored continuum error in our analysis which may dominate the measurements of very weak transitions especially those blueward of Ly emission. We estimate a systematic error of in most cases. The 3 statistical limits are conservative, however, and are likely to account for the continuum error in all but the noisiest and/or crowded absorption regions. In the following subsections, we comment briefly on each damped Ly system, plot the metal-line profiles, and tabulate column densities for each profile. We adopt ionic column densities from these measurements by calculating the weighted-mean. In the velocity plots, is chosen arbitrarily and corresponds to the redshift listed in the figure caption. We indicate regions of blending, primarily through blends with other metal-line systems or the Ly forest, by plotting with dotted lines. For those systems previously analysed in PW99, we report only upon the changes made since publication. For completeness, when we include the measurement of a new transition (e.g. Ni II 1317) we report other measurements of the same ion and the new adopted ionic column density.
Throughout the paper, we adopt the wavelengths and oscillator strengths presented in Table 2. When possible, we have adopted laboratory values for the oscillator strengths. Since PW99 there have been several new measurements of -values which impact the abundances of the damped Ly systems, including new Ni II and Ti II oscillator strengths which have significantly revised the abundances of these elements. Most importantly, however, is the adoption of new oscillator strengths for the majority of Fe II transitions and in particular the Fe II transitions. In this paper, we adopt from the laboratory measurement of Bergeson et al. (1996) and from Raassen & Uylings (1998). In general, these values revise the abundance of Fe+ downward by dex. Finally, we adopt solar meteoritic abundances from Grevesse et al. (1996).
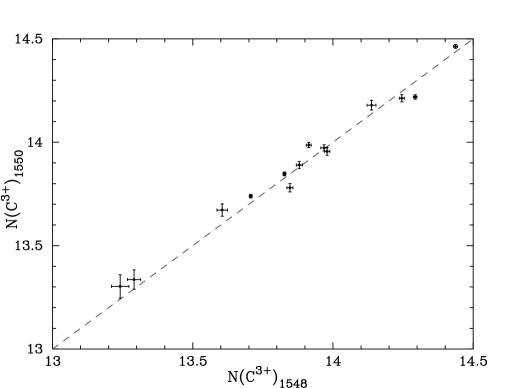
To assess the accuracy of our measurements and the reliability of the error analysis, one can compare the column density measurements from two transitions for the same ion with very accurately known relative oscillator strengths. The majority of our damped Ly systems exhibit absorption from the high-ion C+3 (Wolfe & Prochaska, 2000) which exhibits a pair of resonance absorption lines at Å due to the spin-orbit coupling of the 2p electronic level. Because the physics of spin-orbit coupling is well understood, we have high confidence that the relative oscillator strengths of the transitions is 2:1. Figure 1 plots the value vs. for all of the damped Ly systems where the transitions are unsaturated and unblended. One notes that the agreement in the values is excellent even out to where saturation could affect the stronger C IV 1548 transition. In short, Figure 1 demonstrates that the AODM provides a reasonably accurate measure of the column densities and errors for our analysis.
We now comment on the individual systems noting revisions from previous works where applicable. In the figures, we have dotted out identified line blends.
| Ion | AODM | [X/H] | ||
|---|---|---|---|---|
| HI | 1215 | |||
| Ni II | 1454 | |||
| Ni II | 1751 |
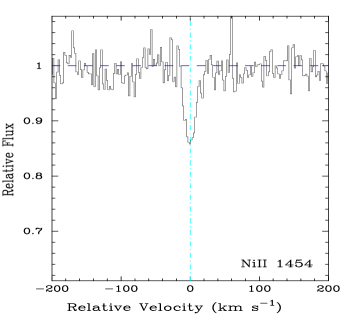
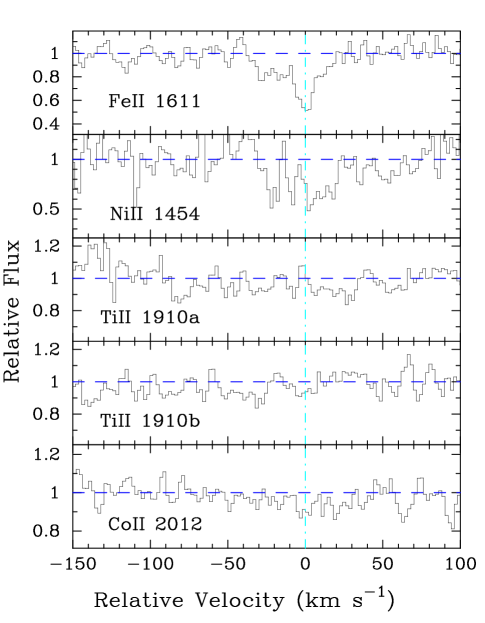
3.1 Q000026, = 3.390
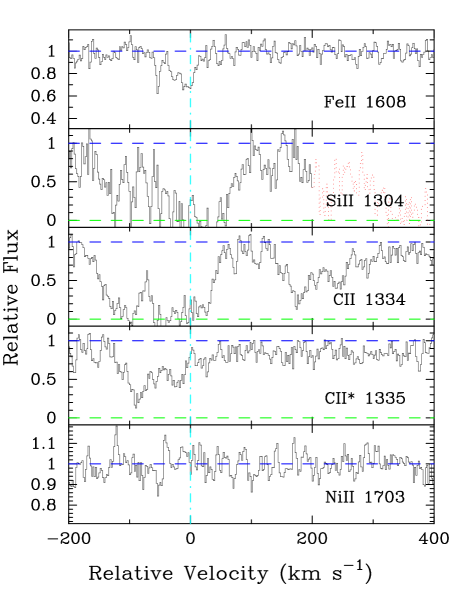
We presented metal abundances for this system in PW99, but missed the Ni II 1454 profile (Figure 2). Furthermore, we have identified a telluric blend with the Ni II 1751 profile which lead to an overestimate of Ni for this system. The Ni II 1454 column density is in excellent agreement with the Ni abundance derived by Molaro et al. (2000) and further clouds the nucleosynthetic interpretation of this system (Molaro et al., 2001). Owing to the higher signal-to-noise of the UVES spectrum, we now adopt the Fe+ column density from Molaro et al. (2000) but revise it downward to due to the new Fe II 1611 oscillator strength. This places the Fe+ column density in reasonably good agreement with the measurement and further supports the notion that the -elements (O, Si) are enhanced in this system. We note in passing that the value derived from our HIRES spectrum of Fe II 1611 still significantly exceeds the UVES measurement for reasons we do not fully appreciate.
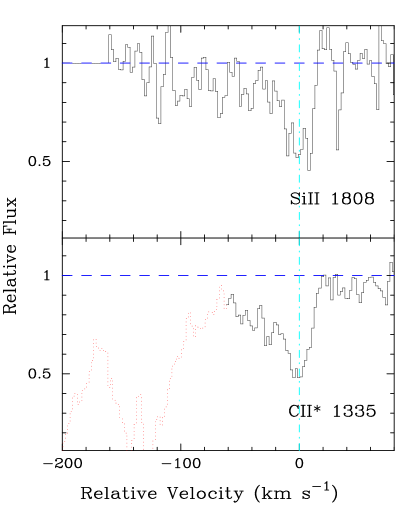
3.2 BR001915, = 3.439
This system was analysed in PW99. Since publication, we have identified the C II∗ 1335 profile (Figure 3) and revised the Fe II 1608 column density to a lower limit because the profile is mildly saturated. This revision accounts for the large Ni/Fe ratio reported in PW99.
| Ion | AODM | [X/H] | ||
|---|---|---|---|---|
| HI | 1215 | |||
| C II | 1335 | |||
| Fe II | 1608 | |||
| Ni II | 1709 | |||
| Ni II | 1741 |
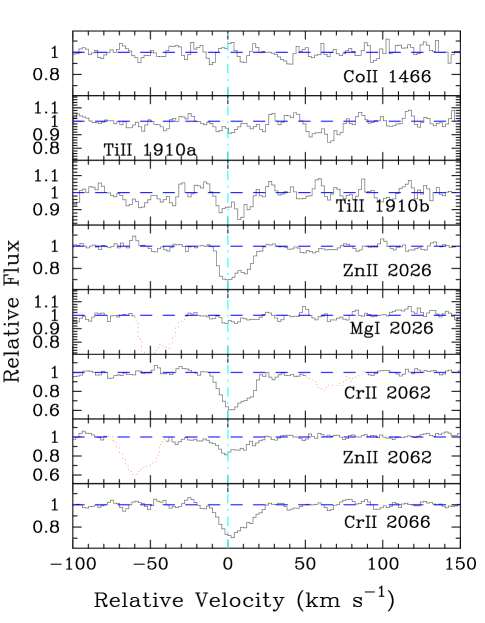
3.3 PH957, = 2.309
This system was carefully studied in Wolfe et al. (1994) and subsequently in PW99. We present new limits on and , the latter which places a tight constraint on the Ti/Fe ratio ([Ti/Fe] dex). We also present a measurement of from the Mg I 2026 transition. Figure 4 presents the new profiles as well as several Zn II and Cr II transitions which provide clarification with respect to the identification of Mg I 2026. Table 5 lists the new values.
| Ion | AODM | [X/H] | ||
|---|---|---|---|---|
| HI | 1215 | |||
| Mg I | 2026 | |||
| Ti II | 1910 | |||
| Co II | 1466 |
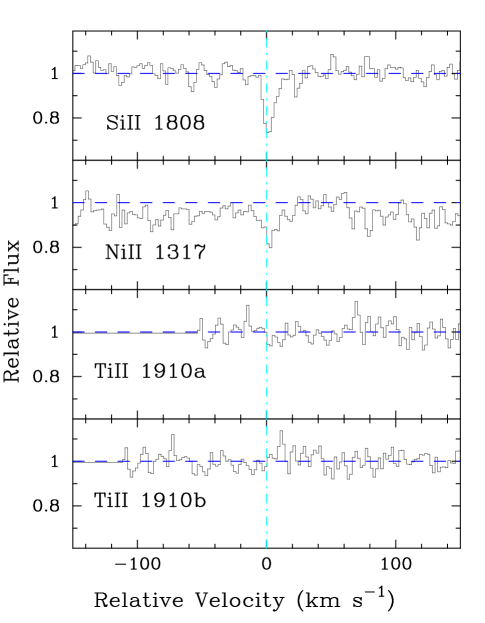
3.4 Q014933, = 2.140
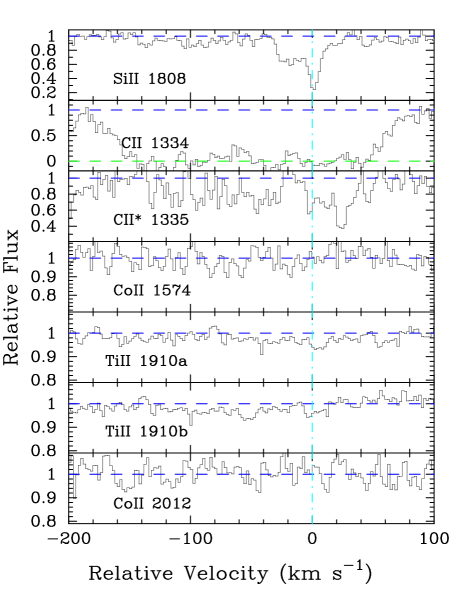
We have several changes to report on this system since PW99. Figure 5 presents the Ni II 1317 and Ti II 1910 profiles which were overlooked in PW99. We have also revised the Si II 1304 and Si II 1526 column densities to lower limits and base the Si abundance solely on the unsaturated Si II 1808 profile. For Cr, we now include the Cr II 2062 profile in our analysis. Finally, we warn that the Fe II 1608 column density might be considered a lower limit for which would explain its underabundance relative to Cr and Ni. As noted in PW99, this system exhibits a super-solar Cr/Zn ratio ([Cr/Zn] ). Because of its low [Zn/H] and values, this system has special significance in terms of dust depletion (Paper II, 3).
| Ion | AODM | [X/H] | ||
|---|---|---|---|---|
| HI | 1215 | |||
| Si II | 1304 | |||
| Si II | 1526 | |||
| Si II | 1808 | |||
| Ti II | 1910 | |||
| Cr II | 2056 | |||
| Cr II | 2062 | |||
| Cr II | 2066 | |||
| Ni II | 1317 | |||
| Ni II | 1370 | |||
| Ni II | 1703 | |||
| Ni II | 1709 | |||
| Ni II | 1741 | |||
| Ni II | 1751 |
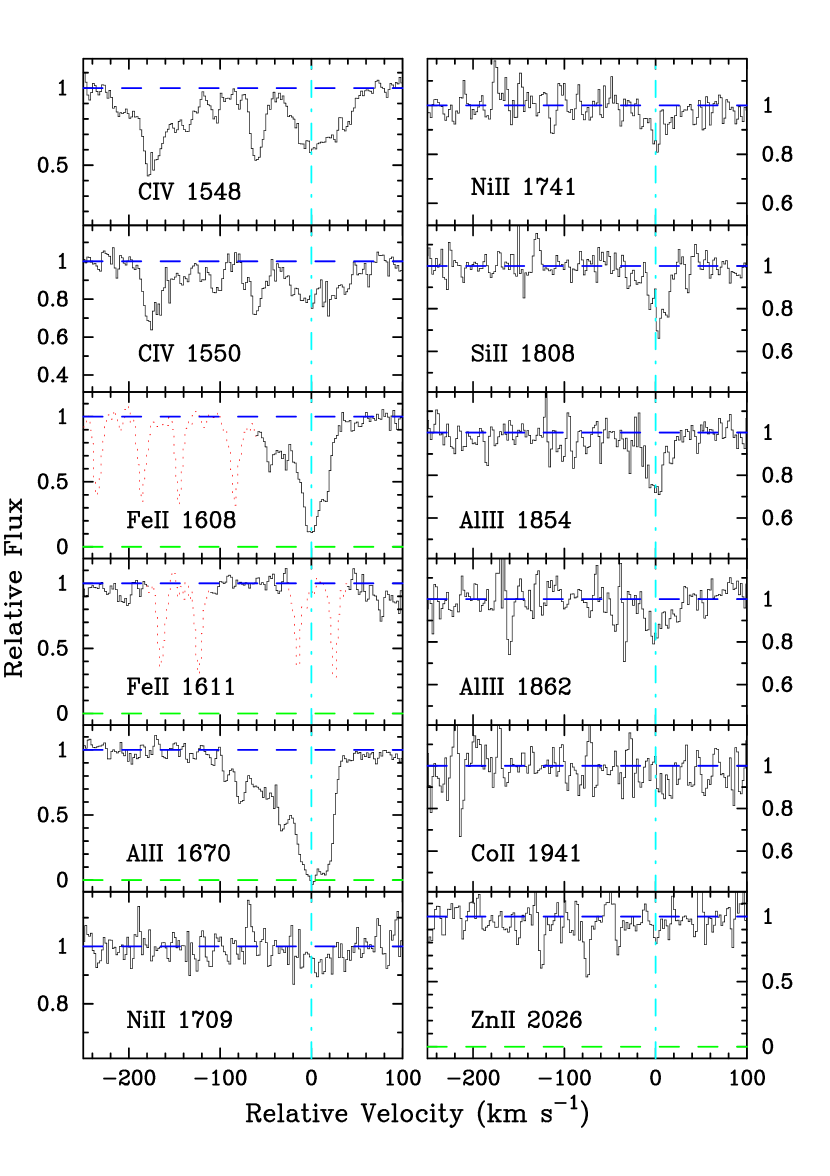
3.5 Q020136, = 2.463
This system was studied at length in Prochaska & Wolfe (1996) and we now include an upper limit on the Ti II 1910 transition and a measurement for the Ni II 1454 profile (Figure 6). To provide the best comparison with other objects in the complete sample, we adopt AODM column densities for all of the transitions (Table 7).
| Ion | AODM | [X/H] | ||
|---|---|---|---|---|
| HI | 1215 | |||
| C IV | 1550 | |||
| Al II | 1670 | |||
| Al III | 1862 | |||
| Si II | 1808 | |||
| Si IV | 1393 | |||
| Ti II | 1910 | |||
| Cr II | 2056 | |||
| Cr II | 2066 | |||
| Fe II | 1608 | |||
| Co II | 2012 | |||
| Ni II | 1454 | |||
| Ni II | 1709 | |||
| Ni II | 1741 | |||
| Ni II | 1751 |
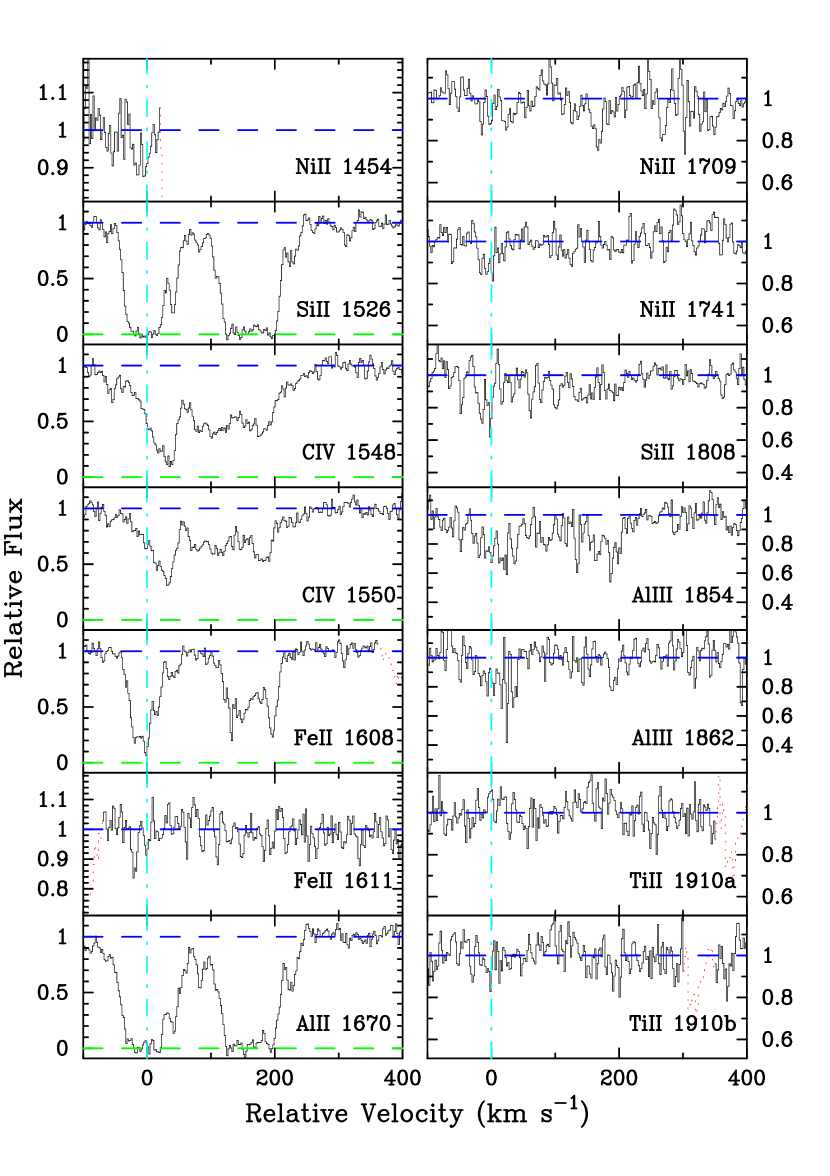
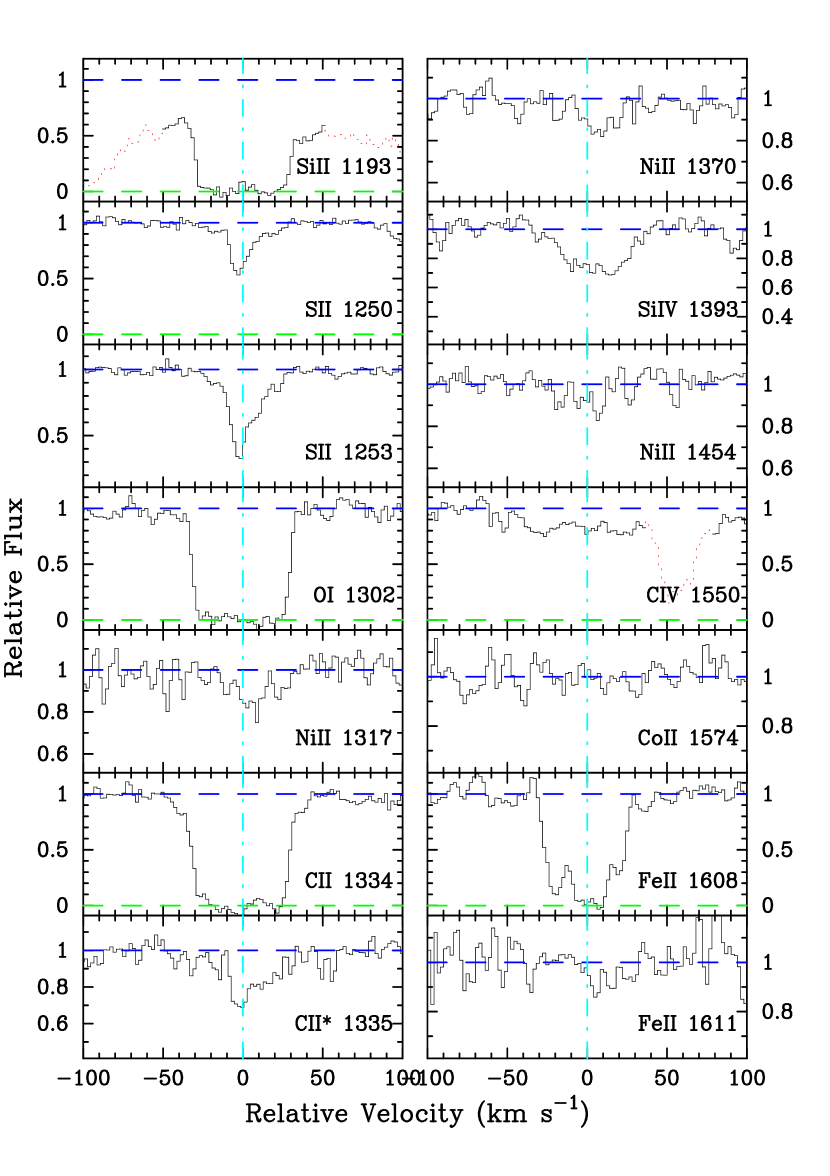
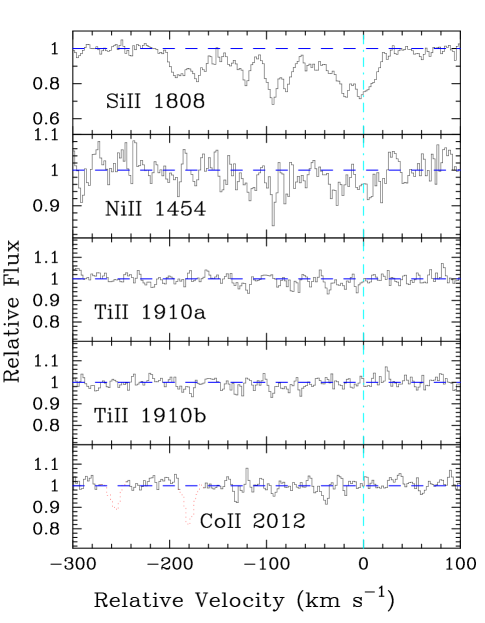
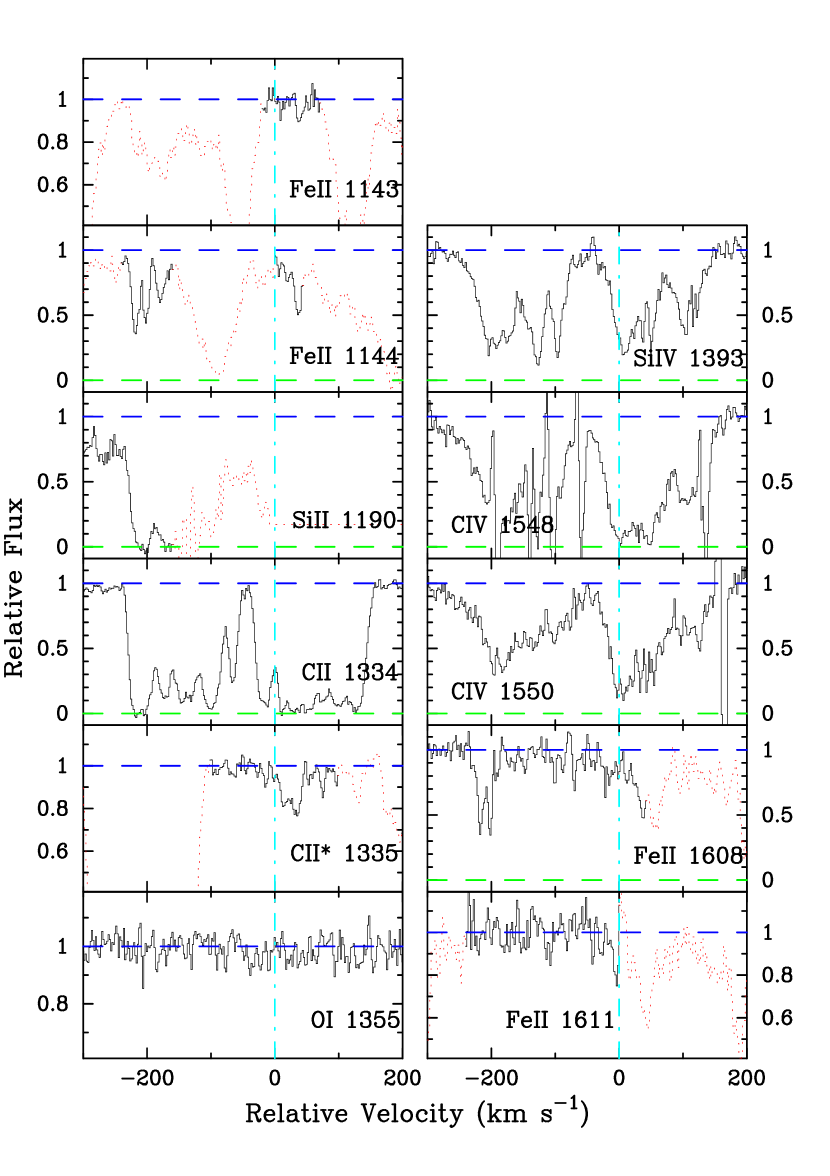
3.6 J025500, =3.253 and =3.915
The two damped Ly systems observed toward this faint SDSS quasar (; Fan et al., 1999) were identified as part of a program designed to survey damped Ly systems (Wolfe et al., 2001). We measured the column densities of the two systems with an LRIS spectrum and then acquired HIRES observations at wavelengths redward of the Ly forest. Figures 7 and 8 present the metal-line profiles for the two systems and Tables 8 and 9 list the ionic column densities. For the system at , is well constrained by the lower and upper limits from the Fe II 1608 and Fe II 1611 transitions respectively and we have adopted a column density by averaging the two limits: dex.
| Ion | AODM | [X/H] | ||
|---|---|---|---|---|
| HI | 1215 | |||
| C IV | 1548 | |||
| C IV | 1550 | |||
| Al II | 1670 | |||
| Al III | 1854 | |||
| Al III | 1862 | |||
| Si II | 1526 | |||
| Si II | 1808 | |||
| Ti II | 1910 | |||
| Fe II | 1608 | |||
| Fe II | 1611 | |||
| Ni II | 1709 | |||
| Ni II | 1741 |
| Ion | AODM | [X/H] | ||
|---|---|---|---|---|
| HI | 1215 | |||
| C II | 1334 | |||
| C II | 1335 | |||
| O I | 1302 | |||
| Si II | 1193 | |||
| Si IV | 1393 | |||
| S II | 1250 | |||
| S II | 1253 | |||
| Fe II | 1608 | |||
| Fe II | 1611 | |||
| Co II | 1574 | |||
| Ni II | 1317 | |||
| Ni II | 1370 | |||
| Ni II | 1454 |
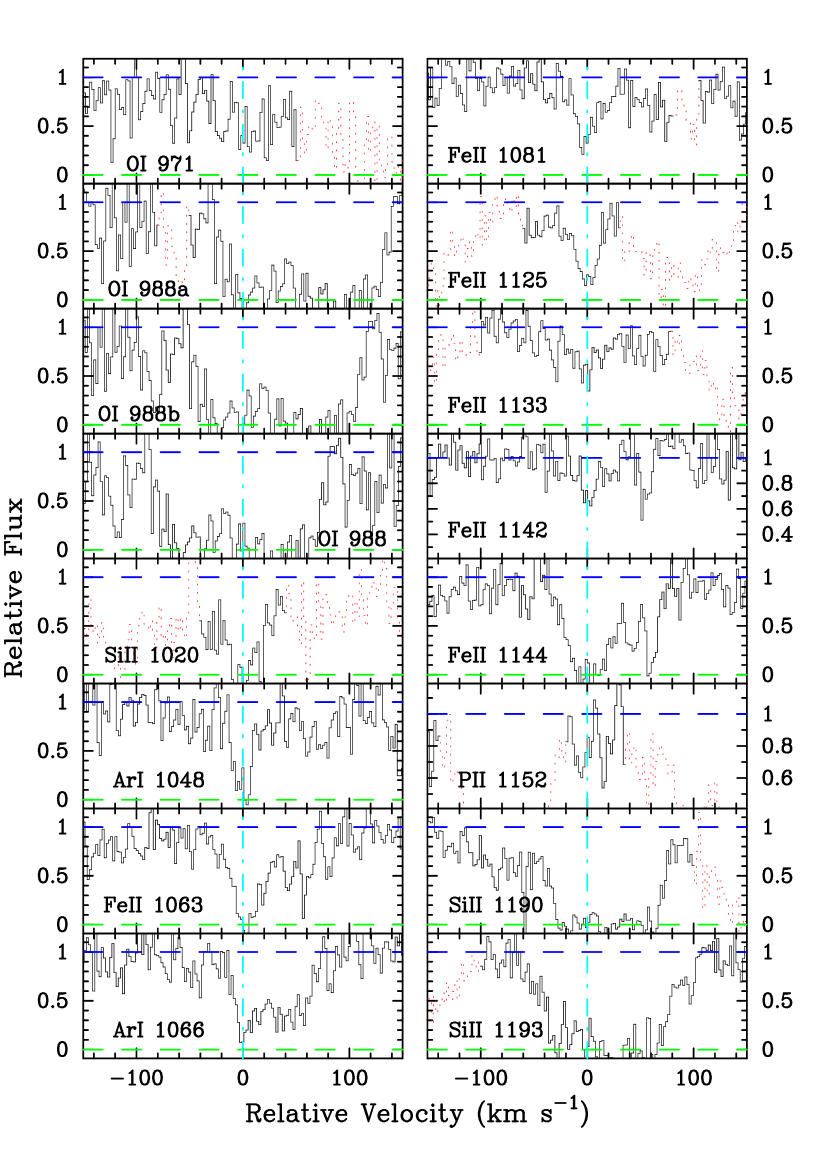
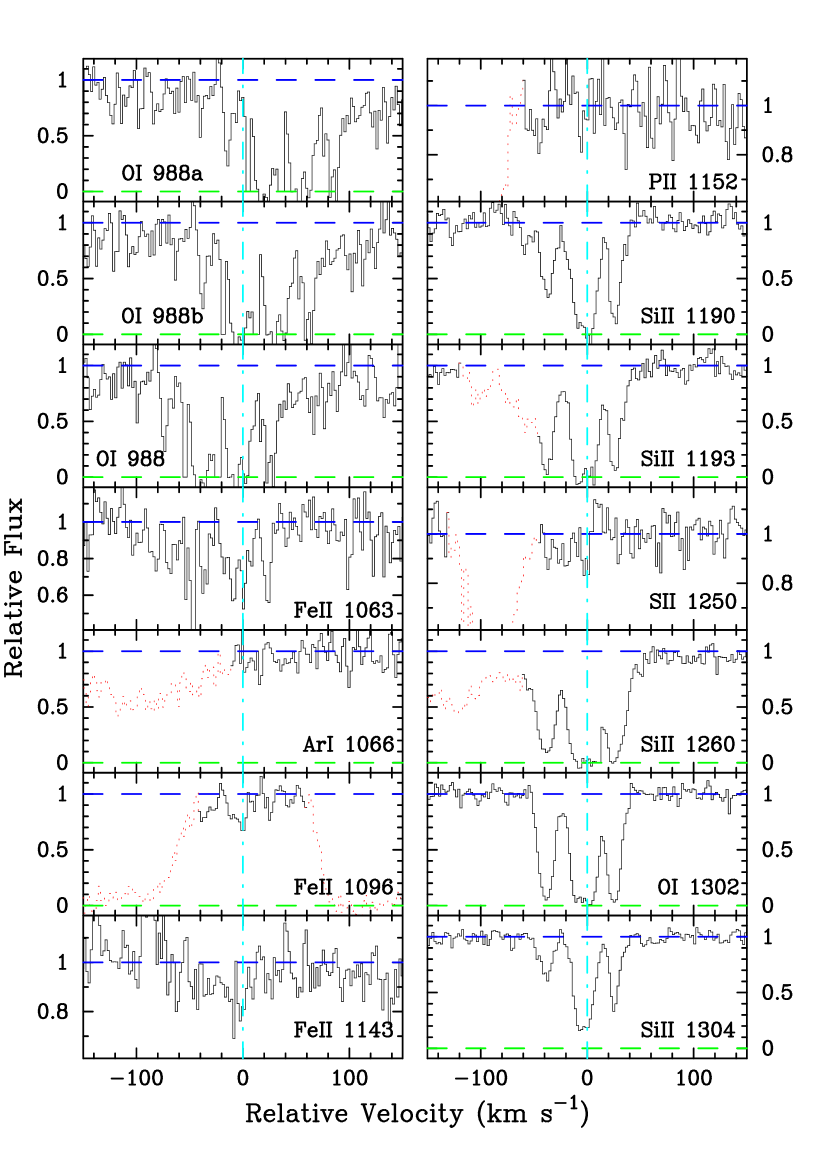
3.7 Q033601, =3.062
This LBQS quasar is one of the few damped Ly systems at with . Although most of the transitions that we examine lie within the Ly forest, we have carefully avoided lines which are clearly blended with forest clouds. Unfortunately, we only place a lower limit on although we do report a reasonably secure value for . The system also provides an accurate measurement of Ar I and a reasonable estimate of P II. Finally, we note a very large lower limit derived from the saturated O I 988 transition. This limit may be influenced by blending in the Ly forest, but we have no reason to believe this is the case at present.
| Ion | AODM | [X/H] | ||
|---|---|---|---|---|
| HI | 1215 | |||
| C II | 1334 | |||
| C II | 1335 | |||
| C IV | 1548 | |||
| C IV | 1550 | |||
| O I | 988 | |||
| O I | 1302 | |||
| Si II | 1020 | |||
| Si II | 1193 | |||
| Si II | 1304 | |||
| Si IV | 1393 | |||
| Si IV | 1402 | |||
| P II | 1152 | |||
| S II | 1250 | |||
| S II | 1259 | |||
| Ar I | 1048 | |||
| Ar I | 1066 | |||
| Fe II | 1081 | |||
| Fe II | 1125 | |||
| Fe II | 1142 | |||
| Fe II | 1144 | |||
| Ni II | 1317 | |||
| Ni II | 1370 | |||
| Ni II | 1454 |
![[Uncaptioned image]](/html/astro-ph/0110350/assets/x10.png)
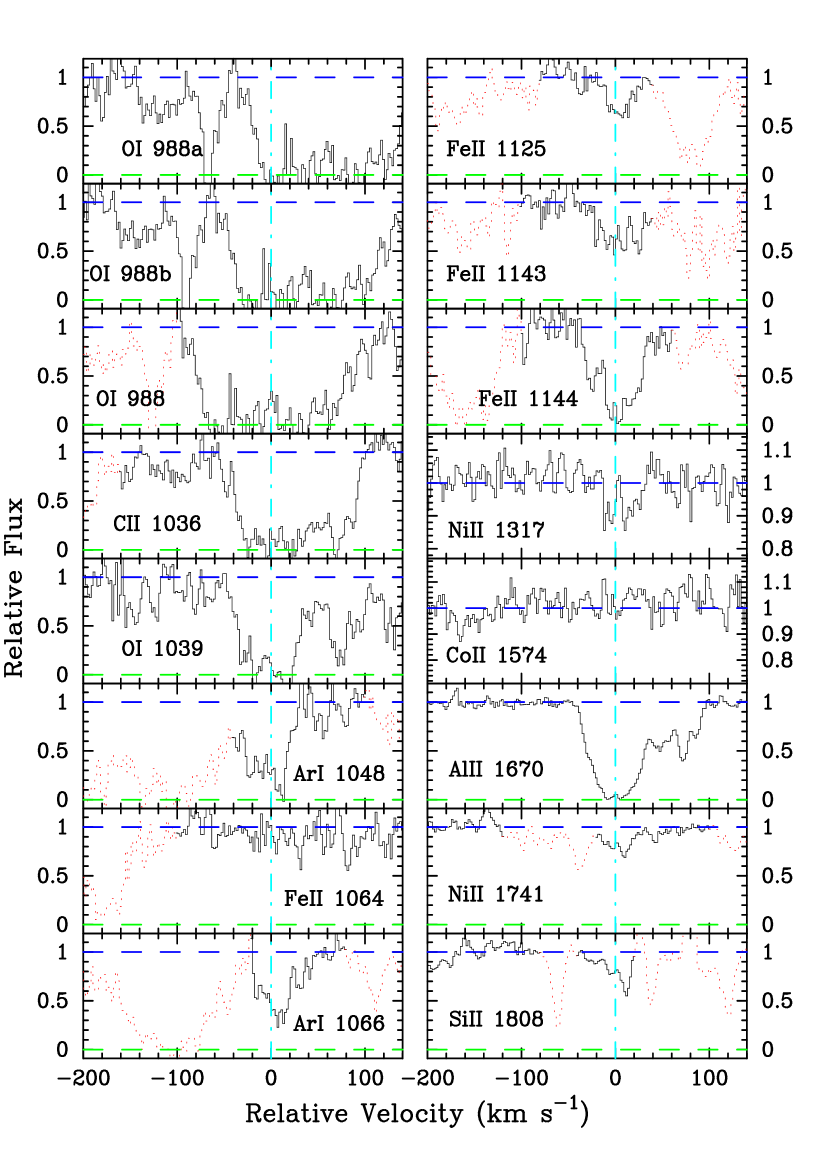
3.8 Q034738, = 3.025
Although this system was analysed in PW99, we report a number of measurements and limits based on the original data and new observations taken with a second, blue setup. Table 11 presents the ionic column densities and Figure 10 plots the new profiles. We also reclassify the sulfur abundance as an upper limit because this transition is blended with a Ly forest cloud.
| Ion | AODM | [X/H] | ||
|---|---|---|---|---|
| HI | 1215 | |||
| C II | 1036 | |||
| C II | 1334 | |||
| O I | 1039 | |||
| O I | 1302 | |||
| Al II | 1670 | |||
| Si II | 1260 | |||
| Si II | 1304 | |||
| Si II | 1808 | |||
| S II | 1259 | |||
| Ar I | 1048 | |||
| Ar I | 1066 | |||
| Fe II | 1063 | |||
| Fe II | 1125 | |||
| Fe II | 1143 | |||
| Fe II | 1608 | |||
| Fe II | 1611 | |||
| Co II | 1574 | |||
| Ni II | 1317 | |||
| Ni II | 1370 | |||
| Ni II | 1741 |
| Ion | AODM | [X/H] | ||
|---|---|---|---|---|
| HI | 1215 | |||
| C I | 1656 | |||
| Mg I | 2026 | |||
| Ti II | 1910 | |||
| Co II | 2012 | |||
| Ni II | 1317 | |||
| Ni II | 1370 | |||
| Ni II | 1454 | |||
| Ni II | 1703 | |||
| Ni II | 1709 | |||
| Ni II | 1741 | |||
| Ni II | 1751 | |||
| Zn II | 2026 | |||
| Zn II | 2062 |
3.9 Q045802, = 2.040
In reviewing this system, we identified a number of transitions missed in PW99. Figure 11 presents the metal-line profiles and Table 12 shows the column densities. Most of these only yield upper limits on ionic column densities, but given the very large HI column density of this system these limits are valuable. For example, the limit on Ti II 1910 implies [Ti/Fe] dex which is highly suggestive of dust depletion. As discussed in Paper II, 2.1.6, we have revised the measurement of downward by 0.02 dex due to mild blending between the Zn II 2026 and Mg I 2026 profiles.
3.10 HS074147, = 3.017
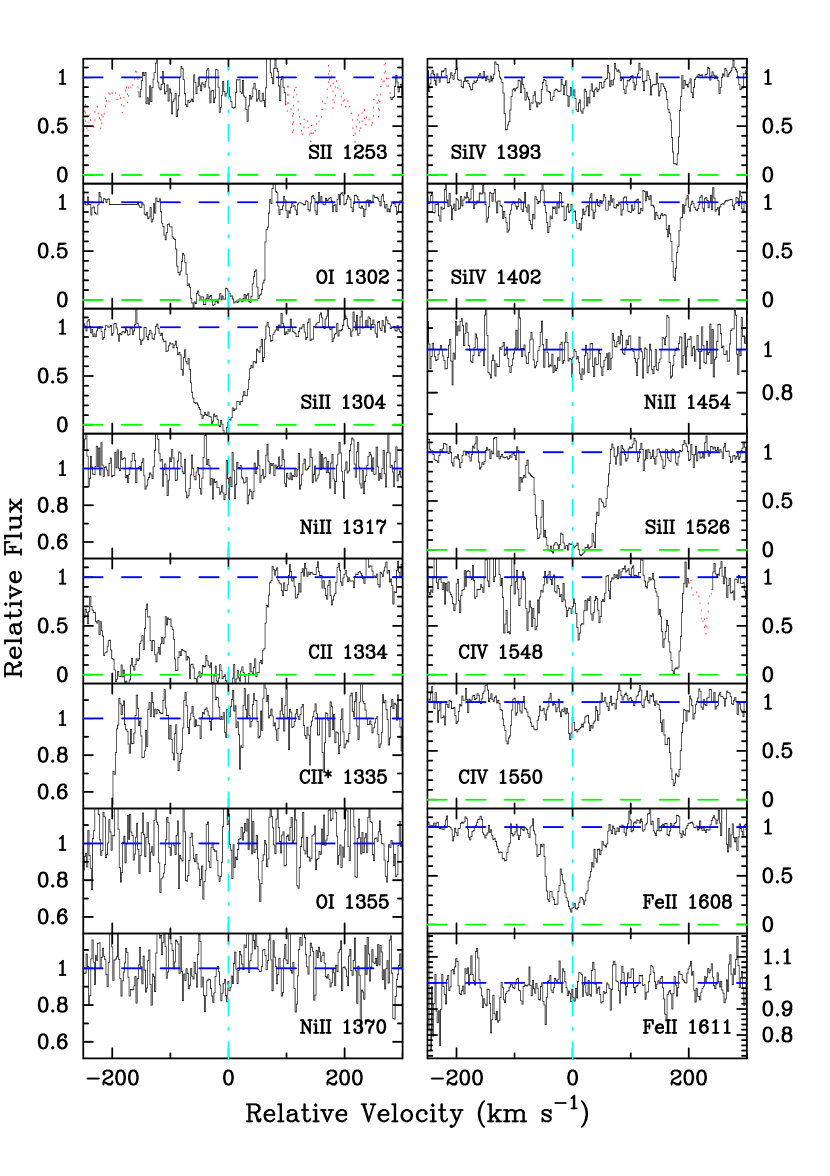
The very bright QSO HS0741+47 is taken from the Hamburg ESO QSO survey (Hagen et al., 1999). Our wavelength coverage of the damped Ly system spans from 36007500Å and we have identified over 20 metal-line profiles. Figure 12 plots the velocity profiles and Table 13 presents all of the measurements. Unfortunately, our observations do not include the Zn II and Cr II transitions, although the value indicates it would require very high S/N to obtain a measurement.
![[Uncaptioned image]](/html/astro-ph/0110350/assets/x14.png)
![[Uncaptioned image]](/html/astro-ph/0110350/assets/x16.png)
| Ion | AODM | [X/H] | ||
|---|---|---|---|---|
| HI | 1215 | |||
| C II | 1036 | |||
| C II | 1334 | |||
| C II | 1335 | |||
| C IV | 1548 | |||
| C IV | 1550 | |||
| O I | 971 | |||
| O I | 1302 | |||
| Al II | 1670 | |||
| Al III | 1854 | |||
| Si II | 1020 | |||
| Si II | 1260 | |||
| Si II | 1304 | |||
| Si II | 1526 | |||
| Si II | 1808 | |||
| Si IV | 1393 | |||
| Si IV | 1402 | |||
| P II | 1152 | |||
| S II | 1259 | |||
| Ar I | 1048 | |||
| Fe II | 1063 | |||
| Fe II | 1096 | |||
| Fe II | 1608 | |||
| Fe II | 1611 | |||
| Co II | 1574 | |||
| Ni II | 1317 | |||
| Ni II | 1370 | |||
| Ni II | 1454 | |||
| Ni II | 1709 | |||
| Ni II | 1741 |
| Ion | AODM | [X/H] | ||
|---|---|---|---|---|
| HI | 1215 | |||
| C II | 1334 | |||
| C II | 1335 | |||
| C IV | 1548 | |||
| O I | 1302 | |||
| O I | 1355 | |||
| Al III | 1854 | |||
| Al III | 1862 | |||
| Si II | 1304 | |||
| Si II | 1526 | |||
| Si II | 1808 | |||
| Si IV | 1393 | |||
| Si IV | 1402 | |||
| S II | 1253 | |||
| Ti II | 1910 | |||
| Cr II | 2056 | |||
| Cr II | 2066 | |||
| Fe II | 1608 | |||
| Fe II | 1611 | |||
| Co II | 1466 | |||
| Co II | 1574 | |||
| Ni II | 1317 | |||
| Ni II | 1370 | |||
| Ni II | 1454 | |||
| Ni II | 1703 | |||
| Ni II | 1709 | |||
| Ni II | 1741 | |||
| Ni II | 1751 | |||
| Zn II | 2026 |
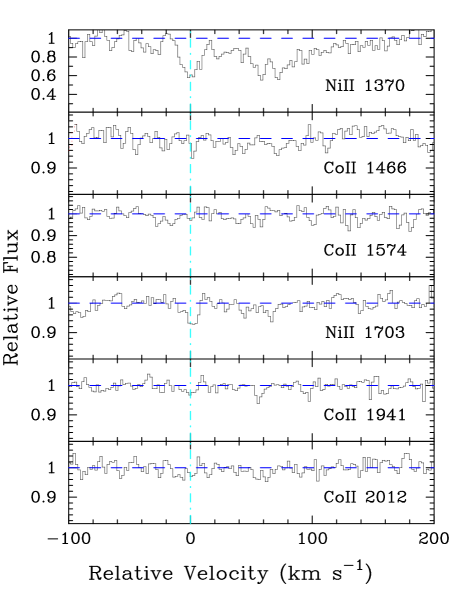
3.11 Q083611, = 2.465
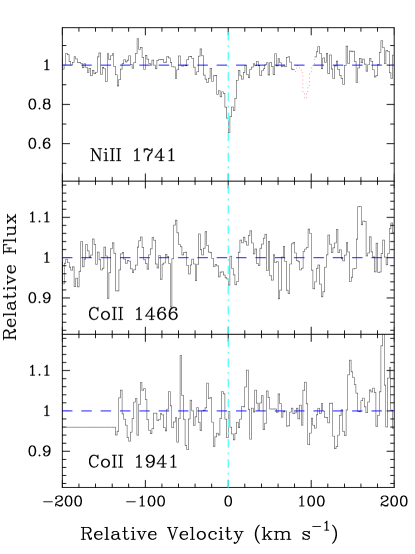
This damped Ly system is drawn from the LBQS survey (Wolfe et al., 1995) and we adopt the value obtained from their analysis. Our observations cover a large number of transitions, many of which only provide upper limits owing to the relatively poor S/N (Figure 13, Table 14). In passing, we note that some of the Ni II upper limits are in contradiction with our adopted value. This might reflect an error in the relative -values but more likely reflects the large error in the adopted value.
| Ion | AODM | [X/H] | ||
|---|---|---|---|---|
| HI | 1215 | |||
| Co II | 1466 | |||
| Co II | 1941 | |||
| Ni II | 1454 | |||
| Ni II | 1741 | |||
| Ni II | 1751 |
3.12 Q0841+12, = 2.375 and = 2.476
We augment the measurements presented in PW99 with a few additional Ni II transitions and several Co II and Ti II upper limits. These transitions are plotted in Figures 14 and 15 and tabulated in Tables 15 and 16. As discussed in PW99, we based the Fe abundance for the system on the saturated Fe II 1608 profile. We now choose to report the Fe II 1608 column density as a lower limit on and adopt an Fe abundance based on averaging the lower and upper limits from Fe II 1608 and Fe II 1611 respectively: .
| Ion | AODM | [X/H] | ||
|---|---|---|---|---|
| HI | 1215 | |||
| Ti II | 1910 | |||
| Fe II | 1608 | |||
| Fe II | 1611 | |||
| Co II | 1466 | |||
| Co II | 1941 | |||
| Co II | 2012 | |||
| Ni II | 1709 | |||
| Ni II | 1741 | |||
| Ni II | 1751 |
3.13 BRI095104, = 3.857 and = 4.203
Our combined spectrum now includes a second setup with significant coverage blueward of the Ly peak. Unfortunately, the new data adds only a few unblended transitions to the analysis (Figures 16,17 and Tables 17,18). With respect to PW99, we now suspect that the feature at km/s in the Ni II 1370 profile is unrelated to that transition and obtain an upper limit on . This value is in much better agreement with the Fe and Al abundances. In terms of the system at , we still have no reliable estimate of the Fe-peak abundance. The combination of poor S/N and low HI column density have resulted in the non-detection of Fe II 1608 and our observations did not cover C II 1334 or Al II 1670. Finally, we revise the oxygen abundance to account for the saturated OI 1302 profile.
| Ion | AODM | [X/H] | ||
|---|---|---|---|---|
| HI | 1215 | |||
| Co II | 1466 | |||
| Ni II | 1370 | |||
| Ni II | 1454 |
| Ion | AODM | [X/H] | ||
|---|---|---|---|---|
| HI | 1215 | |||
| C IV | 1548 | |||
| C IV | 1550 | |||
| O I | 1302 | |||
| Si II | 1190 | |||
| Si II | 1526 | |||
| Si IV | 1393 |
3.14 BRI095201, = 4.024
This damped Ly system was identified by Storrie-Lombardi et al. (1996) and confirmed with a follow-up LRIS spectrum by Storrie-Lombardi and Wolfe (2000). We adopt the value from the latter analysis. Figure 18 presents the velocity profiles covered by our single setup. Unfortunately, a mis-estimate of the absorption redshift coupled with several line blends have limited our ionic column density measurements of this system (Table 19). As reported in Prochaska & Wolfe (2000), we estimate the Fe+ column density by combining the unblended features observed for the Fe II 1144 and 1608 profiles. With the updated oscillator strengths, we find .
| Ion | AODM | [X/H] | ||
|---|---|---|---|---|
| HI | 1215 | |||
| C II | 1334 | |||
| C II | 1335 | |||
| C IV | 1550 | |||
| Si IV | 1393 | |||
| Fe II | 1144 | |||
| Fe II | 1608 | |||
| Co II | 1574 | |||
| Ni II | 1454 |
3.15 PSS095733, =3.279 and = 4.178
The two damped Ly systems toward this PSS quasar (Djorgovski et al., 1998) were discovered during the first night of our ongoing ESI project designed to discover and measure the metallicity of damped systems (PGW01). Given the apparent brightness of this quasar we chose to obtain a HIRES spectrum. Figures 19 and 20 present the metal-line transition identified in our HIRES spectrum and Tables 20 and 21 give the ionic column densities.
| Ion | AODM | [X/H] | ||
|---|---|---|---|---|
| HI | 1215 | |||
| C IV | 1548 | |||
| C IV | 1550 | |||
| Al II | 1670 | |||
| Al III | 1854 | |||
| Al III | 1862 | |||
| Si II | 1808 | |||
| Fe II | 1608 | |||
| Co II | 1941 | |||
| Ni II | 1709 | |||
| Ni II | 1741 | |||
| Zn II | 2026 |
| Ion | AODM | [X/H] | ||
|---|---|---|---|---|
| HI | 1215 | |||
| O I | 1302 | |||
| Al II | 1670 | |||
| Si II | 1304 | |||
| Si II | 1526 | |||
| Si IV | 1402 | |||
| S II | 1250 | |||
| S II | 1253 | |||
| Fe II | 1608 | |||
| Co II | 1466 | |||
| Co II | 1574 | |||
| Ni II | 1317 |
To test the metallicities obtained with the ESI spectrum, we can compare the HIRES values with the Fe+ column densities adopted in PGW01 after correcting for the new oscillator strengths. For the system at , the Fe II 1608 column densities are in excellent agreement but because this transition is blended with telluric absorption it might only provide an upper limit on . In PGW01, we derived the Fe+ column density from Fe II 2344 which is redward of our HIRES coverage. We now suspect this value was an underestimate of as it implies [Ni/Fe] dex. For now, we adopt an Fe+ column density based on the Fe II 1608 profile.
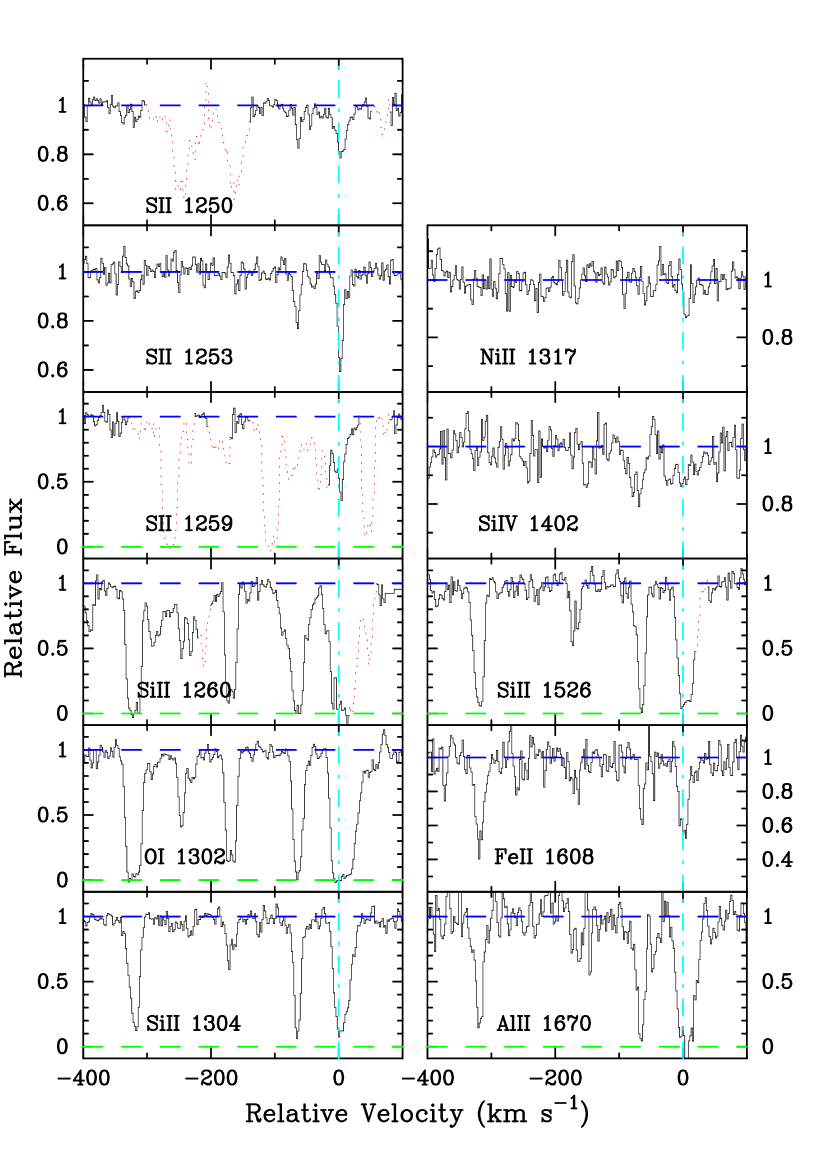
The system at presents a more worrisome picture regarding column densities derived from ESI echellette observations. Comparing the column densities for Fe II 1608, we find that we underestimated by dex with the ESI spectrum. It is somewhat puzzling given that the profile is not very strong (unlike the Si II profiles for example) and the quality of the ESI data is high. The strongest features are relatively narrow so the difference is probably an effect of the lower resolution. Another puzzling aspect of the systems is the S+ column density derived from S II 1250 and 1253. Although the S II 1250 profile is partially blended with an unrelated C IV system (), we are confident that the absorption at is free of contamination from the C IV system. In this case, provides a lower limit on . This lower limit, however, is well in excess of the value derived from the unblended S II 1253 transition. The component at km/s in the S II 1250 profile is wider than its counterpart in the S II 1253 profile, but there is no identifiable blend. Perhaps the difference suggests an extreme case of hidden saturation (Savage and Sembach, 1991). If it is line saturation, this helps explain why the ESI data significantly underestimates the column densities in this case and it also raises the possibility that the abundances derived from the HIRES observations are underestimates. This would be particularly surprising given that the spectra has a resolution of . Unfortunately, our HIRES spectrum did not cover any other pair of unsaturated transitions from the same ion to further test this issue. Furthermore, the difference even exists in a comparison of S II 1250 and 1253 with respect to the feature at km/s. Perhaps this is all the result of errors in the S II oscillator strengths, but it would have likely been identified by researchers who study the ISM (e.g. Howk, Savage, & Fabian, 1999).
3.16 BRI110807,
This damped Ly system was discovered and confirmed by Storrie-Lombardi et al. (1996). The quasar is relatively bright and we obtained a reasonably high S/N HIRES spectrum. Figure 21 presents the velocity profiles and Table 22 lists the ionic column densities. The Fe+ and Si+ column densities are well measured and indicate a very large Si/Fe ratio, perhaps indicative of substantial Type II SN enrichment.
| Ion | AODM | [X/H] | ||
|---|---|---|---|---|
| HI | 1215 | |||
| C II | 1334 | |||
| C II | 1335 | |||
| C IV | 1548 | |||
| C IV | 1550 | |||
| O I | 1302 | |||
| Al II | 1670 | |||
| Si II | 1304 | |||
| Si II | 1526 | |||
| Si II | 1808 | |||
| Si IV | 1402 | |||
| Fe II | 1608 | |||
| Fe II | 1611 | |||
| Ni II | 1317 | |||
| Ni II | 1751 |
3.17 Q1210+17,
This system is a member of the LBQS sample and we have adopted the value from their analysis. We plot all of the transitions covered by our observations in Figure 22 and list the column densities in Table 23. This damped system exhibits a relatively low Zn/Fe ratio which suggests it is largely free of dust depletion. In passing, we note a remarkable similarity of the relative abundances of Si, Ni, Cr, Fe, and Zn with the same pattern observed by Molaro et al. (2000) for the damped system toward Q000026, albeit at a much higher metallicity.
| Ion | AODM | [X/H] | ||
|---|---|---|---|---|
| HI | 1215 | |||
| C IV | 1548 | |||
| C IV | 1550 | |||
| Al II | 1670 | |||
| Al III | 1854 | |||
| Al III | 1862 | |||
| Si II | 1526 | |||
| Si II | 1808 | |||
| Si IV | 1393 | |||
| Cr II | 2056 | |||
| Cr II | 2062 | |||
| Cr II | 2066 | |||
| Fe II | 1608 | |||
| Fe II | 1611 | |||
| Co II | 1574 | |||
| Co II | 2012 | |||
| Ni II | 1370 | |||
| Ni II | 1454 | |||
| Ni II | 1709 | |||
| Ni II | 1741 | |||
| Ni II | 1751 | |||
| Zn II | 2026 | |||
| Zn II | 2062 |
![[Uncaptioned image]](/html/astro-ph/0110350/assets/x26.png)
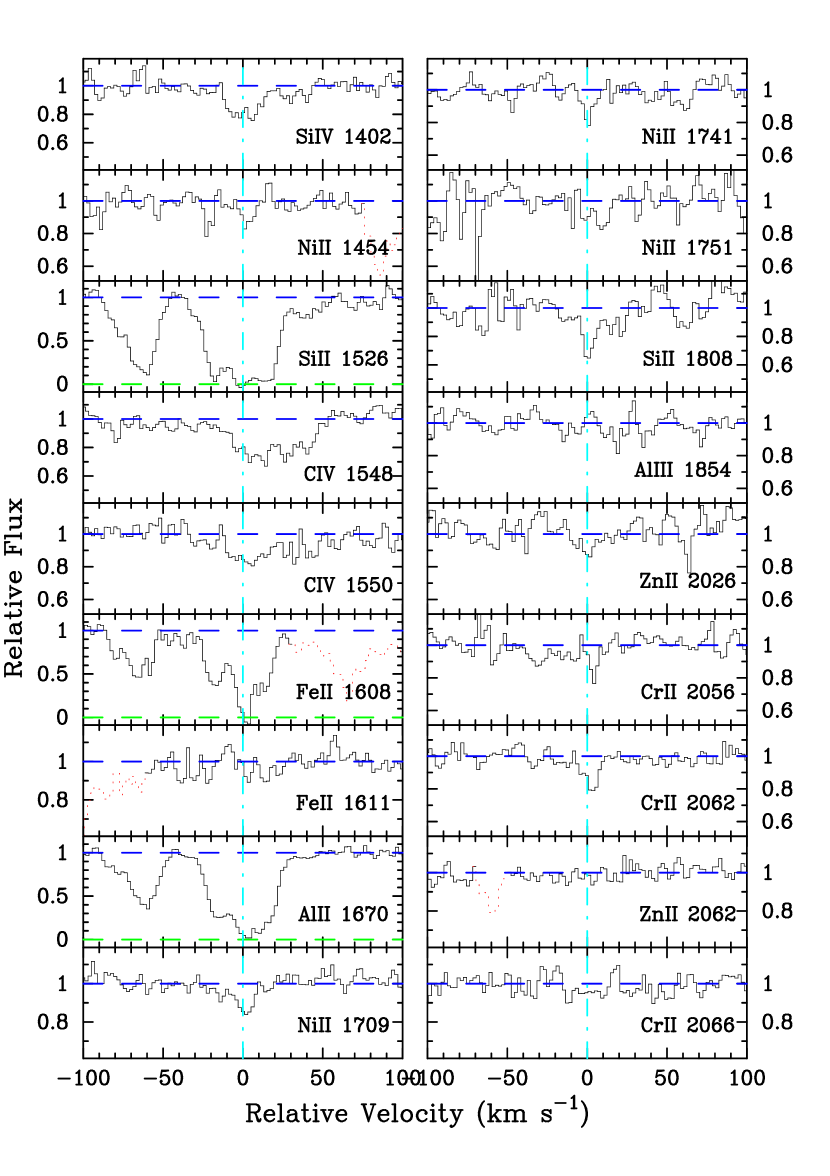
3.18 Q121533, = 1.999
Although we presented a full analysis of this damped system in PW99, a number of transitions were overlooked and we have revised the Fe abundance. Figure 23 plots the new transitions and Table 24 lists the ionic column densities. We now report only a limit on because the Fe II 1608 profile is saturated and the Fe II 1611 transition is too weak to provide a reasonable measurement. In the subsequent analysis, we assume a value based on an average of the two limits: . Finally, we also report an upper limit on based on the Zn II 2062 profile. It is 0.2 dex lower than the value derived from Zn II 2026 which is difficult to understand aside from the fact that the Zn II 2026 profile is noisy and the continuum is poorly constrained in that region. For now, we continue to adopt the value from Zn II 2026.
| Ion | AODM | [X/H] | ||
|---|---|---|---|---|
| HI | 1215 | |||
| C II | 1334 | |||
| C II | 1335 | |||
| O I | 1302 | |||
| O I | 1355 | |||
| Si II | 1304 | |||
| Si II | 1526 | |||
| Si II | 1808 | |||
| Fe II | 1608 | |||
| Fe II | 1611 | |||
| Co II | 1466 | |||
| Co II | 1574 | |||
| Ni II | 1709 | |||
| Ni II | 1741 | |||
| Ni II | 1751 | |||
| Zn II | 2026 | |||
| Zn II | 2062 |
![[Uncaptioned image]](/html/astro-ph/0110350/assets/x29.png)
3.19 Q122317, = 2.466
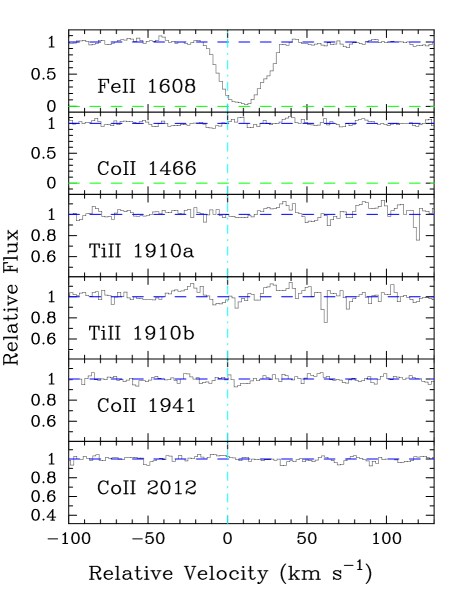
The combination of a very large value and extensive wavelength coverage allows for the analysis of a terrific number of transitions. Figure 24 and Table 25 present over 20 transitions including a large number of limits. One of the most interesting ratios is Ti/Fe whose upper limit is less than 1/2 the solar value ([Ti/Fe] ). In general, a subsolar Ti/Fe ratio implies significant dust depletion because Ti is more readily locked up into dust grains, but the Zn/Fe ratio is not particularly large as one would expect in a significantly dust depleted region ([Zn/Fe] = +0.22). Our observations also place a tight constraint on Co/Fe which is described in greater detail in Ellison et al. (2001).
| Ion | AODM | [X/H] | ||
|---|---|---|---|---|
| HI | 1215 | |||
| C I | 1656 | |||
| C II | 1334 | |||
| C II | 1335 | |||
| C IV | 1548 | |||
| C IV | 1550 | |||
| O I | 1302 | |||
| Al III | 1862 | |||
| Si II | 1526 | |||
| Si II | 1808 | |||
| Si IV | 1402 | |||
| P II | 1152 | |||
| Ti II | 1910 | |||
| Cr II | 2056 | |||
| Cr II | 2062 | |||
| Cr II | 2066 | |||
| Fe II | 1133 | |||
| Fe II | 1142 | |||
| Fe II | 1611 | |||
| Co II | 1466 | |||
| Co II | 1574 | |||
| Co II | 1941 | |||
| Co II | 2012 | |||
| Ni II | 1317 | |||
| Ni II | 1703 | |||
| Ni II | 1709 | |||
| Ni II | 1751 | |||
| Zn II | 2026 | |||
| Zn II | 2062 |
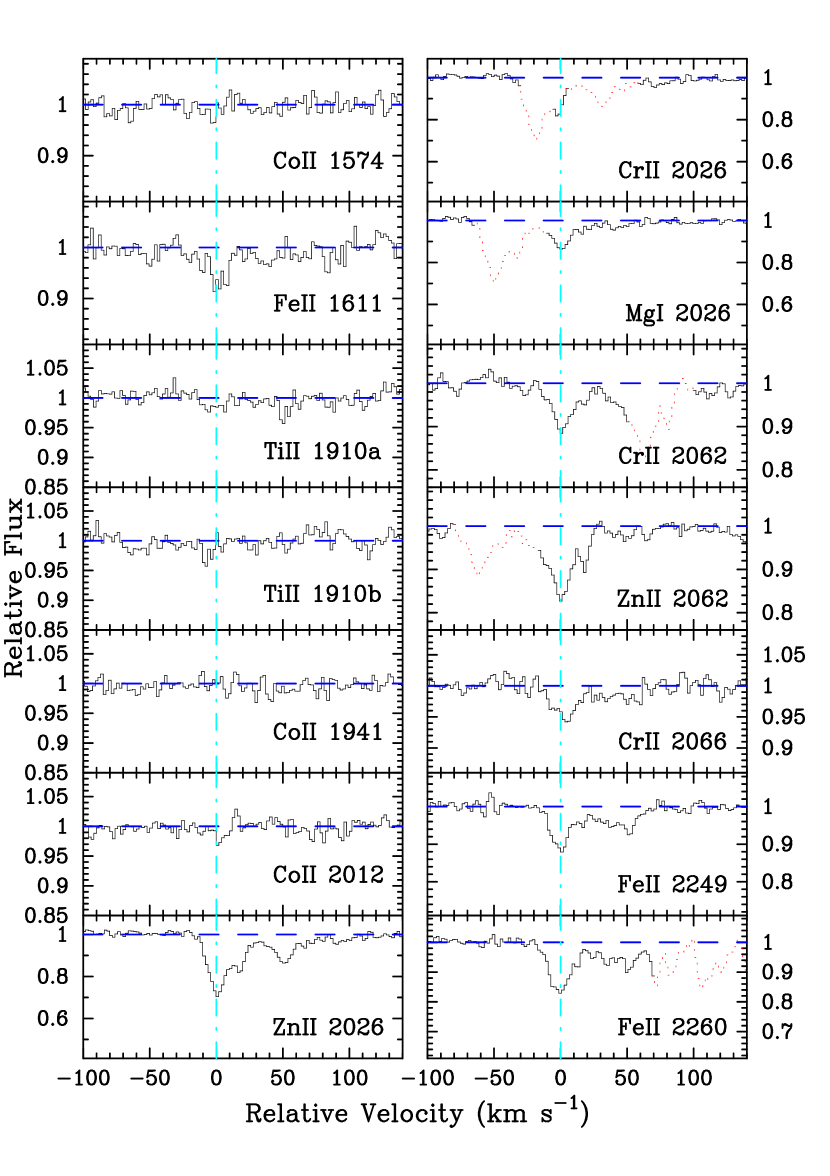
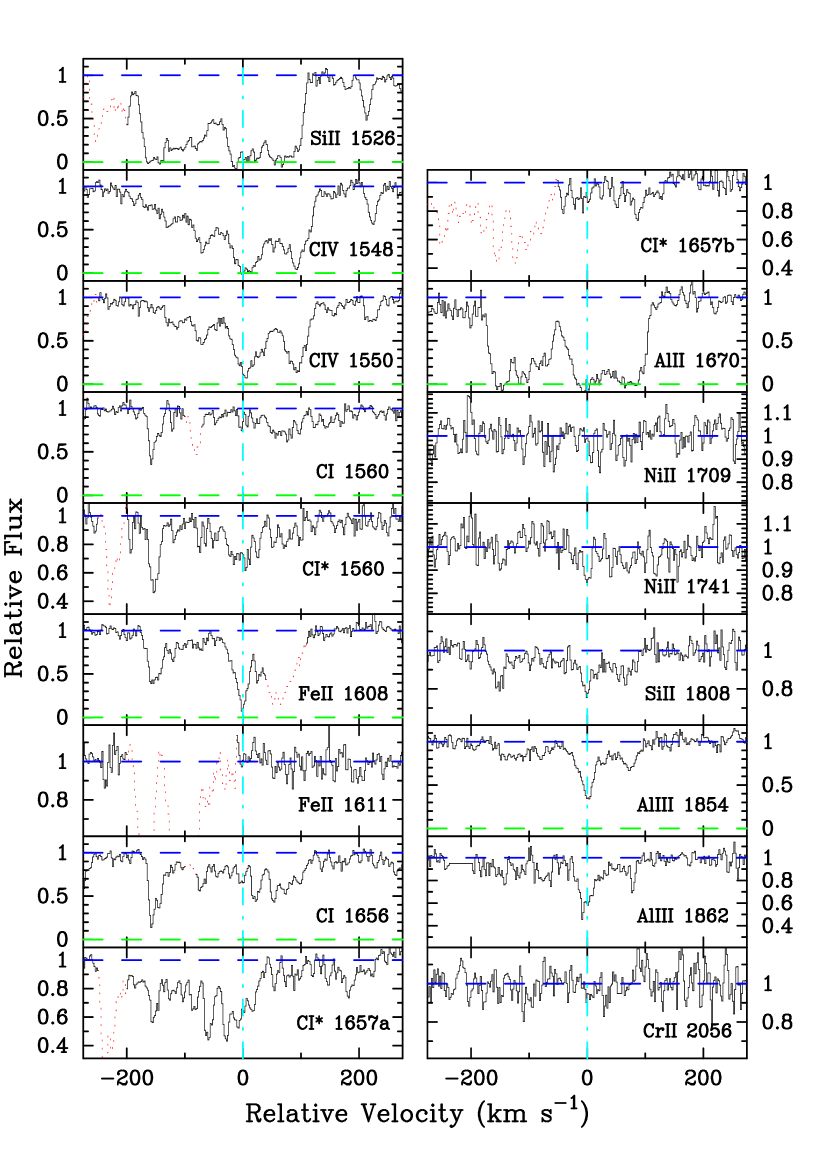
3.20 Q133117, = 1.776
An analysis of the damped system toward the very bright quasar Q1331+17 was given by PW99 but a number of transitions were missed (notably Ti II 1910 and Co II 2012). The new transitions are plotted in Figure 25 and the ionic column densities are given in Table 26.
With respect to the value presented by PW99, this system exhibits one of the largest Zn/Fe ratios of any damped system. This value is nearly 0.3 dex higher than the value reported in Pettini et al. (1994), however, because we did not correct for possible contamination from the Mg I 2026 transition. Although a significant feature is apparent at of the Mg I 2026 profile, this feature is perfectly aligned with an absorption feature at in the unsaturated Fe II profiles. Furthermore, the value from Zn II 2062 is identical to the value derived from Zn II 2026 using the AODM method. We suspect, however, that this is a coincidence resulting from blending between the Zn II 2062 and Cr II 2062 profiles. Performing a detailed line-profile analysis of the Zn and Cr lines and including Mg I 2026, we find and . We discuss this issue further and its impact on studies of Zn in Paper II, 2.1.6.
| Ion | AODM | [X/H] | ||
|---|---|---|---|---|
| HI | 1215 | |||
| C I | 1560 | |||
| C I | 1656 | |||
| Mg I | 2026 | |||
| Ti II | 1910 | |||
| Cr II | 2056 | |||
| Cr II | 2066 | |||
| Fe II | 1608 | |||
| Fe II | 1611 | |||
| Fe II | 2249 | |||
| Fe II | 2260 | |||
| Fe II | 2344 | |||
| Fe II | 2374 | |||
| Fe II | 2382 | |||
| Co II | 1574 | |||
| Co II | 1941 | |||
| Co II | 2012 | |||
| Zn II | 2026 |
In addition to the large Zn/Fe ratio, this system shows rarely observed C I absorption and a significant subsolar Ti/Fe ratio. Altogether the chemical abundances of this system represent the most compelling evidence for dust depletion in any damped Ly system. It is particularly important to note, therefore, that it is one of the brightest (apparent magnitude) quasars observed in our sample. In Paper II, 5 we consider the obscuration of this quasar due to this damped system and the implications for dust obscuration in general.
This damped Ly system is one of the few cases where one can derive values from both Fe II 1608 and 1611. Furthermore, our observations also cover several of the Fe II transitions longward of 2000Å, including Fe II 2249 and 2260 which are the principal diagnostics of Fe+ in the Galactic ISM. Examining Table 26, one notes that nearly all of the values are consistent at the level and all are in accordance at . One also notes that exceeds all of the other measurements suggesting it is unlikely the Raassen & Uylings (1998) analysis overestimated the Fe II 1611 oscillator strength, at least relative to the other Fe II transitions.
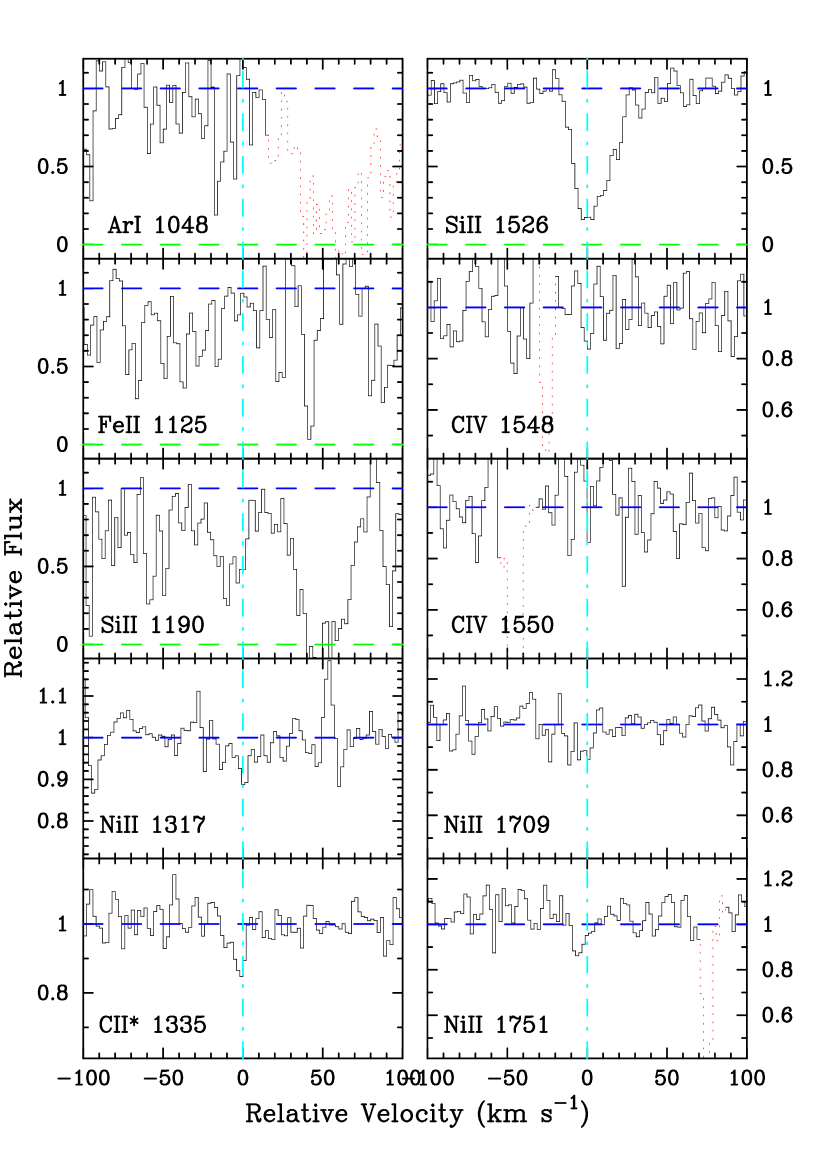
3.21 BRI134603, = 3.736
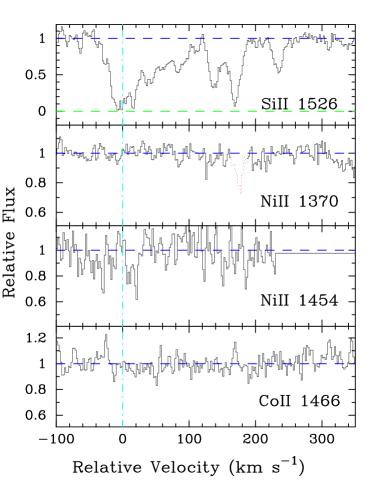
Our additional observations blueward of the data presented in PW99 provide coverage of a few new transitions (Figure 26, Table 27). Unfortunately, we still do not have coverage of a single unsaturated Fe II profile or any other Fe-peak metal transition. Therefore, we have adopted Al as a proxy for Fe (i.e. assume [Fe/H] = [Al/H]) and in this manner include the system in the metallicity and relative abundance analyses of Paper II. The implied Si/Fe ratios match typical values. If the feature at in the Ni II 1317 profile is not noise or a coincident metal line, it implies a very large Ni/Al ratio indicating we might be underestimating . For the moment, we consider it as an upper limit.
Our new observations also cover the C IV doublet at 1550Å. Although the spectra is particularly noisy over this region, there is no obvious C IV absorption. This marks the first DLA system with no detectable C IV absorption and we note in passing a possible trend of weaker C IV absorption at .
| Ion | AODM | [X/H] | ||
|---|---|---|---|---|
| HI | 1215 | |||
| C II | 1335 | |||
| C IV | 1548 | |||
| C IV | 1550 | |||
| O I | 1302 | |||
| Si II | 1190 | |||
| Si II | 1304 | |||
| Si II | 1526 | |||
| Ar I | 1048 | |||
| Fe II | 1125 | |||
| Co II | 1574 | |||
| Ni II | 1317 | |||
| Ni II | 1370 | |||
| Ni II | 1709 | |||
| Ni II | 1741 | |||
| Ni II | 1751 |
![[Uncaptioned image]](/html/astro-ph/0110350/assets/x33.png)
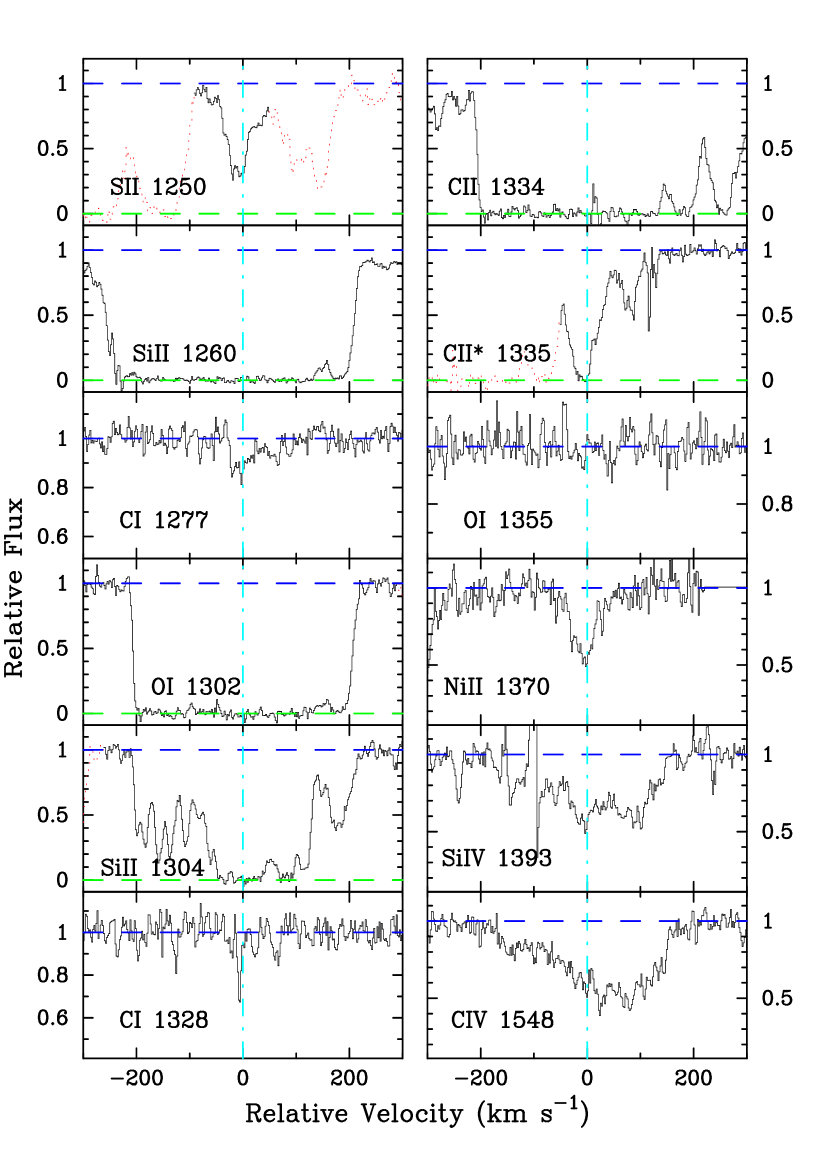
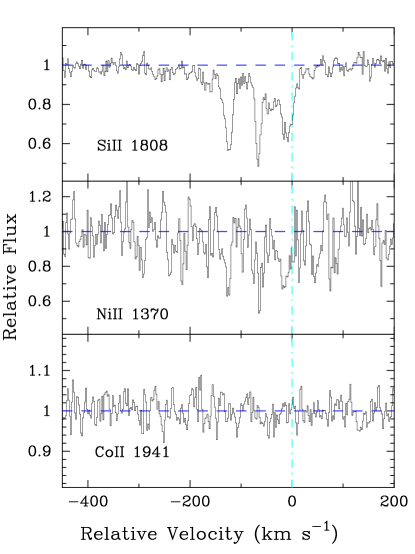
3.22 PSS144327, = 4.224
This damped Ly systems was discovered by Storrie-Lombardi and Wolfe (2000) who determined the value from a spectrum obtained using LRIS at Keck observatories. Its very high metallicity was first reported in Prochaska & Wolfe (2000) We have since acquired further observations of this system which confirm the [Fe/H] metallicity. In particular, we observed the Ni II 1370, 1709, and 1741 transitions at reasonably high S/N and found [Ni/H] [Fe/H]. Figure 27 presents the transitions observed for this system and the ionic column densities are presented in Table 28.
In passing, we note the remarkable C II∗ 1335 profile which is heavily saturated and suggests a large star formation rate for this system (Wolfe, Prochaska, & Gawiser, 2001). Also, we identify possible absorption from two C I profiles which we expect is not due to coincident metal-line systems. Unfortunately our observations did not cover the stronger C II 1556 profile and strongest C I 1656 profile is located within a forest of sky lines.
| Ion | AODM | [X/H] | ||
|---|---|---|---|---|
| HI | 1215 | |||
| C I | 1277 | |||
| C I | 1328 | |||
| C I | 1656 | |||
| C II | 1334 | |||
| C II | 1335 | |||
| C IV | 1548 | |||
| C IV | 1550 | |||
| O I | 1302 | |||
| O I | 1355 | |||
| Al II | 1670 | |||
| Si II | 1304 | |||
| Si IV | 1393 | |||
| S II | 1253 | |||
| Fe II | 1608 | |||
| Fe II | 1611 | |||
| Co II | 1574 | |||
| Ni II | 1370 | |||
| Ni II | 1709 | |||
| Ni II | 1741 |
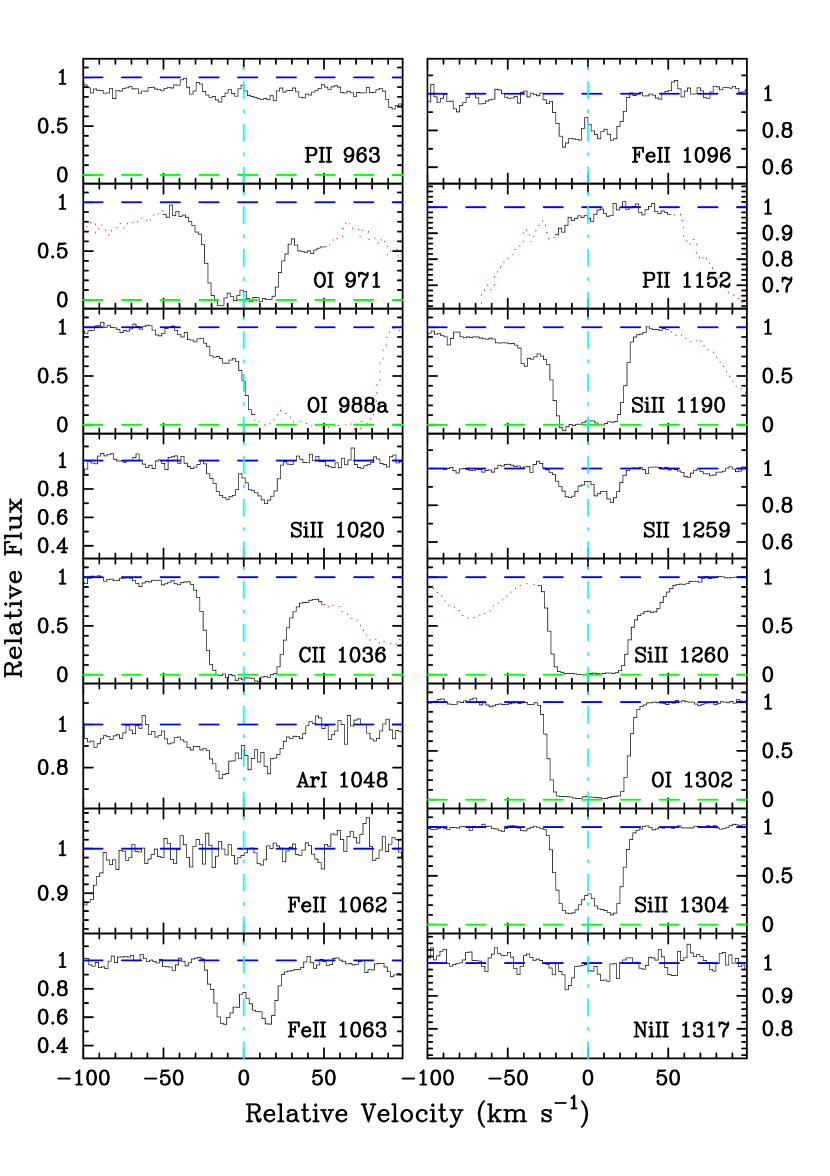
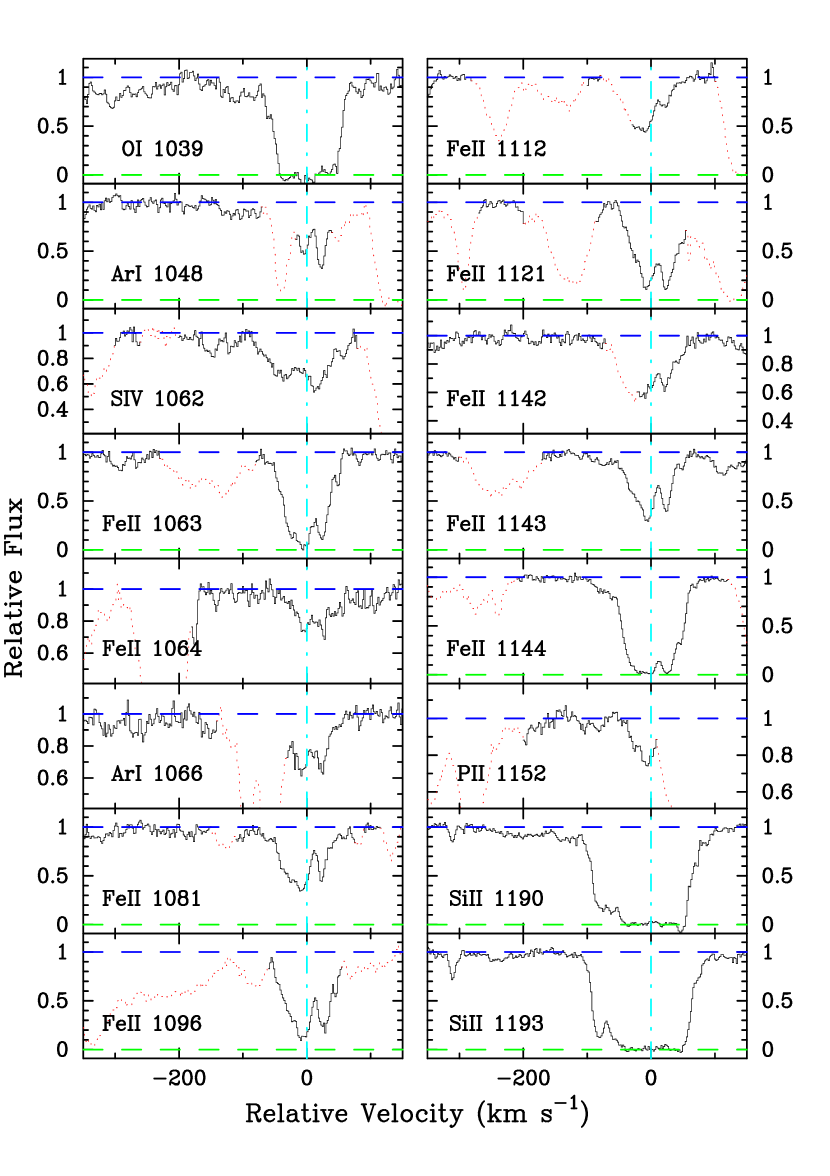
3.23 Q175975, = 2.625
This system was presented in PW99 and has been subsequently analysed by Outram, Chaffee, & Carswell (1999). Here, we present an analysis of our spectrum blueward of Ly emission. Figure 28 presents the transitions and Table 29 the column densities.
Our observations present measurements of a number of lines in the Ly forest. In particular, we have excellent coverage of the FUV Fe II transitions, good measurements of the N I triplets at 1134 and 1200Å , moderate limits on Ar I and O I, and an excellent measurement of . Regarding the Fe II lines, we find very good agreement between the many transitions which confirms the -values measured by Howk et al. (2000). The only exception is Fe II 1062 (not analysed by Howk et al.) whose -value appears to be systematically high. We recommend using a value dex below the value reported by Morton (1991). Finally, we point out significant absorption at km/s in the Si II 1190 and 1193 transitions which coincide with a strong feature in C IV and a weaker feature in Al II 1670 (PW99). We suspect this metal-line system corresponds to a nearby Lyman limit system although there is no significant evidence for asymmetry in the Ly profile.
| Ion | AODM | [X/H] | ||
|---|---|---|---|---|
| HI | 1215 | |||
| C I | 1656 | |||
| C II | 1334 | |||
| C II | 1335 | |||
| O I | 1039 | |||
| O I | 1302 | |||
| Si II | 1190 | |||
| Si II | 1193 | |||
| Si II | 1260 | |||
| Si II | 1304 | |||
| Si II | 1808 | |||
| P II | 1152 | |||
| S II | 1250 | |||
| S II | 1253 | |||
| S II | 1259 | |||
| Ar I | 1048 | |||
| Ar I | 1066 | |||
| Fe II | 1062 | |||
| Fe II | 1063 | |||
| Fe II | 1063 | |||
| Fe II | 1081 | |||
| Fe II | 1096 | |||
| Fe II | 1112 | |||
| Fe II | 1121 | |||
| Fe II | 1142 | |||
| Fe II | 1143 | |||
| Fe II | 1144 | |||
| Fe II | 1608 | |||
| Fe II | 1611 | |||
| Co II | 1466 | |||
| Co II | 1466 | |||
| Co II | 1574 | |||
| Ni II | 1317 | |||
| Ni II | 1370 | |||
| Ni II | 1454 | |||
| Ni II | 1703 | |||
| Ni II | 1709 | |||
| Ni II | 1741 | |||
| Ni II | 1751 |
![[Uncaptioned image]](/html/astro-ph/0110350/assets/x35.png)
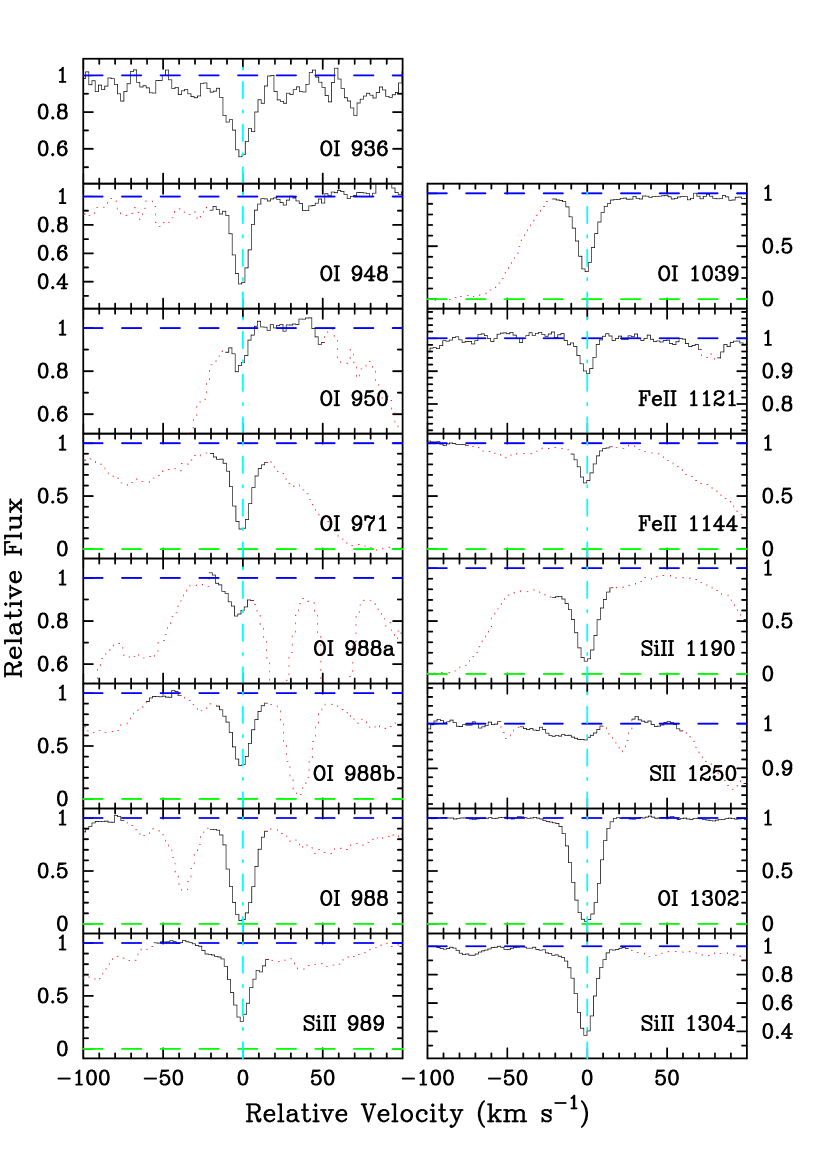
3.24 Q1946+76, = 2.844
Kirkman & Tytler (1997) analysed this very high S/N spectrum of Q1946+76 to describe the Ly forest at . Here, we analyse the metal-line transitions for the system at , ignoring the probably damped Ly system at because we have no measure of its HI column density. Figure 29 presents the metal-line profiles for the system and Table 30 summarizes the column density measurements. For the HI column density we adopt the value presented in L96. This systems is notable for providing one of the few cases where one can accurately determine . The observed O/Fe ratio is enhanced relative to solar, but at a lower level than metal-poor halo stars with comparable metallicity. Interestingly, the implied O/Si ratio is sub-solar which is almost never observed in metal-poor stars. Nevertheless, we believe the value is accurate. In a separate paper, we examine the N/O ratio of this system.
| Ion | AODM | [X/H] | ||
|---|---|---|---|---|
| HI | 1215 | |||
| O I | 936 | |||
| O I | 948 | |||
| O I | 971 | |||
| O I | 988 | |||
| O I | 988 | |||
| O I | 988 | |||
| O I | 1039 | |||
| O I | 1302 | |||
| Si II | 1190 | |||
| Si II | 1304 | |||
| S II | 1250 | |||
| Fe II | 1121 | |||
| Fe II | 1144 |

| Ion | AODM | [X/H] | ||
|---|---|---|---|---|
| HI | 1215 | |||
| Al II | 1670 | |||
| Si II | 1526 | |||
| Si II | 1808 | |||
| Ti II | 1910 | |||
| Cr II | 2056 | |||
| Cr II | 2066 | |||
| Fe II | 1608 | |||
| Fe II | 1611 | |||
| Co II | 1574 | |||
| Co II | 1941 | |||
| Co II | 2012 | |||
| Ni II | 1370 | |||
| Ni II | 1703 | |||
| Ni II | 1709 | |||
| Ni II | 1741 | |||
| Ni II | 1751 | |||
| Zn II | 2026 |
| Ion | AODM | [X/H] | ||
|---|---|---|---|---|
| HI | 1215 | |||
| C II | 1334 | |||
| C II | 1335 | |||
| C IV | 1548 | |||
| C IV | 1550 | |||
| O I | 1302 | |||
| Al II | 1670 | |||
| Al III | 1854 | |||
| Al III | 1862 | |||
| Si II | 1304 | |||
| Si IV | 1402 | |||
| Cr II | 2056 | |||
| Cr II | 2062 | |||
| Fe II | 1608 | |||
| Fe II | 1611 | |||
| Ni II | 1709 | |||
| Ni II | 1751 | |||
| Zn II | 2026 |
3.25 Q220619, = 1.920 and = 2.076
In Figures 30 and 31 we show a number of transitions left unanalysed by Prochaska & Wolfe (1997) and PW99 for the two damped Ly systems toward Q2206–19. Furthermore, we now consider only ionic column densities measured with the apparent optical depth method in order to coincide with the rest of the database. As we showed in Prochaska & Wolfe (1997), there is very little difference between the abundances derived from a Voigt profile analysis and the AODM. All of the values are listed in Tables 31 and 32.
3.26 Q223002, = 1.864
This system was extensively analysed in PW99. We simply add a limit on from the Co II 1941 transition and a measurement for Ni II 1370 (Figure 32). We also include the new values for as the extensive wavelength coverage provides a comparison between the Fe II 1611, 2249, and 2260 transitions. All three values are in good agreement which indicates the relative -values are reasonably accurate.
| Ion | AODM | [X/H] | ||
|---|---|---|---|---|
| HI | 1215 | |||
| Fe II | 1608 | |||
| Fe II | 1611 | |||
| Fe II | 2249 | |||
| Fe II | 2260 | |||
| Fe II | 2344 | |||
| Fe II | 2374 | |||
| Fe II | 2382 | |||
| Co II | 1941 | |||
| Ni II | 1370 | |||
| Ni II | 1709 | |||
| Ni II | 1741 | |||
| Ni II | 1751 |
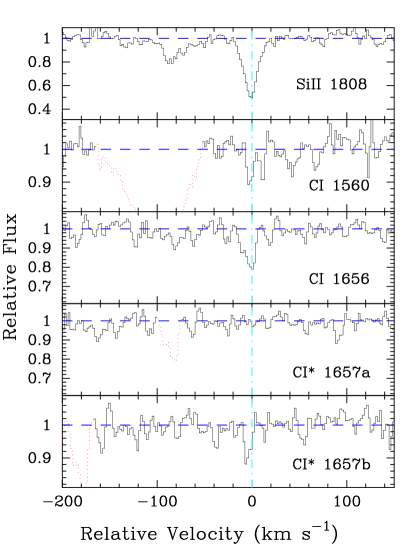
3.27 Q223100, = 2.066
This damped system was analysed in PW99. At the time we considered possible absorption from the C I 1656 and C I∗ 1657 transitions but were unconvinced that the profiles were associated with the damped Ly system. Figure 33 presents the two transitions and the Si II 1808 profile for comparison. We are now reasonably confident that these profiles arise in the damped Ly system and their relative strengths place constraints on the temperature of the CMB at this redshift (Prochaska, O’Meara, & Wolfe, 2001c).
| Ion | AODM | [X/H] | ||
|---|---|---|---|---|
| HI | 1215 | |||
| C I | 1656 | |||
| C I | 1657 | |||
| Co II | 1941 |
![[Uncaptioned image]](/html/astro-ph/0110350/assets/x42.png)
Figure 34 – cont
3.28 Q2344+12, = 2.538
This system has been observed previously by Lu, Sargent, & Barlow (1999) and they presented an [Fe/H] metallicity and value. We adopt their measurement of the HI column density and have an independent measurement of from several FUV Fe II transitions. In addition, our blue spectra cover a number of transitions in the Ly forest (Figure 34, Table 35).
| Ion | AODM | [X/H] | ||
|---|---|---|---|---|
| HI | 1215 | |||
| C II | 1334 | |||
| C II | 1335 | |||
| O I | 988 | |||
| O I | 1302 | |||
| O I | 1355 | |||
| Si II | 1190 | |||
| Si II | 1193 | |||
| Si II | 1260 | |||
| Si II | 1304 | |||
| Si IV | 1393 | |||
| P II | 1152 | |||
| S II | 1250 | |||
| Ar I | 1066 | |||
| Fe II | 1063 | |||
| Fe II | 1096 | |||
| Fe II | 1143 | |||
| Ni II | 1317 | |||
| Ni II | 1370 |
3.29 Q234801, = 2.426 and = 2.615
The two damped systems along this sightline were first identified by Turnshek et al. (1989) and are both part of the LBQS statistical sample. This quasar is very faint and the S/N of our 4.5hr spectrum is relatively poor. Figures 35,36 and Tables 36,37 present the transitions and column densities for the two systems. With respect to the system at , the Fe II 1608 profile is blended at km/s and we estimate the value by integrating this profile at km/s. Therefore the value is strictly a lower limit, although the Fe II 1611 indicates that the column density at km/s is less than . The system at is special for showing absorption from C I and C I∗. In a companion paper, we analyse these transitions to place a limit on the temperature of the cosmic microwave background radiation at (Prochaska, O’Meara, & Wolfe, 2001c). The system at is notable for exhibiting a very low metallicity ([Fe/H] , [Ni/H] ). In fact, this is the only system with which also has a metallicity less than 1/100 solar. For the Fe+ column density, we have averaged the lower and upper limits established by Fe II 1608 and 1611 respectively.
| Ion | AODM | [X/H] | ||
|---|---|---|---|---|
| HI | 1215 | |||
| C IV | 1548 | |||
| C IV | 1550 | |||
| Al II | 1670 | |||
| Al III | 1854 | |||
| Al III | 1862 | |||
| Si II | 1526 | |||
| Si II | 1808 | |||
| Cr II | 2056 | |||
| Fe II | 1608 | |||
| Ni II | 1709 | |||
| Ni II | 1741 |
| Ion | AODM | [X/H] | ||
|---|---|---|---|---|
| HI | 1215 | |||
| C IV | 1548 | |||
| C IV | 1550 | |||
| Al II | 1670 | |||
| Al III | 1854 | |||
| Si II | 1526 | |||
| Si II | 1808 | |||
| Si IV | 1402 | |||
| Cr II | 2056 | |||
| Cr II | 2062 | |||
| Fe II | 1608 | |||
| Fe II | 1611 | |||
| Ni II | 1454 | |||
| Ni II | 1709 | |||
| Ni II | 1741 | |||
| Zn II | 2026 |
3.30 Q234814, = 2.279
The abundances for this damped system were first measured by Pettini et al. (1995) and subsequently by PW99. We now include a limit on from the non-detection of two Ni II transitions (Figure 37, Table 38).
| Ion | AODM | [X/H] | ||
|---|---|---|---|---|
| HI | 1215 | |||
| Ni II | 1709 | |||
| Ni II | 1741 | |||
| Ni II | 1751 |
3.31 Q235902, =2.095 & =2.154
Although these two systems were analysed in PW99, we have now identified several new profiles including measurements for C II∗ 1335 for the two systems. The C II∗ column density for the is very high and as we discuss in Wolfe, Prochaska, & Gawiser (2001) may indicate a high star formation rate in this damped Ly system. The C II∗ profile is within the Ly forest, however, and may be significantly blended with a Ly forest cloud. We also report a tentative measurement of Ti II 1910 for the system at . Given the very large Zn/Fe ratio for this system, the enhanced Ti/Fe ratio is strongly suggestive of Type II SN enrichment. Figures 38,39 present all of the new transitions and Tables 39,40 list the column densities.
| Ion | AODM | [X/H] | ||
|---|---|---|---|---|
| HI | 1215 | |||
| C II | 1334 | |||
| C II | 1335 | |||
| Ti II | 1910 | |||
| Co II | 1574 | |||
| Co II | 2012 |
| Ion | AODM | [X/H] | ||
|---|---|---|---|---|
| HI | 1215 | |||
| C II | 1334 | |||
| C II | 1335 | |||
| Si II | 1304 | |||
| Ni II | 1703 |
4 SUMMARY
Tables 41 and 42 present a summary of the absolute and relative abundances of the 38 damped Ly systems in our complete database. Regarding Table 42 where we present abundances relative to Fe, in a few cases we have considered Ni, Cr, or Al as a proxy for Fe, as noted.
We have presented ionic column density measurements for our complete sample of damped Ly systems. With the exception of a few important transitions which exhibit blends with other profiles, we have measured each column density with the apparent optical depth method. In general, therefore, all of the data has been reduced and analysed with an identical approach. We have used the most up to date atomic data and will continue to update the database as new information becomes available. Visit http://kingpin.ucsd.edu/hiresdla for tables, figures and updated measurements. A series of companion papers, in particular Paper II present new scientific results based on this database.
| Name | [C/H] | [O/H] | [Al/H] | [Si/H] | [P/H] | [S/H] | [Ar/H] | [Ti/H] | [Cr/H] | [Fe/H] | [Co/H] | [Ni/H] | [Zn/H] | ||
|---|---|---|---|---|---|---|---|---|---|---|---|---|---|---|---|
| Q0000-2619 | 3.390 | 21.41 | |||||||||||||
| BR0019-15 | 3.439 | 20.92 | |||||||||||||
| PH957 | 2.309 | 21.40 | |||||||||||||
| Q0149+33 | 2.141 | 20.50 | |||||||||||||
| Q0201+36 | 2.463 | 20.38 | |||||||||||||
| J0255+00 | 3.253 | 20.70 | |||||||||||||
| J0255+00 | 3.915 | 21.30 | |||||||||||||
| Q0336-01 | 3.062 | 21.20 | |||||||||||||
| Q0347-38 | 3.025 | 20.80 | |||||||||||||
| Q0458-02 | 2.040 | 21.65 | |||||||||||||
| HS0741+4741 | 3.017 | 20.48 | |||||||||||||
| Q0836+11 | 2.465 | 20.58 | |||||||||||||
| Q0841+12 | 2.375 | 20.95 | |||||||||||||
| Q0841+12 | 2.476 | 20.78 | |||||||||||||
| BRI0951-04 | 3.857 | 20.60 | |||||||||||||
| BRI0951-04 | 4.203 | 20.40 | |||||||||||||
| BRI0952-01 | 4.024 | 20.55 | |||||||||||||
| PSS0957+33 | 3.279 | 20.32 | |||||||||||||
| PSS0957+33 | 4.178 | 20.50 | |||||||||||||
| BRI1108-07 | 3.608 | 20.50 | |||||||||||||
| Q1210+17 | 1.892 | 20.60 | |||||||||||||
| Q1215+33 | 1.999 | 20.95 | |||||||||||||
| Q1223+17 | 2.466 | 21.50 | |||||||||||||
| Q1331+17 | 1.776 | 21.18 | |||||||||||||
| BRI1346-03 | 3.736 | 20.72 | |||||||||||||
| PSS1443+27 | 4.224 | 20.80 | |||||||||||||
| Q1759+75 | 2.625 | 20.80 | |||||||||||||
| Q1946+7658 | 2.844 | 20.27 | |||||||||||||
| Q2206-19 | 1.920 | 20.65 | |||||||||||||
| Q2206-19 | 2.076 | 20.43 | |||||||||||||
| Q2230+02 | 1.864 | 20.85 | |||||||||||||
| Q2231-002 | 2.066 | 20.56 | |||||||||||||
| Q2344+12 | 2.538 | 20.36 | |||||||||||||
| Q2348-01 | 2.426 | 20.50 | |||||||||||||
| Q2348-01 | 2.615 | 21.30 | |||||||||||||
| Q2348-14 | 2.279 | 20.56 | |||||||||||||
| Q2359-02 | 2.095 | 20.70 | |||||||||||||
| Q2359-02 | 2.154 | 20.30 |
| Name | [C/Fe] | [O/Fe] | [Al/Fe] | [Si/Fe] | [P/Fe] | [S/Fe] | [Ar/Fe] | [Ti/Fe] | [Cr/Fe] | [Co/Fe] | [Ni/Fe] | [Zn/Fe] | ||
|---|---|---|---|---|---|---|---|---|---|---|---|---|---|---|
| Q0000-2619a | 3.390 | 21.41 | ||||||||||||
| BR0019-15a | 3.439 | 20.92 | ||||||||||||
| PH957 | 2.309 | 21.40 | ||||||||||||
| Q0149+33 | 2.141 | 20.50 | ||||||||||||
| Q0201+36 | 2.463 | 20.38 | ||||||||||||
| J0255+00 | 3.253 | 20.70 | ||||||||||||
| J0255+00 | 3.915 | 21.30 | ||||||||||||
| Q0336-01 | 3.062 | 21.20 | ||||||||||||
| Q0347-38 | 3.025 | 20.80 | ||||||||||||
| Q0458-02 | 2.040 | 21.65 | ||||||||||||
| HS0741+4741 | 3.017 | 20.48 | ||||||||||||
| Q0836+11 | 2.465 | 20.58 | ||||||||||||
| Q0841+12a | 2.375 | 20.95 | ||||||||||||
| Q0841+12 | 2.476 | 20.78 | ||||||||||||
| BRI0951-04 | 3.857 | 20.60 | ||||||||||||
| BRI0951-04 | 4.203 | 20.40 | ||||||||||||
| BRI0952-01 | 4.024 | 20.55 | ||||||||||||
| PSS0957+33 | 3.279 | 20.32 | ||||||||||||
| PSS0957+33 | 4.178 | 20.50 | ||||||||||||
| BRI1108-07 | 3.608 | 20.50 | ||||||||||||
| Q1210+17 | 1.892 | 20.60 | ||||||||||||
| Q1215+33 | 1.999 | 20.95 | ||||||||||||
| Q1223+17 | 2.466 | 21.50 | ||||||||||||
| Q1331+17 | 1.776 | 21.18 | ||||||||||||
| BRI1346-03c | 3.736 | 20.72 | ||||||||||||
| PSS1443+27 | 4.224 | 20.80 | ||||||||||||
| Q1759+75 | 2.625 | 20.80 | ||||||||||||
| Q1946+7658 | 2.844 | 20.27 | ||||||||||||
| Q2206-19 | 1.920 | 20.65 | ||||||||||||
| Q2206-19 | 2.076 | 20.43 | ||||||||||||
| Q2230+02 | 1.864 | 20.85 | ||||||||||||
| Q2231-002 | 2.066 | 20.56 | ||||||||||||
| Q2344+12 | 2.538 | 20.36 | ||||||||||||
| Q2348-01 | 2.426 | 20.50 | ||||||||||||
| Q2348-01a | 2.615 | 21.30 | ||||||||||||
| Q2348-14 | 2.279 | 20.56 | ||||||||||||
| Q2359-02 | 2.095 | 20.70 | ||||||||||||
| Q2359-02 | 2.154 | 20.30 |
aNi is serving as a proxy for Fe
bCr is serving as a proxy for Fe
cAl is serving as a proxy for Fe
References
- Bergeson & Lawler (1993) Bergeson, S.D. & Lawler, J.E. 1993, ApJ, 408, 382
- Bergeson & Lawler (1993b) Bergeson, S.D. & Lawler, J.E. 1993, ApJ, 414, L137
- Bergeson, Mullman, & Lawler (1994) Bergeson, S.D., Mullman, K.L., & Lawler, J.E. 1993, ApJ, 435, L157
- Bergeson et al. (1996) Bergeson, S.D., Mullman, K.L., Wickliffe, M.W., Lawler, J.E., Litzen, U., and Johansson, S. 1996, ApJ464, 1044
- Djorgovski et al. (1998) Djorgovski, S.G., Gal, R.R., Odewahn, S.C., de Carvalho, R.R., Brunner, R., Longo, G., & Scaramella, R. 1998, in “Wide Field Surveys in Cosmology”, eds. S. Colombi & Y. Mellier, (astro-ph/9809187)
- Ellison et al. (2001) Ellison, S.L., Ryan, S., & Prochaska, J.X. 2001, MNRAS, in press
- Fan et al. (1999) Fan, X., SDSS collaboration, 1999, AJ, 118, 1 (SDSS Collaboration)
- Fedchak, & Lawler (1999) Fedchak, J. A. & Lawler, J. E. 1999, ApJ, 523, 734
- Fedchak, Wiese, & Lawler (2000) Fedchak, J. A., Wiese, L. M., & Lawler, J. E. 2000, ApJ, 538, 773
- Grevesse et al. (1996) Grevesse, N., Noels, A., & Sauval, A.J. 1996, In: Cosmic Abundances, S. Holt and G. Sonneborn (eds.), ASPCS, V. 99, (BookCrafters: San Fransisco), p. 117
- Hagen et al. (1999) Hagen, H.J., Engels, D., & Reimers, D. 1999, A&AS, 134, 483
- Howk, Savage, & Fabian (1999) Howk, J.C., Savage, B.D., & Fabian, D. 1999, ApJ, 525, 253
- Howk et al. (2000) Howk, J.C., Sembach, K.R., Roth, K.C., & Kruk, J.W. 2000, ApJ, 544, 867
- Kirkman & Tytler (1997) Kirkman, D. & Tytler, D. 1997, ApJ, 484, 672
- Lanzetta et al. (1995) Lanzetta, K. M., Wolfe, A. M.,& Turnshek 1995, ApJ, 440, 435
- Lu et al. (1996) Lu, L., Sargent, W.L.W., Barlow, T.A., Churchill, C.W., & Vogt, S. 1996, ApJS, 107, 475 (L96)
- Lu, Sargent, & Barlow (1999) Lu, L., Sargent, W.L.W., & Barlow, T.A. 1999, ASP Conference Series: Highly Redshifted Radio Lines , ed. C. Carilli, S. Radford, K. Menten, & G. Langston (San Fransisco: ASP), p. XXX, (astro-ph/9711298)
- Molaro et al. (2000) Molaro, P., Bonifacio, P., Centurin, M., D’Odorico, S., Vladilo, G., Santin, P., & Di Marcantonio, P. 2000, ApJ, 541, 54
- Molaro et al. (2001) Molaro, P. et al. 2001, ApJ, in press
- Morton (1991) Morton, D.C. 1991, ApJS, 77, 119
- Morton (2001) Morton, D. 2001, in prep
- Mullman et al. (1998) Mullman, K. L., Lawler, J. E., Zsargo, J., & Federman, S. R. 1998, ApJ, 500, 1064
- Outram, Chaffee, & Carswell (1999) Outram, P.J., Chaffee, F.H., & Carswell, R.F. 1999, MNRAS, 310, 289
- Pettini et al. (1994) Pettini, M., Smith, L. J., Hunstead, R. W., and King, D. L. 1994, ApJ, 426, 79
- Pettini et al. (1995) Pettini, M., Lipman, K., & Hunstead, R.W. 1995, ApJ, 451, 100
- Pettini et al. (1997) Pettini, M., Smith, L.J., King, D.L., & Hunstead, R.W. 1997, ApJ, 486, 665
- Pettini et al. (2000) Pettini, M., Ellison, S.L., Steidel, C.C., Shapley, A.E., & Bowen, D.V. 2000, ApJ, 532, 65
- Prochaska & Wolfe (1996) Prochaska, J. X. & Wolfe, A. M. 1996, ApJ, 470, 403
- Prochaska & Wolfe (1997) Prochaska, J. X. & Wolfe, A. M. 1997, ApJ, 474, 140
- Prochaska & Wolfe (1999) Prochaska, J. X. & Wolfe, A. M. 1999, ApJS, 121, 369 (PW99)
- Prochaska & Wolfe (2000) Prochaska, J.X. & Wolfe, A.M., 2000, ApJ, 533, L5
- Prochaska et al. (2000) Prochaska, J. X., Naumov, S.O., Carney, B.W., McWilliam, A., & Wolfe, A.M. 2000, AJ, 120, 2513
- Prochaska, Gawiser, & Wolfe (2001) Prochaska, J.X., Gawiser, E., & Wolfe, A.M. 2001, ApJ, in press (PGW01)
- Prochaska & Wolfe (2001a) Prochaska, J.X. & Wolfe, A.M. 2001, ApJ, in press, (Paper II)
- Prochaska & Wolfe (2001b) Prochaska, J.X. & Wolfe, A.M. 2001, ApJ, in prep
- Prochaska, O’Meara, & Wolfe (2001c) Prochaska, J.X., O’Meara, J.M., & Wolfe, A.M. 2001, in prep
- Raassen & Uylings (1998) Raassen, A.J.J. & Uylings, P.H.M. 1998, A&A, 340, 300
- Savage and Sembach (1991) Savage, B. D. and Sembach, K. R. 1991, ApJ, 379, 245
- Schectman et al. (1998) Schectman, R.M., Povolny, H.S., & Curtis, L.J. 1998, ApJ, 504, 921
- Storrie-Lombardi et al. (1996) Storrie-Lombardi, L.J., Irwin, M.J. 1996, & McMahon, R.G. MNRAS, 282, 1330
- Storrie-Lombardi and Wolfe (2000) Storrie-Lombardi, L.J. & Wolfe, A.M. 2000, ApJ, 543, 552
- Tripp et al. (1996) Tripp, T. M., Lu L., & Savage B.D. 1996, ApJS, 102, 239
- Turnshek et al. (1989) Turnshek, D.A., Wolfe, A.M., Lanzetta, K.M., Briggs, F.H., Cohen, R.D., Foltz, C.B., Smith, H.E., & Wilkes, B.J. 1989, ApJ, 344, 567
- Verner et al. (1994) Verner, D. A., Barthel, P. D., Tytler, D. 1994, A&AS, 108, 287
- Verner (1996) Verner, D. A. 1996, Atomic Data, Nuc. Data Tables, 64, 1
- Vogt et al. (1994) Vogt, S.S., Allen, S.L., Bigelow, B.C., Bresee, L., Brown, B., et al. 1994, SPIE, 2198, 362
- Wiese, Fedchak, & Lawler (2001) Wiese, L.M., Fedchak, J. A., & Lawler, J. E. 2001, ApJ, 547, 1178
- Wolfe et al. (1986) Wolfe, A.M., Turnshek, D.A., Smith, H.E., & Cohen, R.D. 1986, ApJS, 61, 249
- Wolfe et al. (1994) Wolfe, A. M., Fan, X-M., Tytler, D., Vogt, S. S., Keane, M. J., & and Lanzetta, K. M. 1994, ApJ, 435, L101
- Wolfe et al. (1995) Wolfe, A. M., Lanzetta, K. M., Foltz, C. B., and Chaffee, F. H. 1995, ApJ, 454, 698
- Wolfe et al. (2001) Wolfe, A.M. et al. 2001, in prep
- Wolfe & Prochaska (2000) Wolfe, A. M. & Prochaska, J.X. 2000a, ApJ, 545, 591
- Wolfe, Prochaska, & Gawiser (2001) Wolfe, A. M., Prochaska, J.X., & Gawiser, E. 2001, in preparation