High-Resolution Mid-Infrared Morphology of Cygnus A
Abstract
We present subarcsecond resolution mid-infrared images at 10.8 and 18.2 of Cygnus A. These images were obtained with the University of Florida mid-IR camera/spectrometer OSCIR at the Keck II 10-m telescope. Our data show extended mid-IR emission primarily to the east of the nucleus with a possible western extension detected after image deconvolution. This extended emission is closely aligned with the bi-conical structure observed at optical and near-IR wavelengths by the HST. This emission is consistent with dust heated from the central engine of Cygnus A. We also marginally detect large-scale low level emission extending 1.5 kpc from the nucleus which may be caused by in-situ star formation, line emission, and/or PAH contamination within the bandpass of our wide N-band filter.
1 Introduction
Cygnus A is the most powerful extragalactic radio source in the local universe (located at a distance of 224 Mpc, H km s-1 Mpc-1) and was among the first extra-galactic radio sources to be optically identified (Baade & Minkowski 1954). However, the true nature of the central engine has remained controversial since that time. Cygnus A is the prototypical FR II radio galaxy containing a powerful radio jet extending approximately 80 kpc on either side of the nucleus. In addition, the nuclear region of Cygnus A may contain a heavily extinguished quasar, hidden from direct view by up to A17030 magnitudes of extinction as determined by x-ray observations of Ueno et al. (1994).
Key evidence for the embedded quasar model of Cygnus A was provided through the detection of broad emission lines by Antonucci, Hurt, & Kinney (1994) and Ogle et al. (1997). Additionally, x-ray spectra taken by Ueno et al. (1994) suggest the presence of an obscured power-law source, entirely consistent with that expected of a quasar. Further evidence for a central AGN is provided by the detection of a bi-conical ionization structure in the inner 3, observed at optical and near-IR wavelengths by Jackson, Tadhunter, & Sparks (1998) and Tadhunter et al. (1999) respectively using the HST. The cone axis is aligned to within 15 of the radio axis and, in the near-IR, resembles an edge-brightened bipolar structure typically observed around young stellar objects (see Velusamy & Langer 1998).
The detection of an ionization cone and broad emission lines near the nucleus of Cygnus A provides general support for the so-called ‘unification theories of AGN’ (i.e. Antonucci & Miller, 1985). These models account for the dichotomy in active galaxies in which broad and narrow emission lines are observed in Type 1 AGN whilst Type 2 AGN display only narrow emission lines. Unified theories presume that an optically and geometrically thick dusty torus surrounds the central engine, obscuring the broad emission line region (BLR) from some lines of sight. The narrow emission line region (NLR) typically extends over a large volume and hence is less affected by the line of sight to the central engine. When the torus is viewed face on, the BLR and NLR from the central engine can be observed. When the torus is viewed edge on, the BLR is obscured and only narrow emission lines are detected. By observing Type 2 sources at emission line wavelengths (such as [OIII], H and [NII]), ionization structures have been detected in several sources (i.e. Schmitt & Kinney, 1996; Falcke et al., 1998). In many cases the structures are conical or bi-conical, consistent with ionization by a central source collimated by a surrounding torus. The detection of an ionization cone at optical wavelengths along with detection of broad emission lines lend support to the idea that the active core of Cygnus A is obscured from direct view by a torus.
In this paper we present subarcsecond resolution 10 and 18 images of the central 8 kpc of Cygnus A. These images show evidence of the bi-conical structures seen in near-IR observations with HST (Tadhunter et al. 1999). We discuss these observations and results in Sections 2 and 3. The origin of the mid-infrared emission is evaluated on nuclear (sub-kpc) and large (1.5-2 kpc) scales in Section 4, while Section 5 summarizes our conclusions.
2 Observations
Observations of Cygnus A were made on May 9, 1998 using the University of Florida mid-infrared camera/spectrometer OSCIR on the Keck II 10-m telescope. OSCIR uses a 128 x 128 Si:As Blocked Impurity Band detector developed by Boeing. On the Keck II 10-m telescope OSCIR has a plate scale of 0062 pixel-1 with the f/40 chopping secondary, corresponding to a field of view of 79 x 79. Images were obtained in the N (=10.8 , =5.2 ) and IHW18 (=18.2 , =1.7 ) filters using a standard chop/nod technique to remove sky background and thermal emission from the telescope. The chopper throw was 8 in declination at a frequency of 4 Hz and the telescope was beam switched every 30 seconds. All observations were guided using the off-axis guider. OSCIR was mounted at one of the Keck-II “bent cassegrain” ports. Due to the alt-az mount of the Keck-II telescope, any instrument directly attached to it will see a fixed pupil and a field orientation which rotates as the telescope tracks. In order to fix the field as seen by the detector array, OSCIR was mounted on an instrument counter-rotator. However, this does produce a rotation of the pupil as the telescope tracks, and correspondingly a rotation of the Keck hexagonal diffraction pattern on the detector array.
Cygnus A was observed for a total on-source integration time of 240 seconds (480 chopped) at N and 180 seconds (360 chopped) at IHW18. Observations of Aql were taken directly before Cygnus A for flux calibration. Absolute calibration of Aql was achieved using a stellar model based on spectral irradiance models of similar K3II stars by Cohen (1995) adjusted for filter and atmospheric transmission. Measurements of other calibration stars throughout the night showed flux calibration variations of less than 5% at N and less than 15% at IHW18. Observations of Cyg and Aql were used to measure the telescope’s point spread function (PSF). The measured FWHM of Cyg at N was 030 based on a 15 second exposure (30 seconds chopped). Images of Cyg were not obtained at IHW18 so the flux calibration star Aql was used as a measure of the IHW18 PSF. This yielded a FWHM of 04 based on a 30 second exposure (60 seconds chopped). Both measurements lie close to the theoretical diffraction limit (027 at N and 038 at IHW18). Short integrations on Cyg and Aql were sufficient for comparison to Cygnus A due to the stability of the OSCIR/KECK II PSF on May 9, 1998. Observations of the standard star Leo taken in 15 second increments showed that the FWHM varied by 7% over a total integration time of 180 seconds (360 chopped).
Cygnus A images were rotated to place North up and East left in post-processing. Images of the PSF stars Cyg and Aql were also rotated -14.1 and 37.8 respectively to match the position angle of the Keck hexagonal diffraction pattern as projected on the detector array when Cygnus A was observed. In addition, PSF images were rotationally “smeared” to account for the slight rotation of the pupil ( 3) during the exposure times of Cygnus A. These images were then used to deconvolve the Keck II telescope’s PSF from the Cygnus A images at 10 .
3 Results
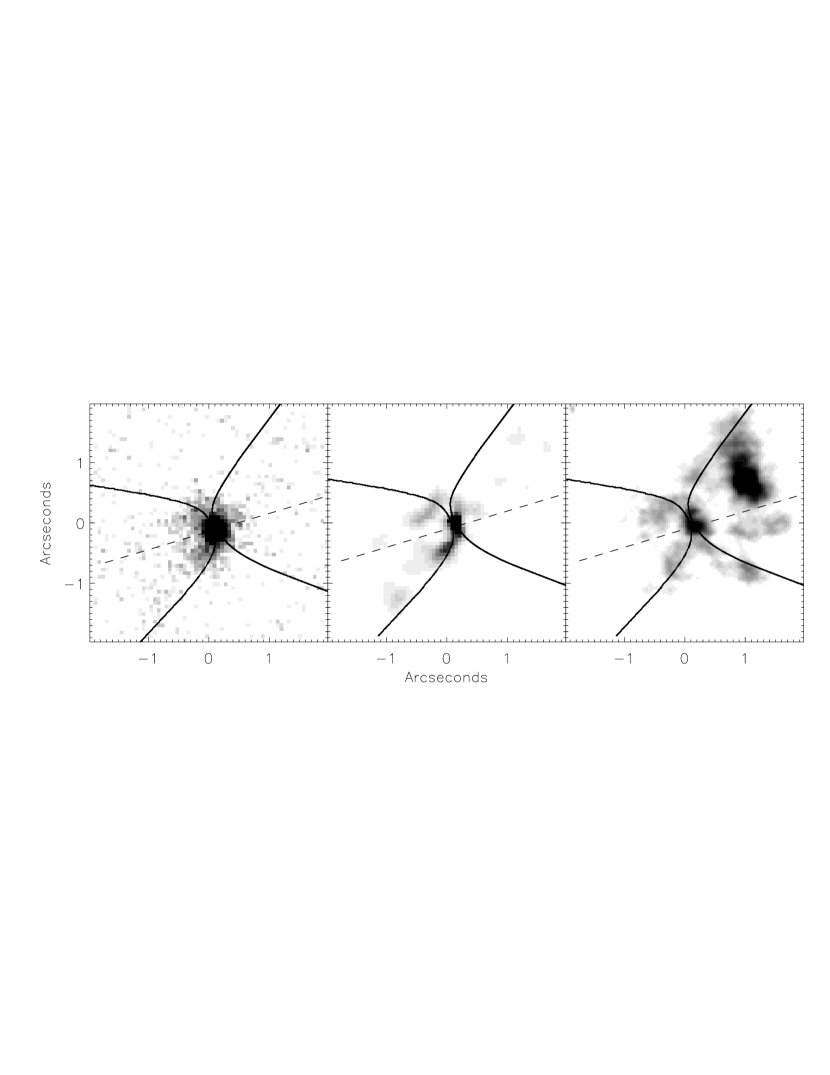
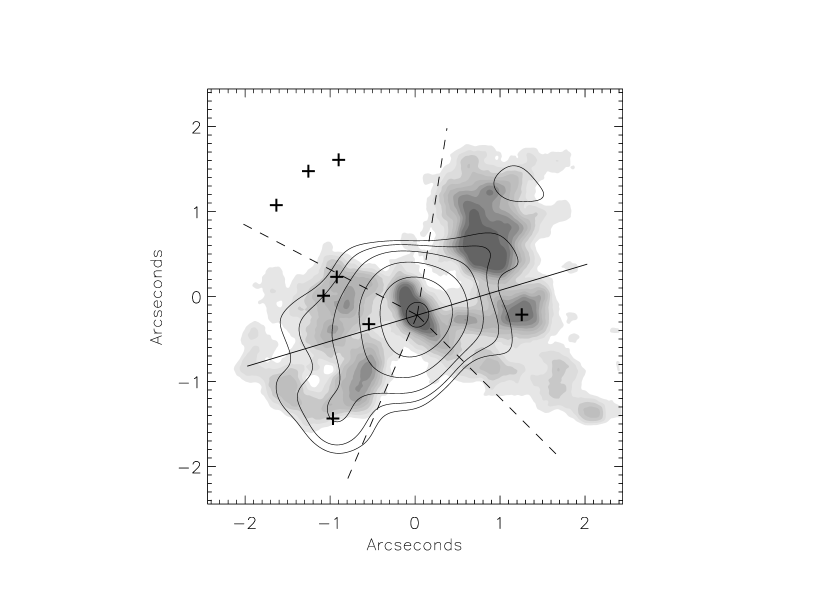
Figure 1 shows our N band image of the central 2 kpc () of Cygnus A. Figure 2 shows the same analysis of Cygnus A at IHW18. Both figures clearly show extended emission detected primarily to the east of the nucleus. This extended emission can be separated into two distinct regions located northeast and southeast of the central source. These regions are closely aligned with the bi-conical structure (opening angle 116 ) observed at optical wavelengths by Jackson, Tadhunter, & Sparks (1998) and at near-IR wavelengths by Tadhunter et al. (1999). However, at this resolution the raw data shows little evidence of the western component of the bi-cone (Figure 3a). Using a deconvolution method from R. K. Piña 2001 (in preparation), the PSF star Cyg (Figure 3b) was deconvolved from the raw N-band image. Deconvolution using the PSF star Aql was also performed with similar results. The final deconvolution is shown in Figure 3c. This figure shows a morphology which is in close agreement with the structure of the HST 2.0 near-IR data seen in Figure 3d. Figure 4 shows that the deconvolved structure is also very similar to the inner morphology of the [OI] emission map of Jackson, Tadhunter, & Sparks (1998). The [OI] data also implies a more parabolic shape to the ionization cone structure. In addition, the deconvolved data shows that most of the 10 emission arises from the SE-NW limb of the bi-cone. This is similar to the results of Tadhunter et al. (2000) in which the SE-NW limb also dominates in near-IR polarization images. Due to low signal-to-noise, deconvolution was not performed on the IHW18 data.
Table 1 shows our flux measurements of Cygnus A in comparison with other observation from the literature. These values are also plotted in Figure 5. Comparing our results with that of IRAS shows that while we see of the predicted 10 flux, we only detect about 60% of the predicted 18 flux (based on a simple linear fit). This implies that most of the warm dust ( 12 ) lies within the central 2 region of the galaxy while the cooler dust ( 18 ) extends farther out. These results are roughly consistent with the 20 ISO data of Haas et al. (1998) which measured 816 mJy using a 23 aperture but does not explain their 12.8 measurement of 485 mJy. It is unclear why the 12.8 ISO data differs so greatly from the IRAS data taken in a larger aperture as well as other 10 measurements from the literature.
In addition to the sub-kpc structure of Cygnus A, we also marginally detect large scale mid-IR emission kpc from the nucleus within the ionization cone. Flux is detected within both cones at N, while low level emission at IHW18 is detected only in the southeastern cone. This large-scale emission can be seen at a 2-3 sigma level in 05 gaussian smoothed 10 and 18 images in Figure 6. Figure 7 shows the large-scale N-band emission to be approximately coincident with [OIII] emission located within the ionization cone of Cygnus A. Measurements of this emission were taken with 2 x 4 rectangular beam (see Table 1). Subtracting off the 2 flux measurement of the core leaves us with mJy at N and mJy at IHW18 over a 5 arcsec2 region.
3.1 Temperature and Optical Depth
Temperature and emission optical depth maps from simple radiative transfer analysis provide a good first-order estimate of the sources of grain heating as well as the relative density of warm grains (Tresch-Fienberg et al. 1987). Flux maps of the nuclear region of Cygnus A were created by convolving images at N with the IHW18 PSF and vice-versa to attain the same resolution. Temperature and emission optical depth estimates were obtained pixel by pixel by solving the equation of radiative transfer () at two wavelengths assuming the optically thin approximation ( 1). Where is the observed flux density at frequency , is the solid angle of each pixel, is the Planck function evaluated at frequency and temperature T, and is the emission optical depth. The frequency dependence of dust grain emission efficiency in the mid-IR is approximated as .
Since no astrometric calibration was performed due to the limited field of view of OSCIR, the peak flux of the convolved N-band image was aligned to coincide with peak flux of the convolved IHW18 image. In order to determine the errors due to alignment, a Monte Carlo simulation was done by shifting the two convolved images with respect to each other up to 0.1 in all directions. The structure of the temperature map was highly dependent on the alignment of the two convolved images. Temperature values were most stable within the SE cone, varying 5 K. Temperatures in the core showed a dispersion of approximately 10 K, while that in the NE cone varied up to 30 K due to low S/N of any extended emission at 18 in this area. The emission optical depth map (Figure 8) was much less dependent on alignment and consistently showed higher optical depths along the limbs of the SE ionization cone. This is consistent with the scenario proposed by Tadhunter et al. (1999) that dust has been destroyed or swept out of the cones by outflows from the central quasar. Lateral expansion of these outflows may have also caused density enhancements of dust along the walls of the bi-cone.
4 Analysis and Discussion
There are several possible mechanisms that can account for extended mid-IR emission: in-situ star formation, material heated by shocks, dust heated by the central engine, polycyclic aromatic hydrocarbon emission (PAH), and emission lines. Each is considered below and how they relate to the mid-infrared emission detected on small (sub-kpc) and large scales (1.5-2 kpc).
4.1 Origin of Sub Kiloparsec Emission
4.1.1 Star Formation
Extended mid-IR emission has been observed to arise from young star formation in the central regions of galaxies (Telesco 1988). In Cygnus A however, estimates of the 2-10 keV hard x-ray luminosity relative to the 40-500 far-IR luminosity is 0.1, typical for a galaxy predominantly powered by AGN activity (Imanishi et al. 2000). Additionally the 11.3 PAH emission is less than would be expected if the region contains strong star formation. PAH measurements of Imanishi & Ueno (2000) place a lower limit of the ratio of 11.3 luminosity to far-IR luminosity more than an order of magnitude smaller than that found for galaxies dominated by star formation (Smith, Aitken, & Roche 1989). Finally, optical spectroscopy of Cygnus A by Thornton, Stockton, & Ridgway (1999) (using a 11 slit oriented along the ionization cone axis) show the equivalent width of the Ca II triplet , to be much less than would be expected if star formation dominated the nucleus (Terlevich, Diaz, & Terlevich 1990). Thus it is unlikely that the majority of the mid-IR emission detected arises from star formation.
4.1.2 Heating From Central Engine
Optical spectroscopy by Thornton, Stockton, & Ridgway (1999) also detected [Ar XI] and [Fe XI] in the southeastern component of Cygnus A. High-ionization lines such as these indicate either photoionization by a continuum source extending to the far-UV or transient heating by high speed shocks to 2 106 K (e.g. Osterbrock & Fulbright 1996). Thornton used the line flux ratios of H2 (F[ S(3)]/F[ S(1)], Kawara, Nishida & Gregory 1990) as well as the ratio of H2 and [O I] emitting regions (Mouri et al. 1989) to rule out shock heating and propose that the most likely cause for the high-ionization lines was due to x-ray heating from a central quasar.
The central quasar may also be responsible for the extended mid-IR emission. Based on color temperature maps of the nuclear region (see section 3.1), we estimate that dust reaches a T 150 K up to 500 pc from the central source. Assuming a uniform dust distribution, a first-order determination of the size of the region that could be heated by a central source can be made. The equilibrium temperature of dust in a strong UV field (Dopita et al. 1998) is given by
| (1) |
where is the luminosity of the central source in units of 1010 L☉, is the radius from the source in parsecs, and is the average grain radius in units of 0.1 .
Estimating the true luminosity of an embedded source such as Cygnus A is difficult due to the high levels of dust obscuration towards the central source. Haas et al. (1998) estimated a luminosity L 4.7 1011 L☉ for Cyg A from ISO measurements. Ward et al. (1991) however, estimated the total luminosity of Cyg A to be as high as 1.6 1012 L☉. Using Balmer line fluxes in a 5 aperture Stockton, Ridgway, & Lilly (1994) calculated a bolometric luminosity of Cyg A of L 3.3 1011 L☉. However, they also noted that this calculation assumed that the gas in the central region had a covering factor of unity and hence represents a lower limit that could easily be an underestimate of the true luminosity by a factor of 10 or more. Therefore the true luminosity of Cygnus A could be as high as 3.3 1012 L☉. Using equation (1) and assuming a central luminosity of 1 1012 L☉, dust could be heated to a temperature of 150 K from the central engine up to a distance of 500 pc for grain sizes 0.1 . Classical interstellar dust is generally considered to be a mixture of silicate and graphite particles with grain sizes in the range (0.003 - 1 ) (Draine & Lee 1984). Thus the sub-kpc extended mid-IR emission in Cyg A is consistent with heating of dust from a central engine.
4.2 Origin of Large Scale Emission
Although dust heated from the central engine may account for the mid-IR emission on sub-kpc scales, it may not entirely account for the low level large-scale emission marginally detected at 10 and 18 (see Figure 6). This large scale emission extends 1.5 - 2 kpc from the nucleus and covers a total area of 5 arcsec2. Based on the average surface brightness of this emission in the SE cone we estimate a dust T150 K (similar to that found in the nuclear regions). Referring back to equation (1), in order for dust grains at 1.5 kpc to reach these temperatures from central heating they would need to be . In the NE cone where only 10 emission is detected, we estimate a lower temperature limit of approximately 220 K which would require dust grains . Though these are only approximations of course, they do imply that central heating may not be able to entirely explain mid-IR emission on these large scales.
This raises the possibility that small grains such as PAH’s could contribute to the large scale emission. Previous spectrometry by Imanishi & Ueno (2000) reveals that the 11.3 PAH feature is weak in Cygnus A. This measurement was made with a 05 slit centered on the nucleus of the galaxy. However, the orientation of the slit with respect to this large scale extended emission is unclear. If the slit was oriented perpendicular to this emission it may have only shown that PAH emission is weak in the core of Cygnus A and may not necessarily rule out PAH emission farther out in the ionization cone.
In-situ heating from ongoing star formation may also contribute to the large-scale emission. Though mid-IR emission from star formation is probably weak in the central few kpc of Cygnus A (see section 4.1.1), it may explain the low level emission marginally detected in the SE cone at N and IHW18. Jackson, Tadhunter, & Sparks (1998) detected several compact blue regions within the inner 2 kpc of Cygnus A using HST filters between 336-622nm. At least 4 of 8 of these regions coincide with the large-scale extended emission seen at N and IHW18 in the SE cone (see Figure 7). Lynds et al. (1994), Stockton, Ridgway, & Lilly (1994), and Jackson all suggest that these regions trace young star formation similar to young star clusters seen in NGC 1275 (Holtzman et al. 1992).
Another possible explanation for the large-scale extended emission is mid-IR line emission. The coincidence between the [OIII] and this emission reveal that ionizing photons of at least 54.9 eV exist in these regions. This provides sufficient ionization to produce the 12.814 [NeII] fine structure line (21.6 eV) which would fall within our N-band filter ( 8-13 ). Other mid-IR lines such as [ArIII] and [SIV] could also contaminate our N-band filter and contribute to this emission. Future mid-IR spectroscopy with the slit placed along the ionization cone is needed to explore this possibility.
5 Conclusions
The mid-IR morphology of the inner kpc of Cygnus A shows structure consistent with the bi-cone observed at near-IR wavelengths. The SE portion of the bi-cone is detected in our raw N and IHW18 band data while the NW cone is detected in our deconvolved 10 image. Our calculations suggest that these structures are consistent with heating from a central engine rather than from local heating from star formation. We also marginally detect low level extended emission at 10 and 18 on scales up to 1.5-2 kpc from the nucleus. This emission may be a result of heating from the central engine on small grains, in-situ heating from weak star formation, line emission such as from [Ne II], PAH emission or any combination of these. An optical depth map of the region shows the highest optical depth is located along the edges of the ionization cone and supports the conclusion that dust in the central regions of Cygnus A is swept up by outflows, possibly causing density enhancements along the walls of the bicone.
References
- Antonucci, Hurt, & Kinney (1994) Antonucci, R. R. J., Hurt, T., & Kinney, A. 1994, Nature, 371, 313
- Antonucci & Miller (1985) Antonucci, R. R. J. & Miller, J. S. 1985, ApJ, 297, 621
- Baade & Minkowski (1954) Baade, W. & Minkowski, R. 1954, ApJ, 119, 206
- Cohen et al. (1995) Cohen, M., Witteborn, F. C., Walker, R. G., Bregman, J. D. & Wooden, D. H. 1995, AJ, 110, 275
- Dopita, Heisler, Lumsden, & Bailey (1998) Dopita, M. A., Heisler, C., Lumsden, S., & Bailey, J. 1998, ApJ, 498, 570
- Draine & Lee (1984) Draine, B. T. & Lee, H. M. 1984, ApJ, 285, 89
- Falcke et al. (1998) Falcke, H. Wilson A. S. Simpson, C. 1998, ApJ, 502, 199
- Haas et al. (1998) Haas, M., Chini, R., Meisenheimer, K., Stickel, M., Lemke, D., Klaas, U. & Kreysa, E. 1998, ApJ, 503, L109
- Heckman, Lebofsky, Rieke, & van Breugel (1983) Heckman, T. M., Lebofsky, M. J., Rieke, G. H., & van Breugel, W. 1983, ApJ, 272, 400
- Holtzman et al. (1992) Holtzman, J. A. et al. 1992, AJ, 103, 691
- Imanishi & Ueno (2000) Imanishi, M. & Ueno, S. 2000, ApJ, 535, 626
- Jackson, Tadhunter & Sparks (1998) Jackson, N., Tadhunter, C. & Sparks, W. B. 1998, MNRAS, 301, 131
- Kawara, Nishida & Gregory (1990) Kawara, K., Nishida, M. & Gregory, B. 1990, ApJ, 352, 433
- Knapp, Bies, & van Gorkom (1990) Knapp, G. R., Bies, W. E., & van Gorkom, J. H. 1990, AJ, 99, 476
- Lynds, O’Neil, Scowen, & Idt (1994) Lynds, R., O’Neil, E. J., Scowen, P. A., & Idt, M. O. W. C. 1994, American Astronomical Society Meeting, 184, 4905
- Mouri, Taniguchi, Kawara & Nishida (1989) Mouri, H., Taniguchi, Y., Kawara, K. & Nishida, M. 1989, ApJ, 346, L73
- Ogle et al. (1997) Ogle, P. M., Cohen, M. H., Miller, J. S., Tran, H. D., Fosbury, R. A. E. & Goodrich, R. W. 1997, ApJ, 482, L37
- Osterbrock & Fulbright (1996) Osterbrock, D. E. & Fulbright, J. P. 1996, PASP, 108, 183
- Radomski et al. (2001) Radomski, J. T., Piña, R., Packham, C., Telesco, C., & Tadhunter, C. 2001, ASP Conf. Ser. 249: The Central Kiloparsec of Starbursts and AGN: the La Palma Connection, ed. J.H. Knapen, J.E. Beckman, I. Shlosman & T.J. Mahoney, 325
- Rieke & Low (1972) Rieke, G. H. & Low, F. J. 1972, ApJ, 176, L95
- Schmitt & Kinney (1996) Schmitt, H. R. & Kinney, A. L. 1996, ApJ, 463, 498
- Smith, Aitken & Roche (1989) Smith, C. H., Aitken, D. K. & Roche, P. F. 1989, MNRAS, 241, 425
- Stockton, Ridgway & Lilly (1994) Stockton, A., Ridgway, S. E. & Lilly, S. J. 1994, AJ, 108, 414
- Tadhunter et al. (1999) Tadhunter, C. N., Packham, C., Axon, D. J., Jackson, N. J., Hough, J. H., Robinson, A., Young, S. & Sparks, W. 1999, ApJ, 512, L91
- Tadhunter et al. (2000) Tadhunter, C. N. et al. 2000, MNRAS, 313, L52
- Telesco (1988) Telesco, C. M. 1988, ARA&A, 26, 343
- Terlevich, Diaz, & Terlevich (1990) Terlevich, E., Diaz, A. I., & Terlevich, R. 1990, MNRAS, 242, 271
- Thornton, Stockton & Ridgway (1999) Thornton, R. J., Stockton, A. & Ridgway, S. E. 1999, AJ, 118, 1461
- Tresch-Fienberg et al. (1987) Tresch-Fienberg, R., Fazio, G. G., Gezari, D. Y., Lamb, G. M., Shu, P. K., Hoffmann, W. F., & McCreight, C. R. 1987, ApJ, 312, 542
- Ueno et al. (1994) Ueno, S., Koyama, K., Nishida, M., Yamauchi, S. & Ward, M. J. 1994, ApJ, 431, L1
- Velusamy & Langer (1998) Velusamy, T. & Langer, W. D. 1998, Nature, 392, 685
- Ward, Blanco, Wilson & Nishida (1991) Ward, M. J., Blanco, P. R., Wilson, A. S. & Nishida, M. 1991, ApJ, 382, 115
- Whysong & Antonuuci (2001) Whysong, D. & Antonucci, R. 2001, ApJL, submitted (astro-ph/0106381)
- Young et al. (1999) Young, S., Corbett, E. A., Giannuzzo, M. E., Hough, J. H., Robinson, A., Bailey, J. A. & Axon, D. J. 1999, MNRAS, 303, 227
| Filter | Aperture | Flux Density (mJy) | Reference |
|---|---|---|---|
| N-band | 2 | 104aaError bars include statistical as well as calibration error ( 5% at N-band and 15% at IHW18 | 1 |
| N-band | 2 4bbMeasured using a rectangular beam with major axis position angle = 60 to incorporate large scale emission | 126aaError bars include statistical as well as calibration error ( 5% at N-band and 15% at IHW18 | 1 |
| N-band | 5.8 | 180 | 2 |
| 10 | 6 | 180 | 3 |
| 11.7 | 1.92 | 122 | 4 |
| 12 (IRAS) | 30 90 | 168 | 5 |
| 12 (ISO) | 23 | 485 | 6 |
| Long Wavelength | |||
| IHW18 (18 ) | 2 | 319aaError bars include statistical as well as calibration error ( 5% at N-band and 15% at IHW18 | 1 |
| IHW18 (18 ) | 2 4bbMeasured using a rectangular beam with major axis position angle = 60 to incorporate large scale emission | 409aaError bars include statistical as well as calibration error ( 5% at N-band and 15% at IHW18 | 1 |
| 25 (IRAS) | 30 90 | 912 | 5 |
| 20 (ISO) | 23 | 816 | 6 |
References. — (1) this paper, also Radomski et al. (2001), (2) Heckman et al. (1983), (3) Rieke & Low (1972), (4) Whysong & Antonucci (2001), (5) Knapp et al. (1990), (6) Haas et al. (1998)