5-micron photometry of late-type dwarfs
Abstract
We present narrowband-M photometry of nine low-mass dwarfs with spectral types ranging from M2.5 to L0.5. Combining the (L′-M′) colours derived from our observations with data from the literature, we find colours consistent with a Rayleigh-Jeans flux distribution for spectral types earlier than M5, but enhanced flux ratios (negative (L′-M′) colours) at later spectral types. This probably reflects increased absorption at M′ due to the CO fundamental band. We compare our results against recent model predictions and briefly discuss the implications.
1 Introduction
Ultracool dwarfs, with spectral types later than M6.5, have effective temperatures of less than 2700K. As a result, a significant fraction of the total energy is emitted at infrared wavelengths, and mapping the spectral energy distribution beyond m is crucial to determining accurate bolometric magnitudes. Ground-based observations at those wavelengths have to cope with strong absorption features due to water and CO2 in the terrestial atmosphere, but broadband photometry through the atmospheric windows at 1.25m (J), 1.6m (H), 2.2m (K) and 3.5 m (L) has been available for M dwarfs for over three decades. Recent large-scale surveys, notably 2MASS (Skrutskie et al., 1997), provide extensive JHK data for the even cooler L and T dwarfs. Narrowband spectrophotometry from 1 to 2.5m, extending through terrestial water bands, was obtained for a handful of M dwarfs by Reid & Gilmore (1984), and extended to 3.5m for a subset of those stars by Berriman & Reid (1987). With the development of array detectors, low-resolution near-infrared spectroscopy now exists for a representative sample of over 40 late-M, L and T dwarfs (Jones et al., 1996; Leggett et al., 2000; Reid et al., 2001a; Burgasser et al., 2001; Geballe et al., 2001).
Spectral energy distributions of cool dwarfs are less well-defined at longer wavelengths, particularly for the latest spectral types. The 4.8m (M) and 10.2m (N) bands are centred on lower-throughput atmospheric windows than the J, H, K or even L bands, and observations become increasingly difficult with the growth in the thermal background. Spaceborne observations avoid this problem, but both IRAS and ISO had relatively low sensitivity, and provide observations of only a few of the brightest sources, predominantly early-type dwarfs. Ground-based observations are similarly limited. Berriman & Reid (1987) obtained M-band photometry of seven nearby dwarfs, including VB8 (spectral type M7), and also report longer-wavelength spectrophotometry (by Aitken & Roche) of the M5.5 dwarf Gl 406 (Wolf 359). Most recently, Leggett et al. (2001b - hereinafter, LSDSS) have supplemented those observations with data for four ultracool dwarfs, two of spectral type L and two of spectral type T.
The forthcoming SIRTF mission should provide more detailed mid-infrared spectrophotometry of a representative sample of cool dwarfs, including isolated examples of both L and T dwarfs. In the meantime, we have combined new ground-based 5m photometry of M and L dwarfs with data from the literature in an attempt to assess the likely flux levels as a function of spectral type. The following section describes the photometric system used to obtain the additional observations, and presents the resultant photometry. Those data are combined with the relatively sparse set of previous observations at mid-infrared wavelengths in Section 3, and compared against predictions of recent theoretical models by Chabrier et al. (2001). Finally, we summarise our conclusions.
2 5-micron Photometry
2.1 Infrared fluxes and the M′ passband
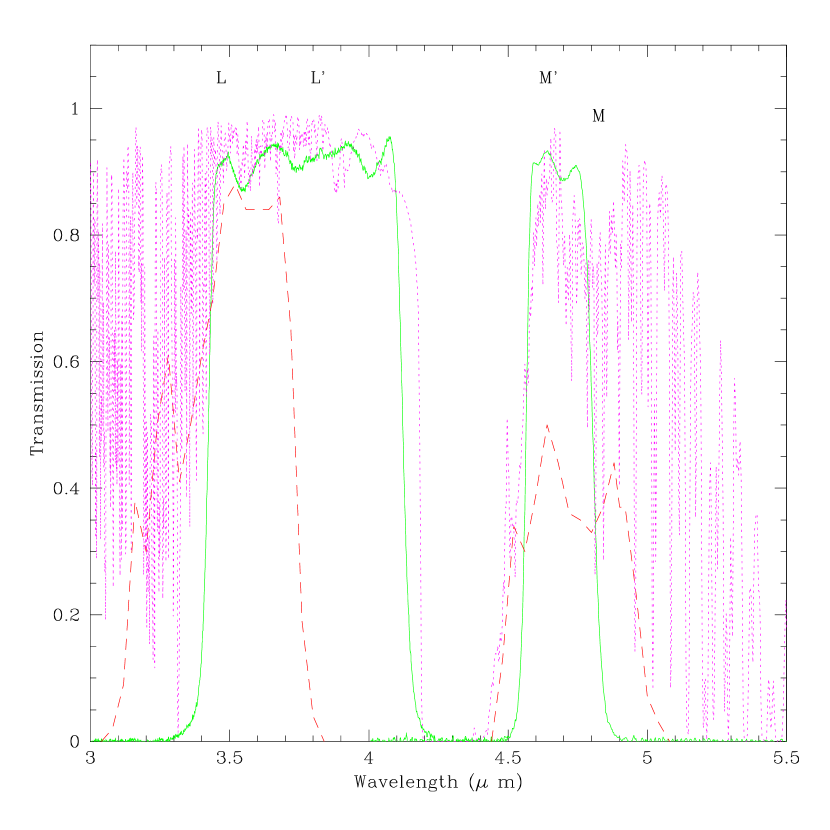
The original infrared broadband photometry system was devised by Johnson (1964) to take advantage of the highest-transparency atmospheric windows at those wavelengths, and was limited to the JKLMN passbands. Johnson’s original observations of K and M dwarfs includes JKL photometry for only 17 stars (Johnson, 1965), with the 1.6m H band only added at a later date (Johnson et al., 1968). The L and M bands in this system are both extremely broad (FWHMm), with effective wavelengths of 3.45 and 4.75m, respectively. Figure 1 matches the transmission curves for those two passbands (from Bessell & Brett, 1988) against the average atmospheric transparency at Mauna Kea Observatory. Both filters extend significantly beyond the atmospheric windows, sampling the 3m and 5m H2O bands and 4.3m CO2 absorption - wavelength regions with both high opacity and high emissivity. Not only does the mismatch lead to reduced flux from the astronomical target, but also high background levels.
The original L-band observations were made using PbS detectors, and their decline in sensitivity longward of 3.5m prevented a more favourable centering in wavelength. Once InSb detectors became available, that mismatch could be corrected, and the L′ passband, m, was defined. Slightly broader than the L-band (FWHMm), the L′ band is better matched to the atmospheric transmission curve. This passband has been the standard for broadband 3.5m photometry since the mid-1980s, albeit with subtle variations between individual systems, as discussed further in Section 3.
The situation at 5m is more complicated, since terrestrial absorption is present to some extent over the full wavelength range. However, it is clear that the Johnson passband can be improved. At the IRTF, this goal has been achieved by defining a narrowband-M system, which we denote here as M′, with m and FWHMm. As Figure 1 shows, the passband is centred in the optimum region of the 5m window. The observations discussed below were made using this filter, which is part of the MKO-NIR system (Simons & Tokunaga, 2001; Tokunaga & Simons, 2001).
At present, there are no extensive observations of photometric standards in the M′ passband. Our photometry is therefore calibrated through observations of M-band standards from Sinton & Tittemore (1984: S&T), specifically Ceti, Vir. Vir and Her. All four are early-type stars (B9 III, A2 IV, A0 V and A), and are therefore likely to have spectral energy distributions closely matching the Rayleigh-Jeans approximation at these wavelengths. In that case, the flux zeropoint for the M′ system is given by scaling the M-band zeropoint by . Bessell & Brett (1988) cite a zeropoint of F for the M band, giving F, or F Janskys at M′.
As a consistency check, we observed both S&T standards and stars from the UKIRT standard list (specifically HD 105601, HF 136754 and Gl 811.1) in May 2001. In addition, all of the stars observed during that run (including the M dwarfs) were measured using both M and M′ filters. Our results show marginal evidence for a magnitude offset between the S&T and UKIRT systems, with the UKIRT system giving brighter magnitudes for the programme stars. There is no evidence, however, for a systematic difference in the relative magnitudes at M and M′ between either set of standards and the target stars; that is, there is no evidence for a colour term in (M-M′) for spectral types between A0 and M5.5 (Gl 406).
Finally, have allowed for atmospheric extinction using values of 0.09 mag/airmass at L′ (Krisciunas et al., 1987) and 0.19 mag/airmass at M′. The latter value is cited on the UKIRT web-site as appropriate for a narrowband-M filter. Since all of our observations, both of standards and program objects, were taken at airmasses of less than 1.30, the corrections are less than magnitudes.
2.2 Observations
Our observations were made on January 19, 20 and May 14 (UT) 2001. We used NSFCam, an imaging camera equipped with a InSb array, on the NASA Infrared Telescope Facility. Conditions were excellent on all three nights, with photometric skies, extremely low water-vapour content and seeing of 0.4 to 0.6 arcseconds at 3.5m. Table 1 lists relevant data for our targets, which include several well-known nearby stars and three bright, ultracool dwarfs from the 2MASS-selected sample analysed by Gizis et al. (2000). We note that HST observations of the L dwarf 2M0746 resolve it as a binary, separation 0.22 arcseconds (Reid et al., 2001b), and therefore unresolved in our observations. The components have very similar luminosities, magnitudes, so the 3 to 5m colours should be characteristic of spectral class L0/L1 (see Figure 5, Reid et al., 2001b).
Photometry was obtained at L′ and M′ in our January observations, and, as discussed above, at M′ and M on May 14. In both cases, we used a five-point dither pattern, centred on the target, offsetting by arcseconds in and . We used a pixel scale of 0.055 arcsec pix-1 to cope with the bright sky background; even so, maximum integration times in a single frame were limited to 0.2-0.3 seconds, and we co-added 20 to 150 frames at each position. The total integration times in M′ are 500-600 seconds for the brighter targets (Wolf 359, LHS 292), and 2400 to 3000 seconds for the fainter sources.
Data reduction was undertaken in two stages. First, IDL and iraf routines were used to combine the five exposures in each dither pattern to give a composite image. In doing so, we compensate for the sky background by subtracting exposures adjacent in time; measure the centroid of the target; and use shift-and-add techniques to align the five exposures. Finally, all composite images of a given target are summed to give the final combined image. This technique requires that either the target or a nearby source is visible on each individual exposure.
Once the individual frames are sky-subtracted and combined, we used the aperture photometry routine phot in the iraf package to determine instrumental magnitudes for each target. Based on the curve of growth, we adopt an aperture of radius 26 pixels (1.43 arcseconds), measuring the sky background at arcseconds. Most of our targets have previously published L′ data, but 2M0027, 2M1441 and 2M0746 lack such data. We have used our observations to derive L′ for those stars. The data are calibrated against our measurements of Gl 406 (Wolf 359), adopting Leggett’s (1992) photometry for the M5.5 dwarf. We also obtained L’ data for LHS 2065, and derive L′=9.43, as compared with L′=9.19 given by Leggett (1992). The latter value gives (K-L′)=0.75, substantially redder than other M8 dwarfs observed here and by LSDSS. We therefore adopt our L′ measurement for this star.
As noted above, the photometric zeropoint at M′ is set by observations of standards from Sinton & Tittemore (1984); the zeropoints determined from individual standards agree to magnitudes. Table 2 lists the photometry for our targets. We include data for the M2.5V UKIRT standard, Gl 811.1, where the M′ data are calibrated against our measurements of the S&T standards (UKIRT lists M=6.73). Table 2 also lists M′-band bolometric corrections, derived by combining our photometry with either previously-measured corrections at other wavelengths, or by assuming BCJ=1.9 magnitudes (see Reid et al., 2001a,b). The only stars with previous 5m observations are Gl 643 and Gl 752A, observed by Berriman & Reid (1987), with M=6.40.1 and M=4.50.1 respectively. Those measurements are consistent with the present photometry.
3 Discussion
3.1 Empirical results: the (L′-M/spectral-type relation
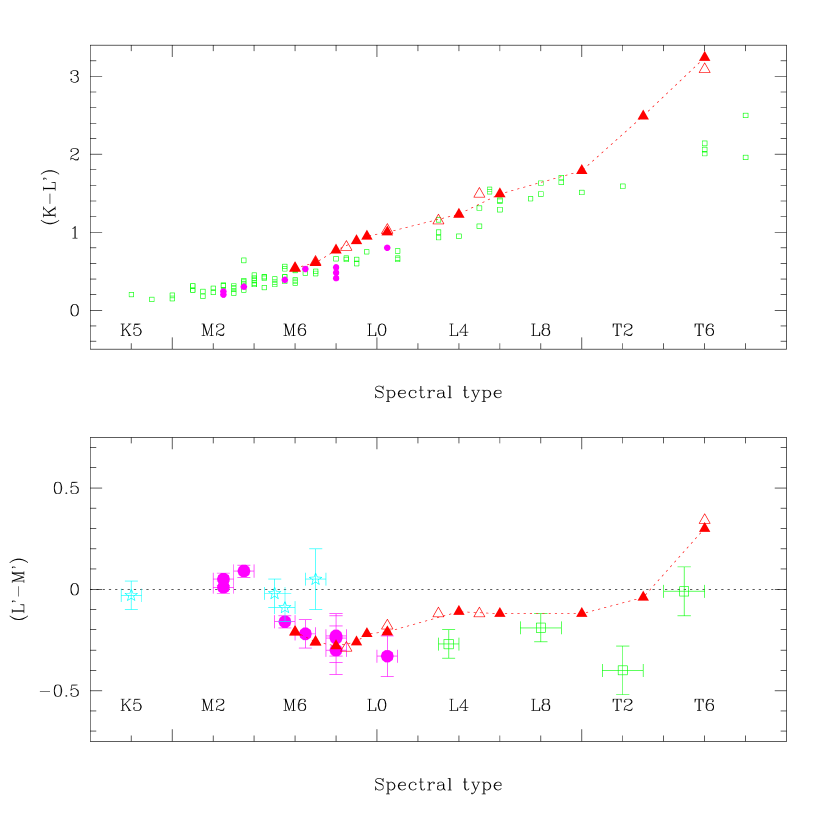
The main result from our analysis is illustrated in Figure 2, which plots (L′-M′) colour as a function of spectral type. In addition to the photometry listed in Table 2, we have plotted Berriman & Reid’s (1987) (L′-M) data for Gl 884 (K5), Gl 699 (M5), Gl 866 (M5.5) and Gl 644C (M7), together with the LSDSS photometry of 2M0036 (L3.5), SD0857+57 (L8), SD1254-01 (T2) and 2M0559-14 (T5). Our L′ photometry and the Leggett et al. data are on the MKO-NIR system, while the Berriman & Reid measurements are on the UKIRT system. As yet, there is no extensive published comparison between these systems, but the available data indicate that systematics differences are relatively small for K and M dwarfs. Leggett (1992) and Leggett et al. (1998) list UKIRT-system L′ photometry for seven stars (spectral types M4 to M9) in common with LSDSS. A comparison gives
with no statistically significant trend against spectral type (the two largest residuals are -0.07 mag. for LHS 2397a, M8, and +0.10 mag. for LHS 2924, M9). Thus, the L′ photometry of M dwarfs can be regarded as self-consistent to better than % between the UKIRT and MKO-NIR systems.
At the longer wavelength, our own observations show that the Berriman & Reid M-band data should be compatible with the M′ system. In any case, the data considered here (17 objects) constitute the totality of M-band photometry currently available for late-type dwarfs. Spectral types for all of the Berriman & Reid Gliese stars are taken from Reid et al. (1995), the value for 2M0036 (L3.5) is from Kirkpatrick et al. (1999), while the remaining types are given in LSDSS.
Figure 2 also plots (K-L′) data for the M-band sample and other late-type dwarfs. The latter data are taken from Leggett (1992 - spectral types K5 to M9), Leggett et al. (1998 - M0 to M6.5) and LSDSS (M6 to T8). As noted above, the L′ data in the first two references are on the UKIRT system, but, since observations are limited to K and M dwarfs, the entire dataset can be regarded as consistent with the MKO-NIR system to %.
While the parameter space remains sparsely sampled and uncertainties are still significant, the data show a clear trend with spectral type. Earlier than M4, the colours are broadly consistent with (L′-M, indicating that the flux ratio, , is close to that expected for a Rayleigh-Jeans spectral energy distribution, F. The increasing complexity of molecular absorption in later-type dwarfs leads to significant departures from blackbody distributions with decreasing temperature, so it is scarcely surprising that later-type dwarfs show increasing deviation from this ratio. The (L′-M′) colours become negative at spectral type M5/M6, indicating proportionately higher flux in the shorter wavelength band. This transition lies close to the temperature where dust is predicted to form in sufficient quantities to influences M dwarf atmospheres. As originally pointed out by Tsuji et al. (1996), dust can modify the energy distribution, notably the water bands between 1 and 3 m, by warming the outer atmospheric layers. However, the absence of a corresponding feature in (K-L′) suggests that the change in (L′-M′) reflects reduced flux at 4.7m, rather than enhanced flux at 3.8m.
A possible candidate for the observed behaviour is increased CO absorption in the 5m fundamental band. The existence of this feature at these spectral types is no surprise, since the 2.2m overtone band is evident in dwarfs as early as K5 (Reid & Gilmore, 1984), while Noll et al. (1997) detect broad CO in their spectrum of Gl 229A (M1.5). Thus, the feature should be well developed by spectral type M5. It is not clear, however, whether CO alone is responsible for the change in (L′-M′) colour. Unfortunately, Gl 229A is the only M dwarf with useful spectroscopic observations at these wavelengths. The few M dwarf spectra obtained by ISO (Wehrse et al., 1997; Tsuji et al., 1997) have low signal-to-noise and uncertain calibration, and set weak constraints on the flux distribution from 4 to 6m.
3.2 A comparison with models: KL′M′ colours
We can compare the broadband observations against predicted colours derived from the latest set of theoretical models by Chabrier et al. (2000). Those ‘DUSTY’ models take account of dust species in the calculation of both the equation of state and opacity, besides allowing for scattering and absorption by dust in determining the radiative transfer equation. Chabrier et al. present predicted VRIJKL′M absolute magnitudes for low mass () dwarfs at ages from 0.1 to 10 Gyrs.
The L′ magnitudes synthesised from the DUSTY models are effectively on the UKIRT system, while the M-band magnitudes are matched to the Johnson system. As discussed in the previous section, this leads to only small differences in the M- and early L-dwarf régimes with respect to the observations collected in Figure 2. However, there are more significant differences at later spectral types. LSDSS estimate that M and M′ measurements differ by 4% at 2000K (L0) and by 9% at 950K (T5), with M fainter in both cases. At L′, synthesised magnitudes from theoretical models suggest that the UKIRT system gives brighter magnitudes than the MKO-NIR system by 0.05 mag. at L0, magnitude at L8 and magnitudes for T dwarfs (Stephens et al., 2001). These corrections are not yet determined precisely, so we have not attempted to adjust the models to match the MKO-NIR system. In addition, the models are known to treat dust incorrectly in T dwarfs, leading to infrared colours which are too red. The latter issue is discussed in more detail by LSDSS; our main concern are the M and early L dwarfs.
The models predict colours as a function of effective temperature, and comparison with observations therefore requires the adoption of a temperature/spectral type relation. That relation remains uncertain by K for late-type dwarfs. Our M dwarf scale is tied to Leggett et al.’s (1996) observations of GJ 1111 (M6.5) at TK, while current concensus places the boundary between the M and L spectral types at TK (Basri et al., 2000; Kirkpatrick et al., 2000; Schweizer et al., 2001). The L dwarf scale follows the scheme outlined by Reid et al. (1999), with the L/T transition at 1300/1400 K and Gl 229B (T6 - Geballe et al. 2001) at K.
Figure 2 shows the predicted colours for 1 and 10 Gyr. DUSTY models. At the infrared wavelengths considered here, those colours are primarily temperature dependent. Given the uncertainties, the model predictions are in good agreement with the observed colours in the (L′-M′) plane. Following the discussion above, the models are likely to be systematically too blue by magnitude at L0 (-0.05 mag. at L′; +0.04 at M) and mag. too blue at L8 (-0.1 mag. at L′; +0.05 mag. at M). These corrections move the predicted relations close to (L′-M′)=0 at spectral types L3 to L8, 0.2 to 0.3 magnitudes (2) redder than the observations. It is not clear whether the models match the observed transition to Rayleigh-Jeans flux ratios at earlier spectral types than M5, since the coolest model listed by Chabrier et al. has TK (spectral type M4.5).
In the (K-L′) plane the agreement between models and observations is less precise, although systematic differences between the UKIRT and MKO-NIR systems go some way to reducing the discrepancies. As noted above, the substantial offset between theory and observation for T dwarfs is not unexpected, and is considered in more detail by LSDSS. There are lesser discrepancies at earlier types, notably between M8 and L5/L6, where the models can be 0.3 magnitudes magnitudes redder than the observations, although systemic differences probably reduce the discrepancy to 0.25 magnitudes.
3.3 A comparison with models: colour-magnitude diagrams
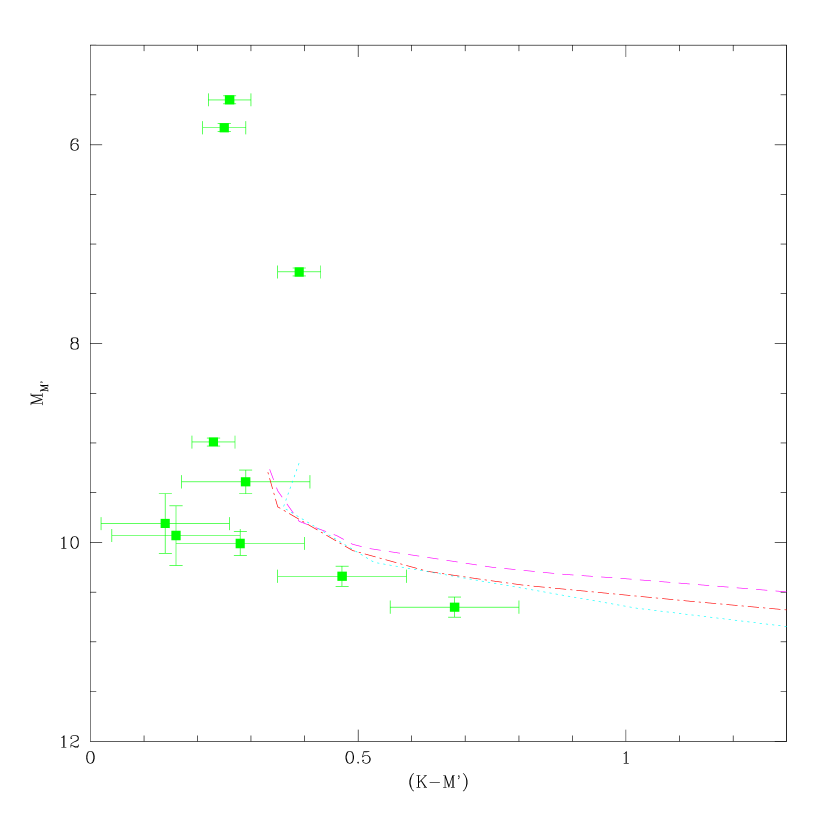
These results have potentially significant implications for analysis of infrared surveys, such as the proposed SIRTF Legacy projects, for very low-mass stars and brown dwarfs. Theoretical models have identified the 5m spectral region as a prime passband for searching for these low temperature objects. However, combining the (L′-M′) and (K-L′) colours from our observations and the LSDSS measurements indicates that the (K-M′) colours of late-M and L dwarfs are bluer than expected. Figure 3 illustrates this plotting the (MM, (K-M′)) diagram for the M and L dwarfs in Table 2 and for 2M0036+18 from LSDSS sample. The other three dwarfs with M′ photometry in the latter sample lack distance measurements at present. The absolute magnitude for 2M0746 has been corrected by +0.7 magnitudes to allow for its binarity. In comparison, we plot 0.5-, 1- and 5-Gyr isochrones from Chabrier et al. (2000). While the M dwarfs lie within 0.1 to 0.2 magnitudes (in (K-M)) of the isochrones, the L dwarfs show larger offsets, with, depending on its age, 2M0036+18 lying 0.35 to 0.6 magnitudes blueward of the theoretical isochrones.
There are at least three dimensions to the comparison made in figure 3: colour, absolute magnitude and age. An isochrone comparison tends to focus on colour/age at the expense of absolute magnitude. It is therefore instructive to make direct comparison between the models and empirical data for individual objects. The uncertainties in the temperature/spectral-type relation complicate such comparisons, but we consider two test cases:
-
2M0746 is the less controversial example. With a spectral type of L0.5, most temperature calibration schemes assign a temperature of K (see, for example, Schweizer et al., 2001), while the dwarf has a well-determined parallax and has been observed over a wide wavelength range. There is no detectable lithium absorption, setting a lower limit of 0.06M⊙. Table 3 compares some of its observed properties (allowing for binarity) against DUSTY predictions for dwarfs of similar temperature, spanning a range of ages. The model (K-M) colours are 0.28 to 0.38 magnitudes redder than 2M0746 (0.24 to 0.34 magnitudes, allowing for the likely M/M′ systemic offset). Moreover, while the predicted M-band absolute magnitudes lie within 0.2 magnitudes of the observed datum (hence our choice of MM in Figure 3), 2M0746 is 0.23 to 0.58 magnitudes brighter than the predictions at MK. Table 3 also compares the observed and predicted (I-K) colours; the models are 0.5 to 0.8 magnitudes redder than the data.
-
2M0036 is more problematic, since with a spectral type of L3.5, it falls in the region where temperature scales start to diverge. Schweizer et al. (2001), however, derive a temperature estimate of 1800K, based on Keck HIRES data, and we adopt that value for present purposes. As with 2M0746, there is no lithium absorption, excluding the 0.5-Gyr. model as a potential match. There is no suitable 1 Gyr model in the suite presented by Chabrier et al., but the 0.072 5 and 10 Gyr models both predict M-band magnitudes in good agreement with the observations. Again, the K-band absolute magnitudes are fainter than the observed value by magnitudes, the predicted (I-K) colours are up to 0.8 magnitudes redder than the observations, and the theoretical bolometric magnitudes are substantially fainter than the measured value222 Chabrier et al. note that the observed (R-I) colour for 2M0036 is significantly bluer than the DUSTY isochrones, and suggest that this stems from photometric error. We prefer the more traditional alternative of modifying the model to match the data.
Dust has become the universal panacea for reconciling theory and observations of cool dwarfs, but while variations in dust content might explain the scatter in (J-K) colours observed as a function of spectral type (Kirkpatrick et al., 1999; LSDSS), the optical/infrared colours suggest a more complex origin for the discrepancies noted here. If backwarming were responsible for the higher K-band fluxes observed in both L dwarfs, one might expect higher blanketting (than in the models) at optical wavelengths, and redder optical/infrared colours than predicted. In fact, Table 3 shows that the colours differ in the opposite sense. We note that the H2O line lists used in the computation of the DUSTY models are known to be incomplete at near-infrared wavelengths (Chabrier, priv. comm., 2001), and this undoubtedly contributes to the K-band discrepancies.
Figure 3 and Table 3 clearly indicate the importance of using empirical measurements at mid-infrared wavelengths to test current calibration of theoretical models of ultracool dwarfs. Those models will be extremely important in interpreting survey data obtained by SIRTF’s Infra-Red Array Camera (IRAC) for the purpose of determining the local space density of ultracool dwarfs. If the model fluxes are overestimated (by, for example, applying model (K-M′) colours to empirical K-band measurements), then distances to observed sources will be overestimated, leading to an underestimate of the local number density. The present comparison suggests that, in the case of the DUSTY models, using the theoretical M-band predictions directly to predict number counts is more reliable than following methods which scale fluxes relative to the currently better-observed near-infrared passbands. SIRTF will itself acquire additional calibration data through broadband observations of known nearby low-mass stars and brown dwarfs, but additional, higher spectral resolution ground-based data would be extremely useful in tracing the detailed spectral evolution at these wavelengths.
4 Summary and conclusions
We have presented 5m photometry for a sample of nine dwarfs with spectral types from M2.5 to L0.5. Combined with similar data from the literature, these observations show that for early-type M dwarfs and for late-type M and L dwarfs, with a relatively sharp transition at spectral types M5/M6. The lack of a corresponding feature in (K-L′) suggests that enhanced absorption at M′ is responsible, and the change in colour may be linked to increased CO absorption at 5m. Additional 3 to 5m spectroscopic observations of mid-type M dwarfs, comparable to those obtained of Gl 229A by Noll et al. (1997), would be particularly useful in confirming the origin of this behaviour and mapping the overall spectral evolution.
We have compared our results against theoretical predictions of the variation in colour with spectral type, derived from the DUSTY models of Chabier et al. (2000). The agreement between theory and observation is good in (L′-M′), although the models do not extend to temperatures above the observed colour change. At (K-L′), the DUSTY models are up to 0.25 magnitudes redder than the data between spectral types M7 to L4, once due allowance is made for the different photometric systems. Matching the observations against isochrones in the (MM, (K-M)) plane shows that the models are magnitudes redder than the observations. Direct comparison against empirical data for two bright L dwarfs suggests that this results primarily from an underestimate of the K-band flux, probably due to incomplete water line lists in the models. These issues need to be taken into account in deriving space densities of very low-mass stars and brown dwarfs from analysis of large-area, mid-infrared surveys, such as those scheduled for the SIRTF mission.
References
- (1)
- (2) Basri, G., Mohanty, S., Allard, F., Hauschildt, P.H., Delfosse, X., Martín, E.L., Forveille, T., Goldman, B. 2000, ApJ 538, 363
- (3)
- (4) Berriman, G., Reid, I.N. 1987, MNRAS 227, 315
- (5)
- (6) Bessell, M.S., Brett, J.M. 1988, PASP 100, 1134
- (7)
- (8) Burgasser, A.J. et al. 2001, ApJ, in press
- (9)
- (10) Carpenter, J.M. 2001, AJ 121, 2851
- (11)
- (12) Chabrier, G., Baraffe, I., Allard, F. & Hauschildt, P. 2000, ApJ 542, 464
- (13)
- (14) Dahn, C.C., Guetter, H.H., Harris, H.C., et al., 2000, in From Giant Planets to Cool Stars, ed. C.A. Griffiths & M.S. Marley, ASP Conf. Ser. Vol. 212, 74,
- (15)
- (16) ESA, 1997, The Hipparcos Catalogue, ESA SP-1200
- (17)
- (18) Geballe, T.R. et al. 2001, ApJ in press
- (19)
- (20) Gizis, J.E., Monet, D.G., Reid, I.N., Kirkpatrick, J.D., Liebert, J., Williams, R.J., 2000 AJ 120, 1085
- (21)
- (22) Johnson, H.L 1964, Bull. Tonantintzla and Tacubaya Obs., 3, 305
- (23)
- (24) Johnson, H.L. 1965, ApJ 141, 170
- (25)
- (26) Johnson, H.L., MacArthur, J.W., Mitchell, R.I. 1968, ApJ 152, 465
- (27)
- (28) Jones, H.R.A., Longmore, A.J., Allard, F., Hauschildt, P.H. 1996, MNRAS 280, 77
- (29)
- (30) Kirkpatrick, J.D., Reid, I.N., Liebert, J., et al. 1999, ApJ 519, 802
- (31)
- (32) Kirkpatrick, J.D., Reid, I.N., Liebert, J., Gizis, J.E. et al. 2000, AJ, 120, 447
- (33)
- (34) Krisciunas, K., Sinton, W., Tholen, K., Tokunaga, A., Golisch, W., Griep, D., Kaminski, C., Impey, C., Christian, C. 1987, PASP 99, 887
- (35)
- (36) Leggett, S.K. 1992, ApJS 82, 351
- (37)
- (38) Leggett, S.K., Allard, F., Berriman, G., Dahn, C.C., Hauschildt, P.H. 1996, ApJS 104, 117
- (39)
- (40) Leggett, S.K., Allard, F., Hauschildt, P.H. 1998, ApJ 509, 836
- (41)
- (42) Leggett, S.K., Allard, F., Dahn, C., Hauschildt, P. H., Kerr, T. H., Rayner, J 2000, ApJ 535, 965
- (43)
- (44) Leggett, S. K., Allard, F., Geballe, T. R., Hauschildt, P. H. & Schweitzer, A. 2001a, ApJ 548, 908
- (45)
- (46) Leggett, S.K. et al. 2001b, ApJ in press, LSDSS
- (47)
- (48) Monet, D.G., Dahn, C.C., Vrba, F.J., Harris, H.C., Pier, J.R., Luginbuhl, C.B., Ables, H.D. 1992, AJ 103, 638
- (49)
- (50) Noll, K.S., Geballe, T.R., Marley, M.S. 1997, ApJ 489, L87
- (51)
- (52) Reid, I.N., Gilmore, G.F. 1984, MNRAS 206, 24
- (53)
- (54) Reid, I.N., Hawley, S.L., Gizis, J.E. 1995, AJ110, 1838
- (55)
- (56) Reid, I.N., Kirkpatrick, J.D., Liebert, J., Burrows, A., Gizis, J.E., Burgasser, A., Dahn, C.C., Monet, D., Cutri, R., Beichman, C.A., Skrutskie, M. 1999, ApJ 521, 613
- (57)
- (58) Reid, I.N., Kirkpatrick, J.D., Gizis, J.E., Dahn, C.C., Monet, D.G., Williams, R.J., Liebert, J., Burgasser, A.J. 2000, AJ 119, 369
- (59)
- (60) Reid, I.N., Burgasser, A.J., Cruz, K.L., Kirkpatrick, J.D., Gizis, J.E. 2001a, AJ 121, 1710
- (61)
- (62) Reid, I.N., Gizis, J.E., Kirkpatrick, J.D., Koerner, D.W. 2001b, AJ 121, 489
- (63)
- (64) Schweizer, A., Gizis, J.E., Hauschildt, P.H., Allard, F., Reid, I.N. 2001, ApJ, in press
- (65)
- (66) Sinton, W.M., Tittemore, W.C. 1984, AJ 89, 1366
- (67)
- (68) Simons, D., Tokunaga, A. 2001, PASP, submitted
- (69)
- (70) Skrutskie, M.F. et al 1997, in The Impact of Large-Scale Near-IR Sky Survey, ed. F. Garzon et al (Kluwer: Dordrecht), p. 187
- (71)
- (72) Stephens, D.S., Marley, M.S., Noll, K.S., Chanover, N. 2001, ApJ 556, L97
- (73)
- (74) Tokunaga, A., Simons, D. 2001, PASP, submitted
- (75)
- (76) Tsuji, T., Ohnaka, K., Aoki, W. 1996, A&A 305, L1
- (77)
- (78) Tsuji, T., Aoki, W., Ohnaka, K. 1997, First ISO Workshop on Analytical Spectroscopy, ESA SP-419, p. 219
- (79)
- (80) Wehrse, R., Rosenau, P., Survenev, A., Liebert, J., Leinert, C. 1997, Ap. Sp. Sci. 255, 127
- (81)
Table 1: Targets Name RA (J2000) Dec Sp. (mas) Src. MV Date Obs. Gl 752A 19 16 55.3 +5 10 8.1 M2.5 1 10.28 14-5-01 Gl 811.1 20 56 46.6 -10 26 54.6 M2.5 1 10.65 14-5-01 Gl 643 16 55 25.2 -8 19 21.3 M3.5 1 12.70 14-5-01 Gl 406 10 56 28.7 +7 1 37 M5.5 2 16.59 19-1-01, 14-5-01 LHS 292 10 48 12.5 -11 20 8 M6.5 2 17.32 20-1-01, 14-5-01 LHS 2065 8 53 36.0 -3 29 32 M8 2 19.16 19-1-01, 19-1-01 2M0027 0 27 55.9 +22 19 33 M8 3 20-1-01 2M1444 14 44 17.1 +30 2 14 M8 3 19-1-01 2M0746 7 46 42.5 +20 0 32 L0.5 4 19.47 20-1-01
Spectral types are from Reid et al. (1995) for Gliese and LHS stars, and
from Gizis et al. (2000) for the three 2MASS dwarfs.
Absolute visual magnitudes are from Reid et al. (1995) except for 2M0746, where the
measurement is by Dahn et al. (2000).
2M0746 is a near-equal luminosity binary, separation 0.22 arcseconds (Reid et al.,
2001b).
References for parallax data:
1. Hipparcos catalogue, ESA (1997);
2. USNO, Monet et al. (1992);
3. Photometric parallax, Gizis et al. (2000);
4. USNO, Reid et al. (2001b).
The final column lists the date of our L′ and M′ observations.
Table 2: Photometry Name Sp. (J-K) K (K - L’) (L′-M′) M′ ref. BCM ref. Gl 752A M2.5 0.84 4.66 0.20 1,2 2.9 6 Gl 811.1 M2.5 0.83 6.93 0.24 1, 3 2.9 6 Gl 643 M3.5 0.80 6.74 0.30 1, 2 3.1 6 Gl 406 M5.5 0.98 6.08 0.39 1, 2 3.2 6 LHS 292 M6.5 0.94 7.96 0.53 7.65 1, 2 3.25 6 LHS 2065 M8 1.26 9.98 0.59 9.62 1, 4 3.5 7 2M0027 M8 1.05 9.56 0.41 9.39 4, 5 3.1 8 2M1444 M8 1.11 10.57 0.48 10.39 4, 5 3.2 8 2M0746 L0.5 1.24 10.49 0.80 10.02 4, 5 3.7 9
References: Photometry
1. JK from Leggett, 1992 (CIT system);
2. L′ from Leggett, 1992 (UKIRT system);
3. L′, M′ from UKIRT photometric standard star list;
4. L′ from our observations (MKO system);
5. JKs from 2MASS (see Carpenter, 2001).
Bolometric corrections:
6. mbol from Leggett et al. (2000)
7. mbol from Leggett et al. (2001a)
8. mbol derived assuming BCJ=1.9 (Figure 5, Reid et al., 2001a)
9. mbol from Reid et al. (2001a).
Table 3: Two specific comparisons Source Teff Mass MK MM (K-M) Mbol BCM (I-K) K Empirical 2M0746 2000 10.77 10.30 0.47 14.00 3.70 3.94 Models 0.5 Gyr. 2048 0.06 11.00 10.25 0.75 14.20 3.95 4.46 1 Gyr. 2012 0.07 11.24 10.43 0.81 14.45 4.02 4.71 5 Gyr. 1998 0.075 11.35 10.50 0.85 14.55 4.05 4.79 10 Gyr. 1998 0.075 11.35 10.50 0.85 14.55 4.05 4.79 Empirical 2M0036 1800 11.31 10.63 0.68 14.45 3.82 5.05 Models 0.5 Gyr. 1751 0.05 11.35 10.36 0.99 14.90 4.24 5.75 5 Gyr. 1754 0.072 11.68 10.66 1.02 15.20 4.54 5.90 10 Gyr. 1744 0.072 11.70 10.67 1.03 15.23 4.56 5.99
2M0746 - empirical data from Dahn et al. (2000) and
Reid et al. (2001a), corrected for duplicity
2M0036 - empirical data from Dahn et al. (2000), LSDSS and Reid et al. (2000)
Theoretical data from Chabrier et al. (2000). There is no suitable
1 Gyr model to match against 2M0036. Mbol is calculated assuming M.