Jet reorientation in AGN: two winged radio galaxies
Abstract
Winged, or X-shaped, radio sources form a small class of morphologically peculiar extragalactic sources. We present multi-frequency radio observations of two such sources. We derive maximum ages since any re-injection of fresh particles of 34 and 17 Myr for the wings of 3C 223.1 and 3C 403, respectively, based on the lack of synchrotron and inverse Compton losses. On morphological grounds we favour an explanation in terms of a fast realignment of the jet axis which occurred within a few Myr. There is no evidence for merger activity, and the host galaxies are found to reside in no more than poor cluster environments. A number of puzzling questions remain about those sources: in particular, although the black hole could realign on sufficiently short timescales, the origin of the realignment is unknown.
keywords:
accretion, accretion discs – galaxies: individual (3C 403, 3C 223.1) – galaxies: jets – galaxies: nuclei – galaxies: interactions – radio continuum: galaxies1 Introduction
‘Winged’ or ‘X-shaped’ extragalactic radio sources are notable for their peculiar radio morphologies, which may indicate realignments of the axes of their radio jets. These sources have large scale extrusions of radio plasma apparently beginning close to the core, which are about the same length as, or longer than, the presently active lobes. Determining if jet reorientation is required, and the timescales on which any realignment takes place provides information which may be used in understanding the process of jet formation. In particular we may address whether the jet axis is related to the spin-axis of the black hole, or that of the accretion disc.
Possible mechanisms for the formation of these objects include expansion of old, differently aligned lobes; backflow into the cavity of such lobes; and relatively slow conical precession of the jet axis, resulting in the observed x-shaped morphology by projection. These models will be dealt with in more detail in section 5.
In this paper we present multi-frequency, high-resolution, high-sensitivity radio observations of two such ‘winged’ sources – 3C 223.1 and 3C 403 – in an attempt to constrain their manner of formation, and the timescales involved. These sources are two of the 7 least luminous ‘FRII’ sources in the 3CR catalogue [Bennett 1962, Spinrad et al. 1985]. We note that all known sources with this morphology show radio luminosities close to the FRI/FRII break (1025W Hz-1 at 178 MHz; Fanaroff & Riley (1974)).
As both sources discussed here are narrow–line radio galaxies, the assumptions of simple Unified Schemes (Scheuer 1987; Barthel 1989), as well as the length/width ratio of the lobes and wings, require that the large linear size of the wings ( twice that of the active lobes) cannot be explained as the projection effect of a small excrescence.
We discuss the observations in section 2. We describe the morphology of the sources, including their polarization structures (3.1), consider the distribution of the radio spectra across the sources, and derive maximum particle ages (3.2) and examine their rotation measures and (de)polarization properties (3.3). We briefly comment on other possibly related sources in section 4. We compare our radio data with the expectations of different formation scenarios in section 5. Finally, we comment on the possibilities of achieving the required timescales for reorientation of the jet axis, given observations of the host galaxies in the literature (6.1) and recent theoretical advances (6.2).
Throughout the paper we assume a q0=0.5, =0 cosmology with H0 = 65 km s-1Mpc-1.
| Source | RA (J2000) | dec (J2000) | z | S178MHz | log(P178) | lobe | lobe | largest angular | wing projected |
|---|---|---|---|---|---|---|---|---|---|
| (Jy) | (W Hz-1) | (arcsec) | (kpc) | size (arcsec) | size (kpc) | ||||
| 3C 223.1 | 09 41 23.92 | +39 44 41.7 | 0.1075 | 8.1 | 25.29 | 85 | 170 | 170 | 340 |
| 3C 403 | 19 52 15.29 | +02 30 28.0 | 0.059 | 28.3 | 25.30 | 110 | 130 | 230 | 275 |
S178 is on the scale of Roger, Bridle & Costain (1973) using conversion factors from Laing & Peacock (1980). The value for 3C 223.1 has been interpolated from flux densities at neighbouring frequencies quoted in Kellermann, Pauliny-Toth & Williams (1969), adjusted to the present scale. The value for 3C 403 is the 3CR value, corrected to the present scale, as there is no 4CT flux density. (The value quoted by Kellermann, Pauliny-Toth & Williams (1969) is in fact the 4C value, and is clearly affected by partial resolution.) Redshift for 3C 223.1 is from Sandage (1966) and 3C 403 from Sandage (1972). P178 is calculated using spectral index =0.67
2 Observations
2.1 Previous observations at radio wavelengths
High resolution maps at 8 GHz have been presented by Black et al. [Black et al. 1992] [B92]. At 2.5 arcsec resolution jets are detected in the north and east lobes of 3C 223.1 and 3C 403 respectively. Higher resolution (0.25 arcsec) maps reveal complex hotspots (B92). The counterjet-side hotspot of 3C 403 has a more extended, simple structure in comparison to the series of high brightness compact features on the jet side. 3C 223.1 contains large resolved hotspots in both active lobes with similar peak surface brightnesses. Both sources vary in width along the length of the active lobes. This is particularly prominent in 3C 403 where the bright knot coincides with a sharp pinching in of the lobe.
2.2 Radio data
3C 223.1 was observed with the NRAO VLA at three frequencies, 3C 403 at two. New observations were combined with archival data, in order to create datasets with as much uv coverage and as much uv overlap between frequencies as possible. Both sources were observed with the Effelsberg 100m Telescope at 32 GHz. 3C 223.1 was also observed with the Ryle Telescope at 15 GHz. (The low declination of 3C 403 make it unsuitable for observations with this east-west array.) All flux densities were adjusted to the Baars et al (1977) scale, using standard calibrators. Polarization position angles were obtained using assumed polarization PA 33∘ of 3C 286. Table 2 lists the observing parameters.
| date | tel. | obs. | freq | bandwidth | duration |
| (GHz) | (MHz) | (mins) | |||
| 3C223.1 | |||||
| 01 & 15/08/82 | B | SS | 1.4 | 50 | 118 |
| 26/11/94 | C | JDT | 1.4 | 50 | 40 |
| 01 & 15/08/82 | B | SS | 4.9 | 50 | 62 |
| 19/04/83 | C | SS | 4.9 | 50 | 104 |
| 11/04/95 | D | JDT | 4.9 | 50 | 50 |
| 25/05/90 | A | AB | 8.4 | 25 | 114 |
| 31/03/89 | B | AB | 8.4 | 25 | 88 |
| 02/07/89 | C | AB | 8.4 | 50 | 11 |
| 26/11/94 | C | JDT | 8.4 | 50 | 136 |
| 24/11/89 | D | AB | 8.4 | 50 | 10 |
| 11/04/95 | D | JDT | 8.4 | 50 | 50 |
| 04/95 – 02/96 | Ryle | GP | 15.2 | 68.3 | 96hr |
| 16–17/04/97 | Effel | WR | 32 | 2000 | 27x15 |
| 3C 403 | |||||
| 10/06/94 | B | JDT | 1.4 | 25 | 140 |
| 27/11/94 | C | JDT | 1.4 | 50 | 38 |
| 02/07/89 | C | AB | 8.4 | 50 | 25+23 |
| 27/11/94 | C | JDT | 8.4 | 50 | 37+37 |
| 31/12/89 | D | AB | 8.4 | 50 | 9+8 |
| 11/04/95 | D | JDT | 8.4 | 50 | 27+24 |
| 17/04/97;21/05/97 | Effel | WR | 32 | 200 | 15x15 |
Telescope: refers to VLA array where applicable
Observers: AB = A. Black; JDT = J. Dennett-Thorpe; GP = G. Pooley; WR
=W. Reich; SS = S. Spangler.
The VLA observations were reduced entirely within aips. The flux densities were calibrated using the standard VLA calibrators, and secondary calibrators observed between the target sources. The data from a single array were both externally and self-calibrated before being combined with data from other arrays. When combining the data, progressively more compact configurations were added, with further iterations of self-calibration at each stage.
Care was taken to ensure that the observations in the synthesis arrays at different frequencies were matched as closely as possible in their uv coverage. To achieve this, observations at different frequencies had identical minimum and maximum uv limits and Gaussian uv tapers applied during the imaging process in order to generate similar synthesised beams. This procedure then compensates for differences in density of uv coverage near the outside of the uv plane. We favoured the use of the same minimum uv limits at all frequencies, rather than the designation of a (poorly known) ‘zero-spacing’ flux density. The images produced by imposing inner uv limits and uv tapers were insignificantly different from those obtained by the cruder method of an outer uv cut-off only.
The extended low-luminosity wings are of great interest to us and therefore extra care had to be taken with the imaging procedure [Dennett-Thorpe 1996]. The final images were made by cleaning with the aips routine imagr, and extensive testing ensured that these results reproduced those using maximum entropy methods. Simply comparing the total flux density in the clean components with that in the source (in these or in single dish observations) is an inadequate measure of image fidelity for our purposes. We therefore compared (as a ratio of images) the image with the clean components removed with an image of the clean components alone, paying close attention to the low surface brightness wings. We required that 90% of the flux should be in clean components everywhere in the source above the 6 contour. (99% of the total flux density and 95% of the wings’ flux density is in clean components.)
The large size of 3C 403 made it necessary to use two pointing centres at 8.4 GHz, one centred on each hot-spot. The durations in table 2 refer to these separate pointings. The final image was produced by combining in the image plane using the aips task vtess. The final effective uv coverage will therefore not be the same as at 1.4 GHz. Tests with 3C223.1 showed, however, that similar differences in uv coverage produced 1% changes in flux density, and we do not believe that there is cause for concern.
The Ryle Telescope observations were performed in eight 12 hour periods in 1995 and 1996. The baseline coverage is from 900 to 58000 wavelengths. To obtain good uv coverage the observations were conducted in 4 configurations which included baselines from 1800 to 58000 wavelengths in 32 equal steps and also in one compact configuration which included baselines 0.5, 1.5 and 2.5 times 1800 wavelengths. The data were initially reduced using the dedicated postmortem package, before being transferred into aips for self-calibration and imaging. The Ryle Telescope observes Stokes I+Q (figure 2), whilst we require total intensity (Stokes I) only for fitting procedures in section 3.2. We have calculated the necessary correction factors using the 8.4 GHz data: a good estimation as the RM for this source was only 34 rad m2 [Simard-Normandin et al. 1981]. We took the 8.4 GHz VLA images in total intensity and Stokes Q (convolved to the resolution of the Ryle image), and from this calculated an estimation of the correction factor I/(I+Q) in each region. This correction factor was then applied to the measured flux densities at 15 GHz, to give the required Stokes I flux densities. The correction factors were: 0.995 for the entire source; 0.94, 1.14 for the S and N lobes respectively; 0.99, 0.87 for the E and W wings respectively.
The Effelsberg data were reduced using the standard NOD 2 based software package for ‘software beamswitching observations’ [Morsi & Reich 1986]. The individual maps have been combined using the plait algorithm by Emerson and Gräve [Emerson & Graeve 1988], which simultaneously de-stripes a set of maps observed at different scanning directions. Primary flux calibration was performed using 3C 286 assuming a flux density of 2.1 Jy. The observations were taken in raster-scan mode, with multiple passes over the source. The weather throughout the observations of 3C 223.1 was significantly worse than that during the 3C 403 observations. All 15 scans were used in 3C 403, but 5 scans were dropped from the 27 observations of 3C 223.1 due to high noise levels. Single pixel noise spikes were removed by hand from each of the scans. The estimation of the noise levels in the final images is complicated both by the rotation of the sky in the Alt-Az plane during the course of the observations (which casues fewer scans to contribute at the edges of the final image), and by the slightly subjective nature of the removal of noise spikes. We have estimated the noise from off-source regions of the images well away from their edges. The quasi-on-off scanning technique used for the single-dish observations can introduce small zero-level offsets into the final image. From the positive value of the noise surrounding our images post-reduction, we estimate that there was a positive zero-level of 5 mJy in both cases. We have therefore subtracted this from both images, and included this in our error estimates.
| source | freq | uv limits | beam | noise |
|---|---|---|---|---|
| (GHz) | (k) | (arcsec) | (mJy/beam) | |
| 3C 223.1 | 1.4 | 1.0 – 20.0 | 10.0 | 0.37 |
| 4.8 | 1.0 – 20.0 | 10.0 | 0.16 | |
| 8.4 | 1.0 – 20.0 | 10.0 | 0.13 | |
| 32 | – | 27.0 | 3.5 | |
| 3C 403 | 1.4 | 0.75 - 40.0 | 4.5 | 0.15 |
| 8.4 | 0.75 - 40.0 | 4.5 | 0.11 | |
| 32 | – | 27.0 | 5.0 |
3 Results
3.1 Morphology and polarization structure
Figs 1 (a) –(d) show total intensity images at 1.4 and 8 GHz, with the apparent magnetic field vector superimposed (these are rotated by exactly 90∘ from the E-vector directions and uncorrected for any Faraday rotation; see section 3.3). Figs 1 (e) & (f) show the 32 GHz total intensity (greyscale) overlaid on 8.4 GHz observations convolved to the same resolution. Fig 2 shows the 15 GHz total intensity image.
| 3C 223.1 | 3C 403 |
|---|---|
(a)
|
(b)
|
(c)
|
(d)

|
(e)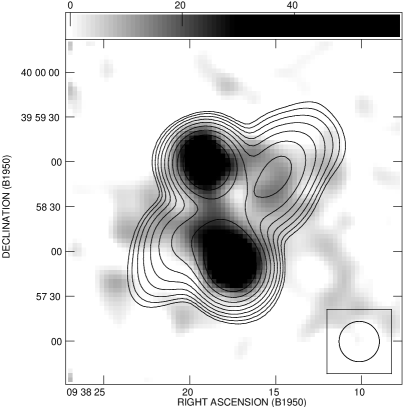
|
(f)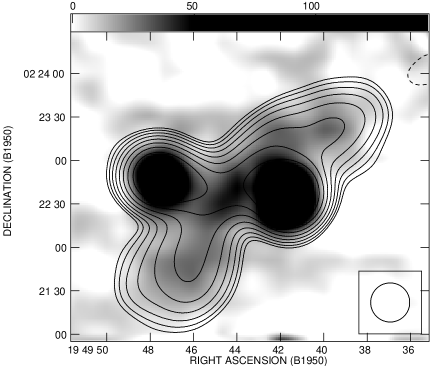
|

Both sources show a high degree of polarization (15–30%) in the wings, and an apparent magnetic field structure parallel to the edge of the source, and along the length of the wings (see also sect. 3.3). Higher resolution images (B92) showed similar wrapping around the source edges, as well as complex internal structure. The high degree of polarization and wrapping of field lines around the edges of the source can be explained as compression of tangled fields at the surface of the lobes [Laing 1980], and is typical FRII-type behaviour (e.g. Burch 1979; Miller 1985).
3C 223.1: This source was imaged at lower resolution than 3C 403, because it is fainter, and we wished to have high S/N ratio in the low surface brightness wings. The lower resolution renders the jet (B92) invisible, and the hotspots comprise a large fraction of the area and flux density of SW & NE active lobes. It is possible that deeper observations would show that the wings extend further than is apparent from Figs 1a and c. The magnetic field vectors in the SW lobe swing smoothly into the SE wing, aligning themselves with the ridge of emission that also connects the two components. The northern components are not as closely connected as the southern components, as a trough in total intensity separates the lobe and wing. However, the magnetic field connects the NE lobe and NW wing in the same manner as the southern components. In these images the the magnetic field appears to be directed along the length of the wings, even towards the tips, although here deeper imaging may reveal a more typical ‘wrap-around’ behaviour.
3C 403: In the 1.4 and 8.4 GHz images, which have higher
resolution than those of 3C 223.1, the E & W hotspots are clearly
visible, as is the jet-knot in the eastern lobe. The eastern wing and
lobe are connected by a region of higher surface brightness than the
rest of the SE wing, and by the magnetic field lines which run from
the base of the NE lobe into the SE wing. The pinching-in of the lobes
near the core also appears to separate the eastern and western
components, with the field lines running between the two indentations
and joining smoothly into the fields in the wings and lobes. From the
sharpness of the decline in surface brightness at the edges of the
visible lobes and wings, we deduce that we have not missed any part of
the source which fades into the noise. The field lines in the wings
of 3C 403 show loops almost the size of the wings, but not extending
right to the tips. The fractional polarization around the western edge
of the SE wing of 3C 403 reaches 50% and drops to 5% in
the centre of the wing.
3.2 Radio spectra
3.2.1 Spectral index distribution
Of all the sources in the sample of low-redshift radio galaxies observed by Dennett-Thorpe et al. [Dennett-Thorpe et al. 1999], these two sources have both the lowest minimum spectral index (i.e. flattest spectra) and the least spectral gradient anywhere in the source.
The flux densities plotted in fig. 3 are calculated using images shown in fig. 1. For the 1.4 GHz, 5 GHz and 8 GHz images the flux is integrated over the region above their 3 contour. This is indistinguishable from results obtained by integrating over the 3 contour at the lower frequency. Because of the poor signal to noise on the 32 GHz maps, where the 3 contour does not meaningfully trace any winged structure, we integrated over the area enclosed by the 3 contour on the 8 GHz map convolved to the same resolution (i.e. the contours on figs 1e & f). The flux densities have been calculated for the entire source, and for regions of the source separately (i.e. each active lobe and wing) by dividing the source crudely into these regions. There has been no attempt to remove the core flux density because this contributes a tiny fraction of the source flux density at 8 GHz (0.9% for 3C 223.1 & 0.2% for 3C 403; Black 1992).
The spectra in the low surface brightness regions are very sensitive to changes in the zero-level. For the 32 GHz single-dish observations, the error is potentially serious, and a correction to the mean level was made (see Section 2.2). In order to take account of uncertainties in the correction, we have added an additional rms error of 5 mJy/beam in quadrature to the estimate derived from the images. At all frequencies, a further 3% error was added, again in quadrature, to take account of calibration offsets.
The lengths of the minimum baselines indicate that the largest structure is sampled at all frequencies, and there are no indications—such as negative bowls—of missing flux density. The total flux densities from our observations agree well with values interpolated from measurements in the literature. The inner uv plane is least densely covered in the 8.4 GHz observations, and we note in connection with this that a lack of baselines adequately sampling the source structure will tend to decrease the detected flux at this frequency. In this case this will falsely steepen the observed spectrum, although the use of dual-pointing mosaiced observations helps to mitigate the effect.
We have obtained the best power-law fit S. The results are presented in the first three columns of table 4, including a goodness of fit parameter Q (the probability that the should exceed the calculated value by chance). If either the 15 GHz or the 32 GHz data are omitted, the results are unchanged to within the errors. The results without application of offsets at 32 GHz are also within the quoted errors.
The results for both sources show good fits can be obtained with power-law spectra all the way to 32 GHz (with the possible exception of the northern lobe of 3C 223.1, where a low 15 GHz point results in a poor fit). The fitted spectra have 0.66 0.80 for all regions of both sources. 3C 223.1 shows marginal evidence for steeper spectra in the active lobes than in the wings ( 0.08). This result does not depend on the lower quality 15 GHz and 32 GHz observations: the same is true when the fit is to the 1.4, 5 and 8 GHz observations alone. This might occur if flux was missing at lower frequencies due to poorer uv coverage, although there is no evidence for this. With the exception of the western wing of 3C 223.1, it is also noted that all parts of each source can be fitted with the same power law.
In no region of either source can we exclude the hypothesis that the spectrum is a power law over our entire frequency range. Indeed, there is no evidence for any steepening of the spectrum in 3C 403. In 3C 223.1, however, we cannot exclude a break frequency as low as 16 GHz in the E wing, with the assumptions given in the following section.
| power law fit | JP fit | ||||
| region | Q | (GHz) | max age (Myr) | ||
| 3C 223.1 | |||||
| total | 0.75 | 0.02 | 0.487 | ||
| N lobe | 0.75 | 0.02 | 0.032 | ||
| W wing | 0.66 | 0.03 | 0.870 | 50 | 16.6 |
| S lobe | 0.77 | 0.02 | 0.254 | ||
| E wing | 0.70 | 0.03 | 0.130 | 12.0 | 33.9 |
| 3C 403 | |||||
| total | 0.78 | 0.02 | 0.313 | ||
| E lobe | 0.78 | 0.02 | 0.592 | ||
| SE wing | 0.80 | 0.03 | 0.095 | 70 | 16.1 |
| W lobe | 0.77 | 0.02 | 0.451 | ||
| NW wing | 0.77 | 0.03 | 0.275 | 60 | 17.3 |
(a)
|
(b)
|
3.2.2 Particle ages
Our aim is to set an upper bound to the time since particle acceleration, using the fact that inverse Compton and synchrotron losses are comparable in the lobes of 3C 223.1 and 3C 403. We assume that the initial electron energy spectrum is a power-law extending to infinite energy, that the electrons lose energy only by synchrotron and inverse Compton losses and that the magnetic field remains constant. The age we calculate is then the age since injection of this electron population. A larger particle age would require that the magnetic field had been weaker in the past; in the more likely event that the magnetic field was stronger in the past, the true age would be even lower than these limits. Other complicating factors, such as continuing input of energetic particles also require the true ages to be lower than those we derive here.
We regard it as most likely that synchrotron losses occur with pitch-angle isotropization (Jaffe & Perola, 1973). In this case it is straightforward to include inverse Compton scattering off the microwave background radiation, which is independent of pitch angle. The expression for the break frequency, is (Pacholczyk, 1970):
where is Pacholczyk’s constant = 1.12 103 nT3 Myr2 GHz, and the equivalent magnetic field due to the microwave background, nT. Ages as a function of the ratio of magnetic to CMB radiation energy density are shown in fig. 4. The break frequency has a maximum value where the magnetic field is .
We also fit JP spectra to the wings, using an injection spectrum (Table 4, column 4). Injection spectra steeper than this will decrease the calculated age. The spectrum of the source need not be represented by a pure JP spectrum, but, crucially, there will be an exponential cut–off in the spectrum with a break frequency corresponding to , as no process can flatten the spectrum at higher frequencies. A range of magnetic field strengths and/or the absence of electron pitch–angle scattering can both be considered as mixing in other (effective) magnetic field contributions. This will steepen the spectrum below this break, but never flatten the high-frequency tail. By fitting a JP spectrum we cannot overestimate the break frequency corresponding to the exponential cut-off and thus our ages are true upper limits.
If we fit a JP spectrum, we can therefore derive an upper limit to the time since particle acceleration which is independent of the magnetic field strength (and therefore valid also for a spectrum of field strengths). The maximum ages we derive for the two sources (column 6 Table 4) are 33.9 Myr for 3C 223.1 and 17.3 Myr for 3C 403.

3.3 Rotation measures and Depolarization
The wavelengths at half-maximum polarization, , tabulated for 3C 223.1 and 3C 403 by Tabara & Inoue [Tabara & Inoue 1980] are 21cm & 17cm respectively, suggesting that we might expect substantial depolarization at 1.4GHz in 3C 403. This is not seen. We compared ‘quasi-single dish’ fractional polarizations () with those tabulated in Tabara & Inoue, for all the sources from Dennett-Thorpe et al. (1999), including the two in the present paper. This revealed two sources of 20 cm polarization data used by Tabara & Inoue which had consistently low fractional polarizations. (These are Seielstad & Weiler [Seielstad & Weiler 1969] and Bologna, McClain & Sloanaker [Bologna et al. 1969].) Our results and all other single dish measurements agree to within the errors, and imply that 20cm for both sources.
From these observations we have also calculated ‘quasi-single dish’ polarization position angles (arctan)) and the changes in these values between 1.4 & 8 GHz. Images of the position angle changes were also produced (for points where the 1.4GHz total intensity image was above 3). Both these measures give good agreement with the rotation measures calculated in Simard-Normandin, Kronberg & Button [Simard-Normandin et al. 1981]: 3C 223.1 has RM rad m-2, 3C 403 has RM rad m-2.
An investigation of the position angle variations between 1.4 and 8.4 GHz show little change or variation across the source in 3C 223.1. In 3C 403, there is gradient across the source (see fig. 5), whose magnitude and scale is consistent with the effect of a foreground screen in our Galaxy [Simonetti et al. 1984, Leahy 1987]. Also, it is noted that 3C 403 is seen through the Scutum Arm of the Galaxy, so a negative contribution to the rotation measure from this is expected [Vallée et al. 1988].
In order to assess the likely environment of the two sources, we compare the standard deviation of the polarization position angle changes to those found using similar data for a sample of 3C sources in the same P–z range [Dennett-Thorpe et al. 1999]. The results are presented in fig. 6. There are two sources with considerably higher variations of polarization position angle: 3C 388 and 3C 452. 3C 452 is in a region of sky in which extraglactic sources have a large excess of negative rotation measures [Simard-Normandin & Kronberg 1980]. It is likely that the (de)polarization structure seen in 3C 452 is due to this, probably Galactic, feature [Dennett-Thorpe 1996]. 3C 388 is the only source of this sample known to lie in a rich cluster [Fabbiano et al. 1984]. 3C 405 (Cygnus A), a member of the sample for which we did not have comparable data, would also have shown a high variation of PA [Dreher et al. 1987]. From various studies of clustering in the literature all the other sources appear to be isolated, or at best lie in open groups and poor clusters. Thus, the low RMs and low depolarising frequency are consistent with both sources being in relatively gas poor environments, no richer than a poor cluster.
(a)3C 223.1

(b)3C 403


4 Comparison with other sources
Leahy & Parma [Leahy & Parma 1992] showed that winged sources (defined by the condition that the wings are at least 80% of the length of the active lobes) make up 7% of the radio galaxy population with luminosities between 3 1024 and 3 1026 WHz-1 at 1.4 GHz. They identified 11 winged sources, of which 7 have clear FRII structure, 2 are borderline cases more obviously related to FRIIs, 1 is too distorted to classify and only 1 (NGC 326; see below) is an unambiguous FRI. The phenomenon is therefore primarily associated with low-luminosity FRII sources.
In this section we contrast the properties of a number of well-studied
sources showing evidence for change of jet direction or episodic
activity, with those of 3C 223.1 and 3C 403.
B2 0828+32
The low luminosity radio galaxy B2 0828+32 (S1.4GHz = 2.1Jy; z = 0.0507) is morphologically very similar to the sources discussed here and has been the subject of a number of studies. Its active lobes project 320 arcsec (430 kpc) and its wings at least twice this distance. In addition to the overall morphology, the magnetic field structure is very similar to those of the sources presented in this paper. In particular, it exhibits high fractional polarization in the wings (up to 40%), alignment of the magnetic field along the wings, and little depolarization between 0.6 and 10 GHz[Parma et al. 1985, Gregorini et al. 1992, Mack et al. 1994].
The active lobes have a fairly flat spectrum which steepens in the wings: (lobes) , (wings) [Parma et al. 1985, Gregorini et al. 1992]. This is confirmed by other data, including 10.6 GHz Effelsberg observations [Mack et al. 1994, Klein et al. 1995]. From WSRT 0.6GHz & Effelsberg 10.6 GHz data, Klein et al. [Klein et al. 1995], find very little change in spectral index over the active lobes, but a significant steepening of the spectrum towards the tips of the wings (except for a flat-spectrum feature in the northern wing). On this basis the authors argue in favour of formation in terms of a slow conical precession.
The break frequency in B2 0828+32 is lower by a factor of ten or more
than in the sources studied here[Klein et al. 1995], implying a greater
maximum time since particle acceleration (the redshift is comparable
to that of 3C 403). Evidence – albeit weak – for a galaxy-galaxy
interaction within the last 108 years was found by Ulrich &
Rönnbach [Ulrich & Rönnback 1996].
3C 293
3C 293 is a borderline FRI/FRII structure with an extended 200 kpc source [Bridle et al. 1981] around a smaller 2 kpc misaligned double structure within the steep spectrum core [Akujor et al. 1996]. Its structure could therefore be interpreted as an extreme case of a winged source with very short active lobes. In contrast to 3C 223.1, 3C 403 and B2 0828+28, the host galaxy of 3C 293 (z=0.0452) shows obvious signs of interaction [Martel et al. 1999, Evans et al. 1999]: it has a tidal tail, a nearby companion and copious amounts of dust and CO. Although it has been suggested that the misaligned structure might be produced by pressure gradients or collisions with gas clouds [Bridle et al. 1981, van Breugel et al. 1984], this interpretation encounters problems if the jet is relativistic [Evans et al. 1999] and the hypothesis of change of jet direction again seems more likely.
It is intriguing that the source with the shortest ratio of active
lobe length to wing length is the only one which shows clear evidence
for a recent merger.
Double–double giant radio sources
Recently Schoenmakers et al [Schoenmakers et al. 1999b] have shown that a number of giant radio galaxies have a complex structure which includes a second, inner pair of radio lobes very similar to the outer pair. In these sources the angle of the new jet axis is with 10∘ of the old jet axis. In B 1834+620, the presence of a hotspot in one of the outer lobes allows an upper limit of a few Myr to be placed on the time for which the central activity was ‘turned off’ before entering a new phase of activity [Schoenmakers et al. 1999a, Lara et al. 1999].
These are possibly close relatives of the winged sources, because they
too display multi-phase activity, which clearly has a nuclear
origin. However, the unchanged alignment of the source axis between
phases in the double-double giants known to date may indicate an
important difference.
Wings in FRI sources?
NGC 326 [Ekers et al. 1978, Worrall et al. 1995], a nearby FRI radio galaxy, is often
compared with the winged sources because its morphology implies a
change of direction of the jet axis. In this case, there are no
excresences starting close to the core, but rather a change of
direction in the radio plasma where the jets terminate. Although
this is perhaps not very clear on the northern side of the
source, it certainly appears to be the case on the south. For this
reason has been called a ‘Z-shaped source’, and is morphologically
distinct from the sources considered here. Leahy & Parma
[Leahy & Parma 1992] note that Z- or S-shaped distortions are commonplace
in FRI sources. It could be that the mechanism of jet realignment is
the same in both FR classes, but that differing mechanisms of lobe
formation lead to the two observed morphologies.
We conclude from this comparison that the phenomenon of wings appears to be restricted to low-power FRII sources. It may be that 3C 293, which is undergoing a merger, may be an extreme example. Evidence for multiple phases of activity without significant changes of jet direction is provided by the double-double sources. In contrast, changes of orientation do appear to occur in FRI sources, but give rise to S-shaped distortions rather than wings.
5 Formation models: Constraints from the radio data
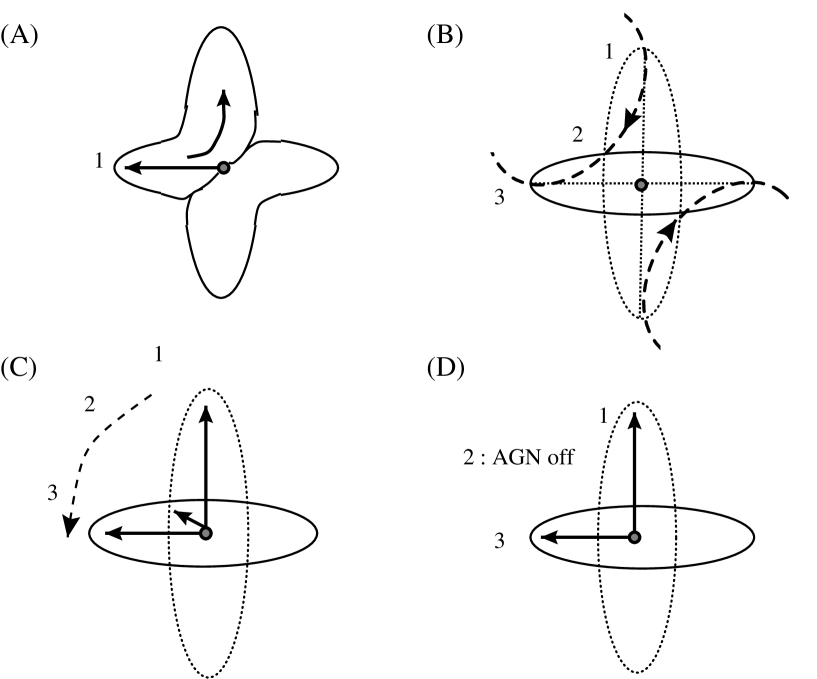
In fig. 7 we present a sketch of the four formation scenarios discussed here. These are:
- A
-
Backflow from the active lobes into the wings.
- B
-
Slow, conical precession of the jet axis.
- C
-
Reorientation of the jet axis during which the flow continues.
- D
-
As model C, but with the jet turned off or at greatly reduced power during the change of direction.
If spectral gradients had been detected in our sources, they could distinguish between some of these models. In the sudden reorientation model (C) or multiple burst model (D), with no particle reacceleration or backflow into the relic lobes, the oldest relativistic electrons would be near the centre, whereas the pure backflow model (A) would have the oldest particles at the tip of the wings. Leahy & Williams [Leahy & Williams 1984] also suggested a hybrid model in which wings are formed by backflow into cavities of ‘relic lobes’. The addition of backflow might leave a spectral signature, but would change the picture from the simplest case described above. The more surprising result found here, that no spectral curvature appears up to 32 GHz, will be used below to constrain the models in other ways.
Attempts to use the polarization characteristics of the sources to constrain their formation are frustrated by the dissimilarity of the sources. While all wings show remarkably high percentage polarization, there is considerable difference in the distribution and alignment. (This difference remains when 3C 403 is convolved down to the same linear resolution as is used for 3C 223.1.) In 3C 223.1 the projected magnetic field runs parallel to the wings, and is maximal in the centre. In 3C 403, however, the field ‘wraps–around’ the edges of the wings, and falls in the centre of the wings. The resulting field configuration is likely to have a complex dependence on the initial conditions, backflow and expansion, which cause compression, expansion and shear of the field. What is not clear is why one should dominate in one source, the other in another.
5.1 Backflow and buoyancy
The idea that excrescences near the host galaxy are overshoots of the backflow of radio-emitting plasma along the active lobes (Model A) (Leahy & Williams 1984) is an attractive one for relatively small excrescences such as are found in 3C 382 and 3C 192 [Baum et al. 1988]. It becomes untenable for the wings of sources such as 3C 223.1 and 3C 403, where the wings are longer than the active lobes. (The active lobes are not strongly foreshortened by projection: see Section 1.) As realised by Leahy & Parma [Leahy & Parma 1992], backflow combined with buoyancy effects [Gull & Northover 1973] cannot be solely responsible for the formation of the wings: buoyant expansion is subsonic, and therefore cannot push faster than the active lobes, whose expansion is driven by strong shocks at the hotspots. A very peculiar distribution of IGM with a strongly non-spherical distribution would be required.
Buoyant forces could potentially cause the expansion of relatively small initial wings (e.g. produced by backflow). However, wings formed by such expansion would rapidly fall below the limit of detection; the flux density of an adiabatically expanding lobe falls at least as fast as (linear size)-4. (The decline is steeper in the case of downcurved spectra.) Consider a generous estimate of the size of the maximum feasible backflow wings: that they were originally the size of the active lobes, and have buoyantly expanded to their present state. We see that the wings must have been at least 5 times as luminous as the presently active lobes, and therefore conclude that they could not have been backflow excresences, but must have been fed by jets directed along their axes. From this calculation, we also see that the jets must have injected particle and magnetic energy at significantly higher rates into these first lobes, that these were created in a significantly denser medium than the presently active equivalents, or (most likely) that they were originally larger in extent than the presently active lobes.
5.2 Conical precession
The conical precession model (B in fig. 7, Parma et al. 1985; Mack et al. 1994) requires not only a fortuitous angle between the precession cone and angle to the line of sight, but also a happy accident of the positions at which the source first switched on, and its position now. It therefore seems unlikely that we can explain the number of such sources seen, or the lack of other related sources (Leahy & Parma, 1992).
In detail, the morphologies of these two sources do not seem to fit this model either. A relatively high surface-brightness structure linking the wing and lobe would be expected if the morphology arose from a special projection of a slowly precessing source. With the exception of the SE region of 3C 223.1, there is a notable lack of such a feature. The total intensity images may indicate connection between the wings and the lobes, but there is a notable asymmetry this respect in 3C 223.1 (a trough in total intensity on the NW connecting region, and a smooth, bright region in the SE). Further, the pinching-in of the wings at the base also argues against any interpretation in terms of slow motion of the jet axis (both models B & C). Given these arguments, it is more likely that such slow precession can be used as an explanation for Z-shaped sources such as NGC326 (Sect. 4), than sources such as 3C 403 and 3C 223.1.
5.3 Speeds of expansion and realignment timescales
Evidence from surface brightness distributions and morphologies argues for sources whose radio-jets have undergone a sudden reorientation in a small fraction of its lifetime (Models C & D). In so far as no fresh relativistic electrons have been put into the wings (e.g. by particle reacceleration), the maximum ages obtained in Section 3.2.2 are firm upper limits. Using these upper limits, we derive a lower limit on the average (hotspot advance + expansion) speed of 0.022 and 0.035 for 3C 223.1 and 3C 403 respectively.
Presumably the time taken to develop the present active lobes is similar to the time taken to develop the wings when they were the active lobes, so a generous upper limit for the time taken by each is 20 Myr. The distinctness of the wings and the present active lobes indicates that realignment took place over a time less than 1/4 of that time, i.e. 5 Myr.
Alternatively, it is possible the the jets are switched off during realignment; realignment could then have taken longer. Age estimates of powerful radio galaxies using different techniques over a wide range of radio powers [Alexander et al. 1984, Scheuer 1995, Parma et al. 1999] agree that expansion speeds for low luminosity FRIIs are in the range from 0.002 to 0.04c. Using expansion speeds of 0.04c the estimated off-times are a few Myr. Whilst a more typical (smaller) expansion speed would decrease this off-time, we cannot rule out the possibility that the sources expand unusually fast. Therefore we cannot set stringent limits to the realignment time on observational grounds. However, in the next section we shall see that disc physics indicates a realignment time much shorter than 5 Myr, if the black hole and disc parameters are in the commonly assumed ranges.
5.4 Summary
We have argued that the wings seen in 3C 223.1 and 3C 403 cannot be produced by deflected backflow, and that, due to the observed brightness of these features, buoyant expansion cannot play a large role in their formation. A conical precession model is excluded on morphological grounds. The lack of pronounced spectral gradients out to 32 GHz, even in the wings implies ages no more than a couple of tens of Myr, and average advance speeds of 2%. The jet axis underwent a major reorientation in both sources, which occurred on timescales of no more than a few Myr.
6 Mechanisms for rapid jet reorientation
If the jet is aligned with the spin axis of the black hole or the inner accretion disc, its axis could change as a result of: a merger with another black hole; interaction between the black hole and a disc with a different spin axis or instability in the disc. Observational evidence for any merger event which could provide either the needed accreting material, or the second black hole, is briefly examined in the following section, before comparing with theoretical models for realignment timescales and brief consideration of possible causes.
6.1 Evidence against mergers
All available evidence suggests that both sources are located in sparse environments. Rotation measures are small and plausibly associated with our Galaxy (Section 3.3); there is little hot gas and the redshifts of galaxies near 3C 223.1 do not indicate the presence of a cluster [Burns et al. 1981]. The most obvious source of the trigger for the rapid realignment or multiple outburst is a galaxy–galaxy interaction. In such poor environments the chance of interaction with neighbouring galaxies is substantially decreased.
A search for evidence of recent galaxy–galaxy interactions in both galaxy hosts, using multicolour optical continuum and emission-line images from the literature, revealed no particularly impressive signs of disturbance, companions or multiple nuclei [Baum et al. 1988, Smith & Heckman 1989, Smith & Heckman 1990, McCarthy et al. 1991, de Koff et al. 1996, Martel et al. 1999]. Furthermore, long–slit spectroscopy reveals 3C 403 to be relatively undisturbed compared with other radio–loud galaxies[Baum et al. 1990].
A large merger event is expected to be still visible, possibly photometrically, but certainly dynamically (e.g. Balcells & Quinn 1990). The rotation timescale of the host galaxy is of the order 107yrs (Barnes & Hernquist, 1996), whilst a typical merger is only complete after a few times yrs: considerably longer than the maximum particle ages. 3C 403 has unusually high ionisation lines [Tadhunter et al. 1993], as well as being an IRAS source, but the significance of these facts is unclear. The available evidence indicates that an interaction with a large galaxy was not the immediate cause of any realignment of the jet axes of these sources, unlike 3C 293.
6.2 Black hole realignment with accretion disc
It will be convenient in what follows to refer to the axis of the accretion disc as ‘vertical’.
A rotating black hole tries to realign material in a misaligned accretion disc via the differential precession due to Lense-Thirring drag; viscous forces damp the differential precession, so that a steady state is reached in which the disc axis is aligned with the black hole axis out to the warp radius (Bardeen & Petterson 1975). Intuitively one expects that the angular momemtum change in the accreting material near produces an equal and opposite reaction in the angular momentum of the black hole, but the physics is surprisingly different. Here it is important to distinguish between the azimuthal viscous forces in the disc (kinematic viscosity ) and viscous forces in the vertical direction (kinematic viscosity ). Calculations showed that both (Papaloizou & Pringle 1983) and the time for realigning the black hole (Scheuer & Feiler 1996) depend only on . The reason is that the inward advection of angular momentum (via ) is rather accurately cancelled by the outward viscous transport of angular momentum due to , and the warp is determined entirely by balancing the Lense-Thirring drag against the vertical viscous forces in each annulus. The realignment time is similar to the much earlier estimate by Rees (1978) if , but the different physics has striking results if : the realignment time is then much shorter () though is much smaller ().
There are indeed good reasons to believe that in Keplerian discs (Papaloizou & Pringle 1983, Kumar & Pringle 1985). The radial pressure gradients due to the warp set up radial flows whose natural period resonates with the period of the applied force (the orbital period) and therefore reaches large amplitude. The consequent vertical loading is equivalent to a vertical viscous force characterised by where is the Shakura-Sunyaev viscosity parameter. Combining the above with a disc model, Natarajan & Pringle [Natarajan & Pringle 1998] obtain formulae equivalent to
| (1) | |||
| (2) |
where is the black hole’s angular momentum as a fraction of the maximum, is the efficiency of converting accreted mass into energy, is the power output, is the Eddington luminosity and is the black hole mass in units of solar masses.
From the minimum energy in the wings in the form of relativistic electrons and magnetic field and our maximum age estimate of 30 Myr we find that in 3C 223.1 and in 3C 403 the energy output of the AGN is at least 0.5% of for a black hole. Therefore this model predicts that realignment can occur in less than 0.5 Myr for . The minimum energy density in the wings is so low that they may well be pressure confined; in that case the energy estimate should be multiplied by roughly 4/3 to take account of the work done in making room for the wings, and the realignment time reduced accordingly. These estimates of realignment times are well within the upper bound of 5 Myr obtained in Section 5.3.
All of the above refers essentially to thin radiative accretion discs. It may be argued that it is therefore irrelevant to these weak radio galaxies, because they contain ADAFs (in which the incoming matter falls into the BH without radiating, carrying its heat content with it) or ADIOs (in which most of the incoming matter flows out again at higher latitudes) (Blandford & Begelman 1999 and references therein). Numerical simulations by Stone et al. (1999), and in papers by Igumenshchev and collaborators cited there, are qualitatively more like ADIOs in that most of the matter flowing inward through the disc flows off the computing grid at high latitudes, though the power law dependences of density, pressure, etc. with radius are different. For our present purposes, the essential features that all these models have in common is that they have very thick non-radiative discs. None of them give clear guidance on the fraction of infalling matter accreted, as everything scales in power laws in radius (which result from the simulations, and are imposed, through self-similarity, in the analytic models). Furthermore, they show little promise of going over to radiative discs at small radii, since (even in the more favourable models) the increase in density at small radii is insufficient to make up for the shorter accretion time scale and thus lead to effective Coulomb transfer of heat to electrons. Nevertheless, observation forces us to conclude that these radio galaxies have radiative discs, at least at small radii. The AGN emit X-rays and, although broad-line emission is not detected, the narrow-line emission is strong, requiring a hidden source of ionising photons. Therefore we still adopt the above estimates of realignment times, taking to refer to the efficiency in terms of the mass input to the radiative part of the disc.
6.3 Switching jet direction without black hole realignment
It is possible that the jet axis is not determined by the alignment of the black hole itself, as we have assumed until this point. If the paths taken by components in well-studied superluminal quasars such as 3C 345 [Zensus et al. 1995] represent the jet axis rather than some trajectory within a wider jet, then the axis changes direction on a timescale of a few years, much shorter than any reasonable time scale for black hole realignment, and we must conclude that the jet direction is strongly influenced by the disc. If the jet axis was at different times controlled by different parts of the disc, or the inner disc or the jet axis itself suffered instablities a switching of the jet direction could take place over a short time scale.
Such a situation could arise for example if and the black hole mass is well above (so that is correspondingly greater): in this case the black hole realignment time is several times years. Since quite extreme values of the parameters are needed to prevent realignment of the black hole on the timescales of concern here, we regard this possibility as unlikely.
6.4 The origin of the realignment
If the change in angular momentum of the accretion disc is the ‘prime mover’, either infalling matter of a different angular momentum, or a disc instability could be the cause. An ingested dwarf galaxy may not have left the observable traces that a larger merger would, and could have provided sufficient mass and angular momentum to produce the change in jet axis. It is also possible that the gas from an earlier merger has now finally reached the very central regions. A further possibility is an instability of the accretion disc (e.g radiative warping instability [Pringle 1996]), but we then have to explain why the instability seems to be suppressed in other radio galaxies which have stable jet directions and why it occured only once, briefly, in the winged sources.
A second possibility is that the black hole itself is the ‘prime mover’. A coalescence of a binary black hole system would nicely explain the single major reorientation of the jet axis. If a galaxy merger occurred 108yr ago the gaseous traces of this would no longer be visible and the central black holes would settle into a binary orbit [Begelman et al. 1980]. Estimates of the timescale for the coalescence of two black holes seem uncertain, and range from yrs [Ebisuzaki et al. 1991] to longer than the Hubble time [Valtaoja et al. 1989]. The timescale which we have called the ‘reorientation timescale’ is likely to be only the time between the gravitational potential of the secondary black hole significantly disturbing that of the first, and coalescence.
The detection of ‘wings’ only in low power FRII sources may simply be a selection effect. Synchrotron losses are likely to be much more rapid because the magnetic fields are likely to be stronger (both because of their higher radio power and higher redshift). Furthermore, adiabatic losses would be severe for wings expanding supersonically into the IGM, while the low-power wings we observe are likely to be pressure-confined and would not expand significantly. We would then expect that wings would be detected in more powerful sources at very low frequencies. It is much more difficult to devise selection effects to explain why structures analogous to wings are not seen in the less powerful FRI sources.
7 Conclusions
We have presented high quality images at 1.4 and 8.4 GHz of two radio galaxies with a peculiar ‘winged’ morphology in the radio plasma, 3C 223.1 and 3C 403. We have also presented data at 32 GHz for both sources, and at 15 GHz for 3C 223.1.
Analysis of the spectrum in different regions of the sources shows remarkably little variation across the sources, and little evidence for spectral curvature, even at the highest frequencies. We fit a theoretical spectrum to the data which corresponds to the largest possible high frequency energy loss, and thereby obtain minimum characteristic break frequencies. Using these values and considering the unavoidable Compton scattering off the microwave background, we calculate firm upper limits on the particle ages of 34 Myr and 17 Myr.
From the analysis of the radio polarization properties, we conclude that the sources do not reside in rich clusters. They probably reside in similar environments to ‘classical’ FRIIs of similar radio power. The host galaxies are relatively undisturbed ellipticals.
From the details of the radio morphology we favour an explanation in terms of a rapid realignment of the radio jet. Natarajan & Pringle (1998) have shown that the timescale for realignment of a viscous accretion disc near a supermassive black hole could be sufficiently short to explain these observations (less than a Myr for canonical AGN parameters). The undisturbed properties of the host galaxies would appear to rule out a merger with a large galaxy in the last year: considerably longer than the yr since the jet realignment. We consider a binary black hole merger or aquisition of a smaller galaxy as likely candidates for the cause of the change of the jet axis.
There remain a number of unresolved questions, in particular:
(i) Do only sources in this small power range show ‘winged’ structure? All presently known examples are at similar radio power and redshift. However this might be an observational selection effect, as higher power/redshift sources might be expected to suffer greater synchrotron and adiabatic losses and therefore more rapidly ‘lose’ their wings. In relation to this we wonder if the relatively flat spectra of these two sources are integral or coincidental to their morphology.
(ii) Why don’t FRIs show evidence of such sudden realignments? This cannot be attributed to a selection effect, but it may be that the observed S- and Z-shaped structures occur instead when the jet axis changes direction. If not, this must reflect either a difference in their central regions, or a difference in propensity for the hosts to capture, or contain, the required material with different angular momentum.
(iii) Are the winged sources related to the double-double sources, and, if so, how? Is the cause of the realignment in the winged sources related to the cause of the intermittent activity in the double–doubles?
ACKNOWLEDGMENTS
PAGS thanks Dr J.E Pringle for explaining to him the physical processes leading to .The National Radio Astronomy Observatory is a facility of the National Science Foundation operated under cooperative agreement by Associated Universities, Inc. This research was supported in part (JDT) by European Commission, TMR Programme, Research Network Contract ERBFMRXCT96-0034 ‘CERES’
The remaining authors report with regret the death of their colleague Peter Scheuer on 21 Jan 2001. His deep insights into many astrophysical problems have been an inspiration to us all.
References
- [Akujor et al. 1996] Akujor C. E., Leahy J. P., Garrington S. T., Sanghera H., Spencer R. E., Schilizzi R. T., 1996, MNRAS, 278, 1
- [Alexander et al. 1984] Alexander P., Brown M., Scott P., 1984, MNRAS, 209, 851
- [Bardeen & Petterson 1975] Bardeen J. M., Petterson J. A., 1975, ApJL, 195, 65
- [Baum et al. 1988] Baum S., Heckman T., Bridle A., van Breugel W., Miley G., 1988, ApJS, 68, 833
- [Baum et al. 1990] Baum S., Heckman T., van Breugel W., 1990, ApJS, 74, 389
- [Begelman et al. 1980] Begelman M. C., Blandford R. D., Rees M. J., 1980, Nature, 287, 307
- [Bennett 1962] Bennett A. S., 1962, Mem. R. astr. Soc., 68, 163
- [Black 1992] Black A., 1992, Ph.D. thesis, University of Cambridge
- [Black et al. 1992] Black A., Baum S., Leahy J., Perley R., Riley J., Scheuer P., 1992, MNRAS, 256, 186
- [Blandford & Begelman 1999] Blandford R. D., Begelman M. C., 1999, MNRAS, 303, 1
- [Bologna et al. 1969] Bologna J., McClain E., Sloanaker R., 1969, ApJ, 156, 815
- [Bridle et al. 1981] Bridle A. H., Fomalont E. B., Cornwell T. J., 1981, AJ, 86, 1294
- [Burch 1979] Burch S., 1979, MNRAS, 186, 519
- [Burns et al. 1981] Burns J., Gregory S., Holman G., 1981, ApJ, 250, 450
- [de Koff et al. 1996] de Koff S., Baum S., Sparks W., et al, 1996, ApJS, 107, 621
- [Dennett-Thorpe 1996] Dennett-Thorpe J., 1996, Ph.D. thesis, University of Cambridge
- [Dennett-Thorpe et al. 1999] Dennett-Thorpe J., Bridle A. H., Laing R. A., Scheuer P. A. G., 1999, MNRAS, 304, 271
- [Dreher et al. 1987] Dreher J., Carilli C., Perley R., 1987, ApJ, 316, 611
- [Ebisuzaki et al. 1991] Ebisuzaki T., Makino J., Okumura S. K., 1991, Nature, 354, 212
- [Ekers et al. 1978] Ekers R. D., Fanti R., Lari C., Parma P., 1978, Nature, 276, 588
- [Emerson & Graeve 1988] Emerson D. T., Graeve R., 1988, A&A, 190, 353
- [Evans et al. 1999] Evans A. S., Sanders D. B., Surace J. A., Mazzarella J. M., 1999, ApJ, 511, 730
- [Fabbiano et al. 1984] Fabbiano G., Trinchieri G., Elvis M., Miller L., Longair M., 1984, ApJ, 277, 115
- [Gregorini et al. 1992] Gregorini L., Klein U., Parma P., Schlickeiser R., Wielebinski R., 1992, A&AS, 94, 13
- [Gull & Northover 1973] Gull S., Northover K., 1973, Nature, 244, 80
- [Kellermann et al. 1969] Kellermann K., Pauliny-Toth I., Williams P., 1969, ApJ, 157, 1
- [Klein et al. 1995] Klein U., Mack K. H., Gregorini L., Parma P., 1995, A&A, 303, 427
- [Kumar & Pringle 1985] Kumar S., Pringle J. E., 1985, MNRAS, 213, 435
- [Laing 1980] Laing R., 1980, MNRAS, 193, 439
- [Laing & Peacock 1980] Laing R., Peacock J., 1980, MNRAS, 190, 903
- [Lara et al. 1999] Lara L., Márquez I., Cotton W. D., et al, 1999, A&A, 348, 699
- [Leahy 1987] Leahy J., 1987, MNRAS, 226, 433
- [Leahy & Parma 1992] Leahy J., Parma P., 1992, in J. Roland, H. Sol, G. Pelletier eds., Extragalactic Radio sources: from beams to jets. C.U.P., Cambridge p307
- [Leahy & Williams 1984] Leahy J., Williams A., 1984, MNRAS, 210, 929
- [Mack et al. 1994] Mack K. H., Gregorini L., Parma P., Klein U., 1994, A&AS, 103, 157
- [Martel et al. 1999] Martel A. R., Baum S. A., Sparks W. B., Wyckoff E., Biretta J. A., Golombek D., Macchetto F. D., de Koff S., McCarthy P. J., Miley G. K., 1999, ApJS, 122, 81
- [McCarthy et al. 1991] McCarthy P., van Breugel W., Kapahi V., 1991, ApJ, 371, 478
- [Miller 1985] Miller L., 1985, MNRAS, 215, 773
- [Morsi & Reich 1986] Morsi H. W., Reich W., 1986, A&A, 163, 313
- [Natarajan & Pringle 1998] Natarajan P., Pringle J. E., 1998, ApJL, 506, 97
- [Papaloizou & Pringle 1983] Papaloizou J. C. B., Pringle J. E., 1983, MNRAS, 202, 1181
- [Parma et al. 1985] Parma P., Ekers R. D., Fanti R., 1985, A&AS, 59, 511
- [Parma et al. 1999] Parma P., Murgia M., Morganti R., et al, 1999, A&A, 344, 7
- [Perley & Carilli 1996] Perley R., Carilli C., 1996, in Carilli C., Harris D., eds, Cygnus A - a study of a radio galaxy. C.U.P.
- [Pringle 1996] Pringle J. E., 1996, MNRAS, 281, 357
- [Roger et al. 1973] Roger R., Bridle A., Costain C., 1973, AJ, 78, 1030
- [Sandage 1966] Sandage A., 1966, ApJ, 145, 1
- [Sandage 1972] Sandage A., 1972, ApJ, 178, 25
- [Scheuer 1995] Scheuer P., 1995, MNRAS, 277, 331
- [Schoenmakers et al. 1999a] Schoenmakers A. P., de Bruyn A. G., Röttgering H. J. A., van Der Laan H., 1999, A&A, 341, 44
- [Schoenmakers et al. 1999b] Schoenmakers A. P., de Bruyn A. G., Röttgering H. J. A., van Der Laan H., Kaiser C. R., 2000, MNRAS, 315, 381
- [Seielstad & Weiler 1969] Seielstad G., Weiler K., 1969, ApJS, 18, 85
- [Simard-Normandin & Kronberg 1980] Simard-Normandin M., Kronberg P., 1980, ApJ, 242, 94
- [Simard-Normandin et al. 1981] Simard-Normandin M., Kronberg P., Button S., 1981, ApJS, 45, 97
- [Simonetti et al. 1984] Simonetti J., Cordes J., Spangler S., 1984, ApJ, 284, 126
- [Smith & Heckman 1989] Smith E. P., Heckman T. M., 1989, ApJ, 341, 658
- [Smith & Heckman 1990] Smith E. P., Heckman T. M., 1990, ApJ, 348, 38
- [Spinrad et al. 1985] Spinrad H., Djorgovski S., Marr J., Aguilar L., 1985, PASP, 97, 932
- [Stone et al. 1999] Stone J. M., Pringle J. E., Begelman M. C., 1999, MNRAS, 310, 1002
- [Tabara & Inoue 1980] Tabara H., Inoue M., 1980, A&AS, 39, 379
- [Tadhunter et al. 1993] Tadhunter C. N., Morganti R., Di Serego Alighieri S., Fosbury R. A. E., Danziger I. J., 1993, MNRAS, 263, 999
- [Ulrich & Rönnback 1996] Ulrich M.-H., Rönnback J., 1996, A&A, 313, 750
- [Vallée et al. 1988] Vallée J., Simard-Normandin M., Bignell R., 1988, ApJ, 331, 321
- [Valtaoja et al. 1989] Valtaoja L., Valtonen M. J., Byrd G. G., 1989, ApJ, 343, 47
- [van Breugel et al. 1984] van Breugel W., Heckman T., Butcher H., Miley G., 1984, ApJ, 277, 82
- [Worrall et al. 1995] Worrall D. M., Birkinshaw M., Cameron R. A., 1995, ApJ, 449, 93
- [Zensus et al. 1995] Zensus J. A., Cohen M. H., Unwin S. C., 1995, ApJ, 443, 35