Effective Temperatures of late L dwarfs and the onset of Methane signatures
Abstract
We present a spectral analysis of a sample of late L dwarfs. We use our latest model atmospheres and synthetic spectra and optical and K band spectra to determine effective temperatures. We derive effective temperatures of 1400 K to 1700 K for L8 to L6 dwarfs. The analysis demonstrates that our recent models that rain out the formed dust completely are applicable to optical spectra of late L dwarfs and that more consistent models are needed for intermediate L dwarfs and for infrared spectra. We compare the results for the effective temperatures with the temperatures of the onset of Methane formation. Our models predict Methane absorption at 3.3µm to occur at about 400 K higher temperatures than Methane absorption at 2.2µm. This is consistent with our data and previous observations which show Methane absorption at 3.3µm but not at 2.2µm in late L dwarfs.
1 Introduction
L dwarfs (Martín et al., 1997, 1998, 1999; Zapatero Osorio et al., 1999; Kirkpatrick et al., 1999, 2000) are dwarfs cooler than M dwarfs and hotter than the so called Methane or T dwarfs. They are defined by showing decreasing or no TiO and VO absorption in the optical and by not yet showing CH4 in the near infrared. There are two classification schemes for L dwarfs, the one by Martín et al. (1999) and the one by Kirkpatrick et al. (1999) which differ especially for late L dwarfs — which are the topic of this work. For the purpose of this paper we adopt the scheme by Kirkpatrick et al. (1999). The transition from M dwarfs to L dwarfs is observationally very smooth and theoretically well explained by gradually decreasing the effective temperature. The transition from L dwarfs to T dwarfs, however, is not as smooth. The original definition of L dwarfs deliberately left room between L dwarfs and cooler objects (Kirkpatrick et al., 1999). First estimates on the effective temperatures of late L dwarfs and on the first known Methane dwarf Gl229B did not clarify if there is a jump in effective temperature and if there is a missing population of objects between L dwarfs and Methane dwarfs. Recent analyses of L dwarfs and to some extend T dwarfs can be found in e.g. Allard et al. (1996); Marley et al. (1996); Tsuji et al. (1996); Tinney et al. (1998); Burrows et al. (2000); Basri et al. (2000); Pavlenko et al. (2000); Leggett et al. (2001). Those analyses range from optical to infrared analyses and they range from measuring low to high resolution spectra. However, the uncertainty about the effective temperatures and the transition to the T dwarfs remains.
One aspect of this transition is the onset of Methane absorption. L dwarfs do not show Methane absorption in the near infrared, however Gl229B and even Jupiter do. Recently, Noll et al. (2000) reported the detection of Methane at 3.3µm in late L dwarfs which seems to close the gap between L dwarfs and Methane dwarfs. And as discussed in Noll et al. (2000) it even makes the naming convention “Methane dwarf” ambiguous.
Regardless, the effective temperatures associated with late L dwarfs and the onset of Methane absorption is not clear, yet. Noll et al. (2000) estimated relatively high effective temperatures of about 1800 K for late L dwarfs, whereas other studies suggest effective temperatures as low as 1300 K for the latest L dwarfs (Kirkpatrick et al., 2000). Note that the effective temperature of Gl229B is estimated to be 900–1000 K (Allard et al., 1996; Marley et al., 1996), but that it is not the warmest T dwarf since earlier ones (e.g. Leggett et al., 2000; Burgasser et al., 2000, 2001) are known to exist. This work aims to clarify the effective temperatures of late L dwarfs and the onset of Methane absorption.
In the next two sections we describe the data and the models used in this work, respectively. In section 4 we present the analysis which consists of an optical spectral analysis, an infrared spectral analysis and an absolute flux analysis for the objects with known parallaxes. We discuss and conclude this work in section 5.
2 The data
The optical spectra for the stars of this sample are taken from Kirkpatrick et al. (1999) and Kirkpatrick et al. (2000). The K-band spectra used in this work were obtained at the Kitt Peak 4-meter telescope using the CRSP spectrograph. The spectra were reduced using standard techniques. The atmospheric water absorption was removed using nearby A type stars. See also Gizis et al. (2001) for details of the observations. The sample constitutes of all late ( L6) L dwarfs that have both optical and K band spectra. The criterion L6 was physically relatively arbitrary. It was a rather technical criterion. We wanted to comfortably include the spectral range used in Noll et al. (2000) and we wanted to have a spectral range for which we have valid models. See Allard et al. (2001); Schweitzer et al. (2001) and sections 3 and 5 for a discussion of the validity of the applied models. Especially the respective sections of this paper will make this work also a case study for the validity of the AMES-Cond models.
3 The models
The models used in this work are the so called AMES-Cond and AMES-Dusty models described in Allard et al. (2001). A detailed description can be found therein. The key features relevant for this study are the dust treatment and the latest line lists which are summarized in the next few paragraphs.
In the AMES-Cond models the dust is treated in the limiting case where the dust has formed in equilibrium and has rained out completely out of the atmosphere. This effectively removes the fraction of elements from the atmosphere that are bound in dust grains; see Allard et al. (2001) for a discussion. The AMES-Dusty models treat the dust in the other limiting case where the dust stays in the layer in which it forms and does not rain out at all. This effectively introduces a dust opacity due to the full dust content. To calculate the dust content we use the Gibbs free energy of formation from Sharp & Huebner (1990) and calculate the equilibrium concentration of all dust species available.
In earlier analyses, the models have been applied to low resolution optical and infrared spectra of M and L dwarfs (Leggett et al., 2001) and to optical low and high resolution spectra of early L dwarfs (Schweitzer et al., 2001). Earlier models have been applied to high resolution spectra of L dwarfs as well (Basri et al., 2000). The results from these works indicate that the assumption of complete rain out is valid for late L dwarfs. Therefore, we will primarily apply the AMES-Cond models in our analysis of the late L dwarfs. However, to further investigate the condition of complete rain out we also used infrared spectra of AMES-Dusty models in sections 4.2 and 4.4 as comparison.
The important opacity sources included in this work are the TiO(Schwenke, 1998), FeH(Phillips & Davis, 1993), CrH(Freedman, private comm., see also Allard et al., 2001), H2O(Partridge & Schwenke, 1997) and CH4(Husson et al., 1992) line lists. This means that all important opacity sources for (late) L dwarfs are treated with line lists and no longer with JOLA (Just Overlapping Line Approximation) opacities. However, we note that there are still uncertainties in the data for the H2O line list (Allard et al., 2000).
The spectra used for this analysis are calculated at a resolution of 2 Å. They are based on fully converged model structures that include depth depended line profiles and include all the opacities for all iterations (see e.g. Hauschildt et al., 1999; Allard et al., 2001, for details of the calculations).
4 Analysis
4.1 Optical spectra
We used a fitting technique to determine the best fitting model spectra. It is described in Leggett et al. (2001) and has also been used in Schweitzer et al. (2001). As input we used a grid of AMES-Cond model spectra from =1000 K to =1700 K in steps of 100 K and from =4.0 to =6.0 in steps of 0.5 to determine which model results in the smallest value. Since the observed spectra have a resolution of significantly less than R=1000 the standard resolution of 2 Å of our model spectra is sufficient for this analysis. However, the resolution of the observations is not high enough to analyze individual atomic lines. Therefore, the method used in this work measures the goodness of the fit to the overall spectrum and weighting individual lines would not be allowed by the quality of the available data. We employ error bars for the measured values of 100 K in and 0.5 dex in . This reflects primarily the grid spacing. However, the three best fitting models do lie within these error bars. These error bars do not take into account any systematic errors due to uncertainties of the models.
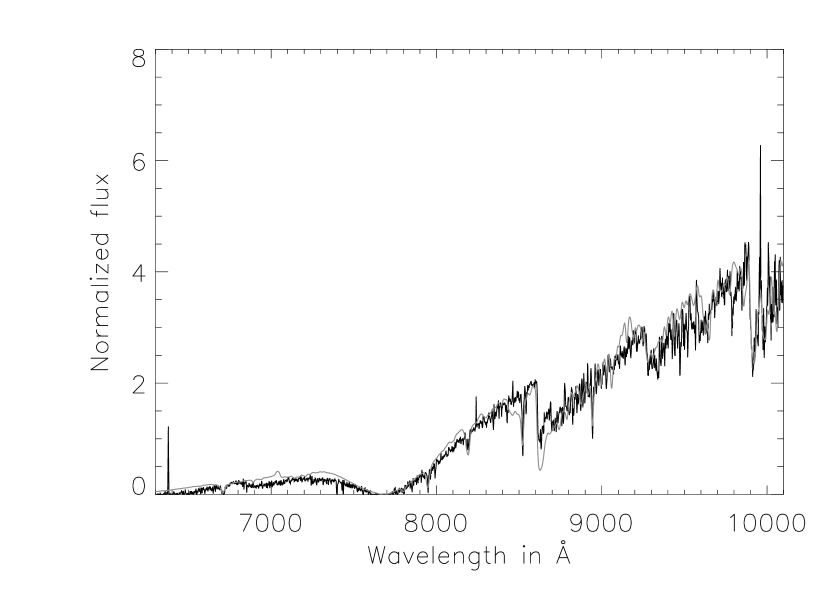
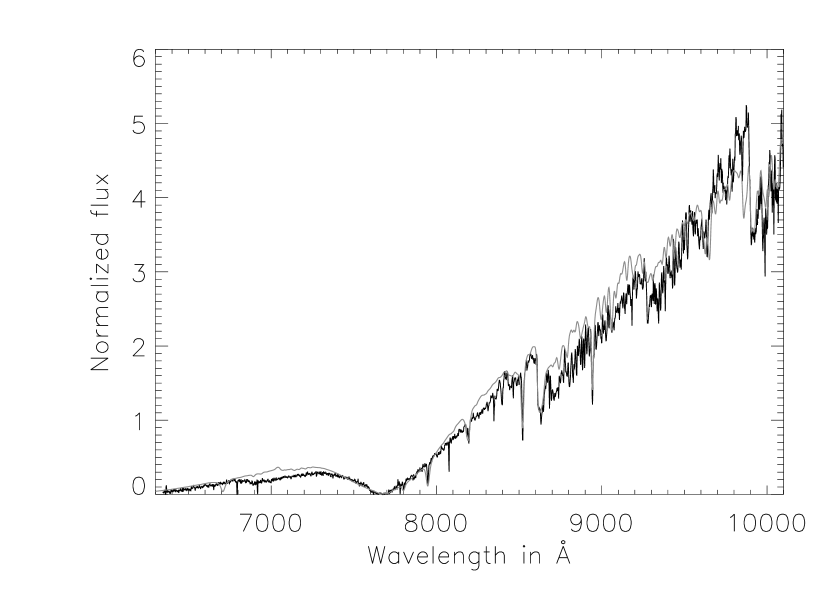
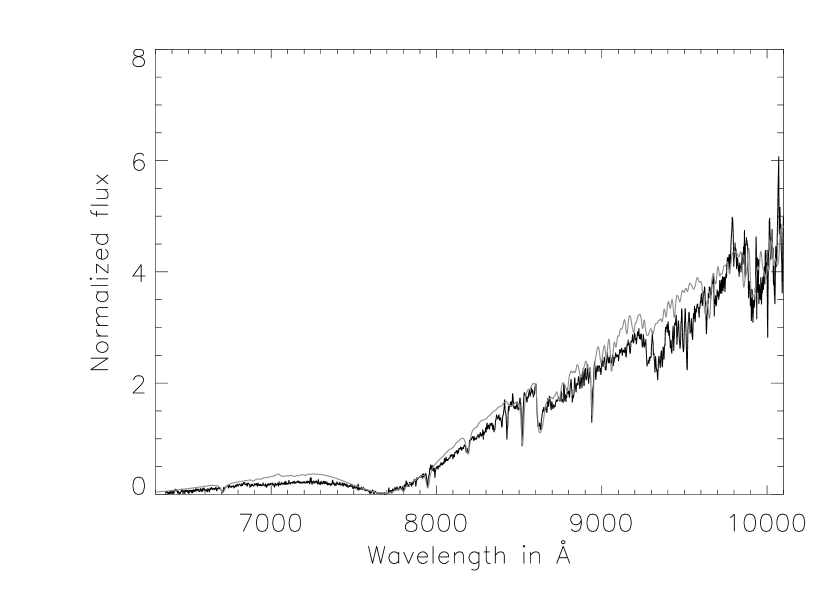
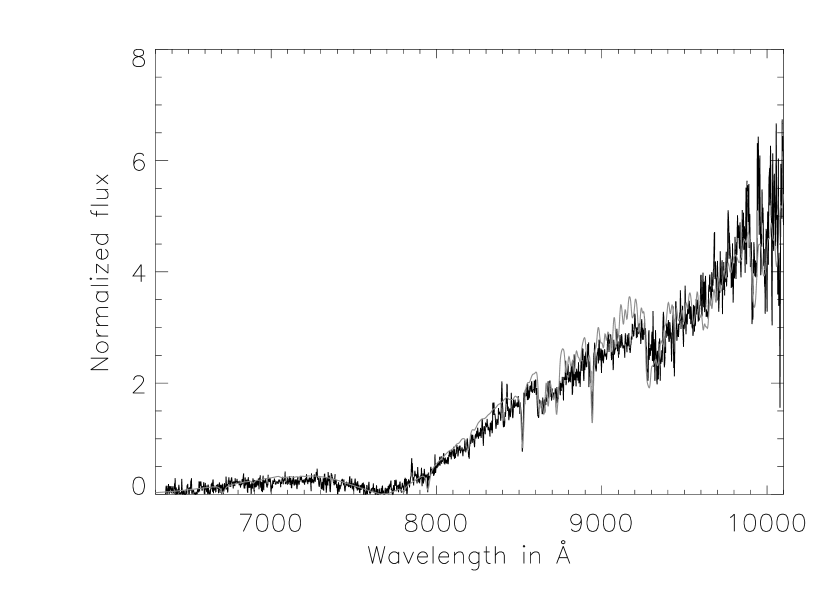
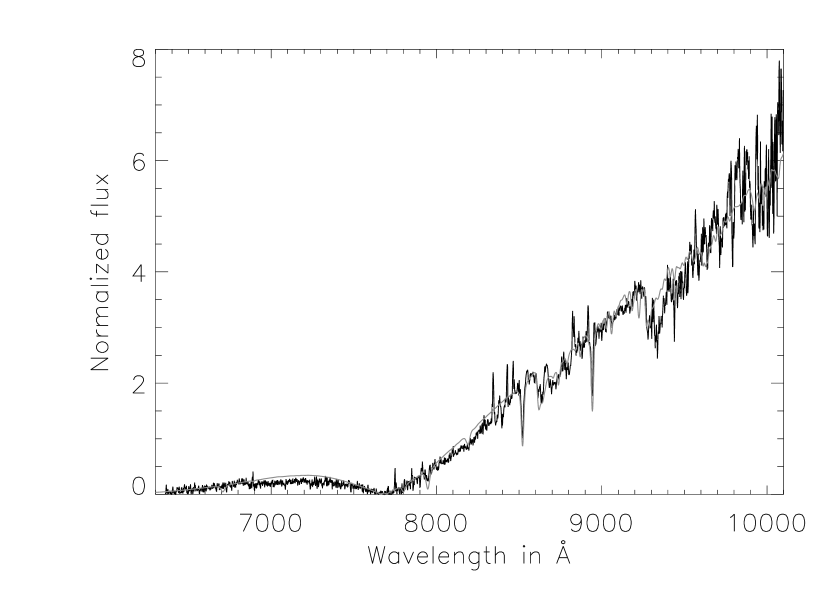
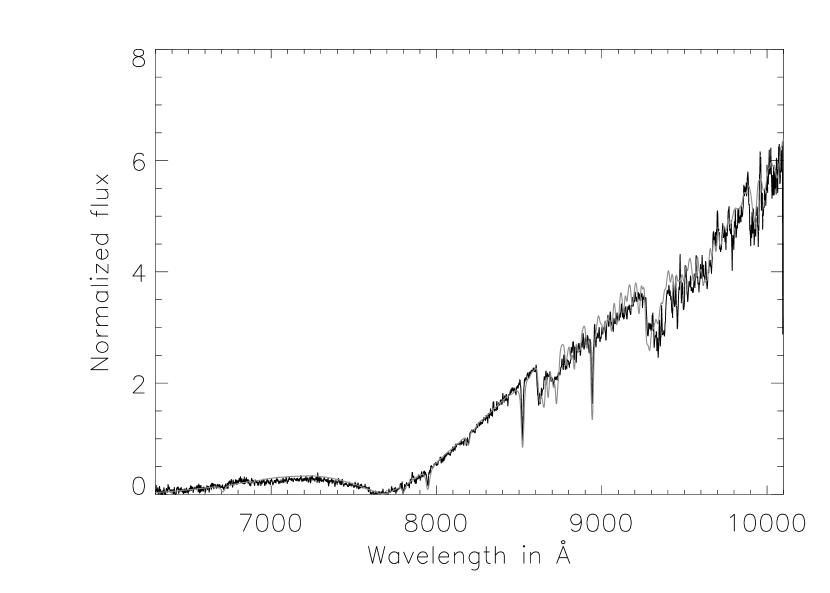
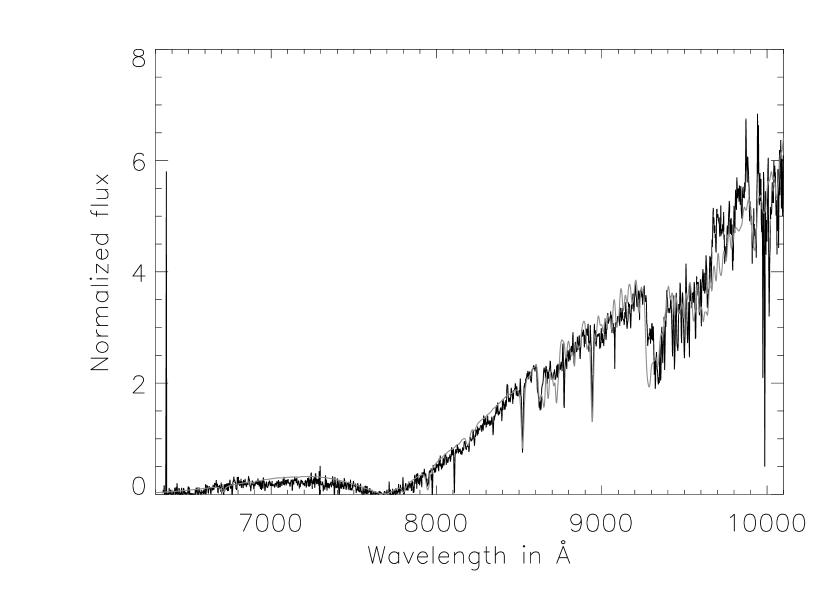
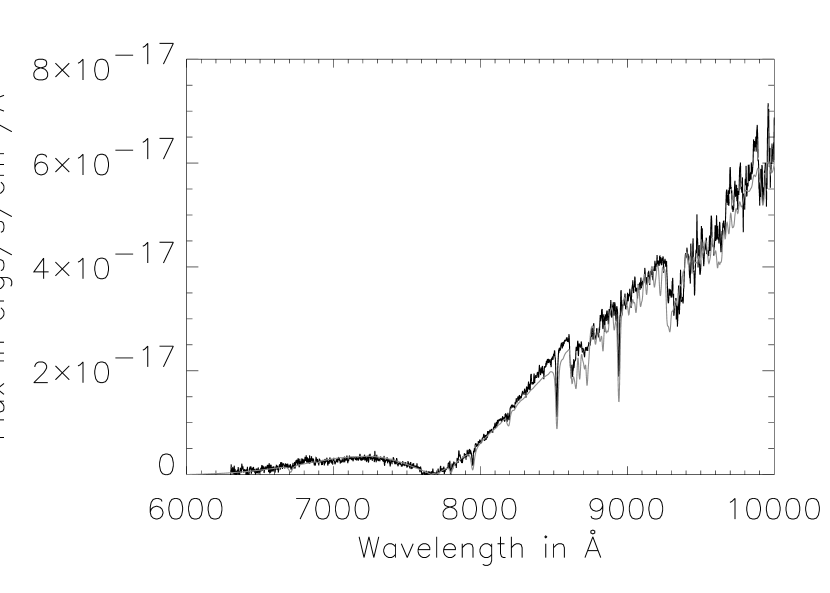
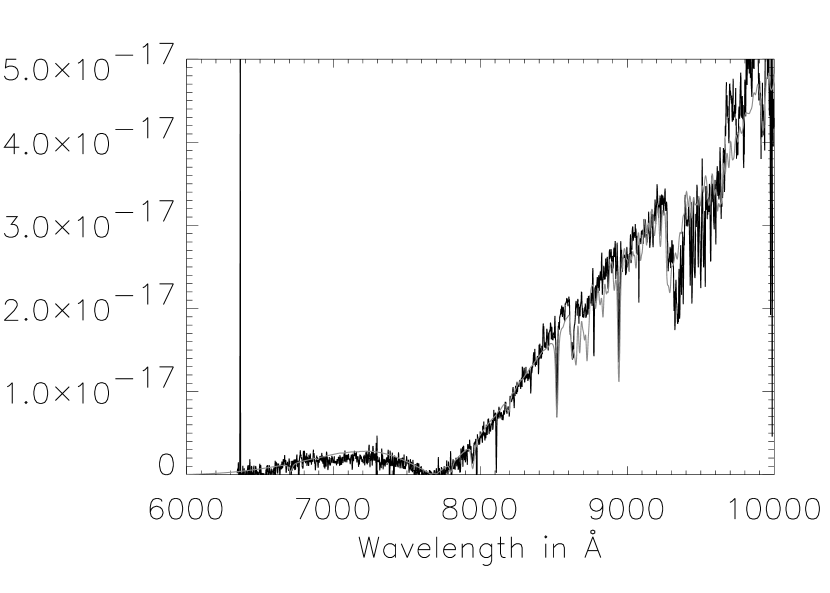
The best fits to the optical spectra are shown in Figs.1 to 7 and the parameters for the best fitting models are summarized in Tab.1. As can be seen the models fit very well to the observations. The FeH and CrH bands at 8600 Å and the H2O bands at 9300 Å are well reproduced as well as the overall shape which is determined by the K I doublet at 7600 Å and the Na D doublet. Also the Rb I and Cs I are reproduced within the limits of the resolution.
The determined effective temperatures correlate with spectral type, as expected. The results might suggest a jump in effective temperature from L7 to L8 by 300K. However, this sample is too small to draw such conclusions, especially within the error bars of the fitting process. The determined gravities are =5.0 or larger which means the objects are well contracted and not young anymore. This is expected for a field sample like this 2MASS sample and very similar to the results for obtained in Schweitzer et al. (2001).
4.2 Infrared spectra
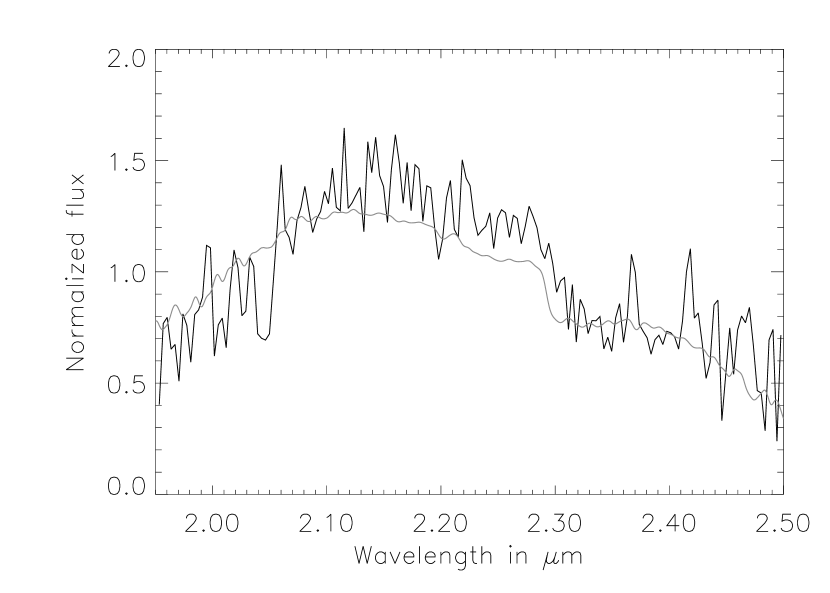
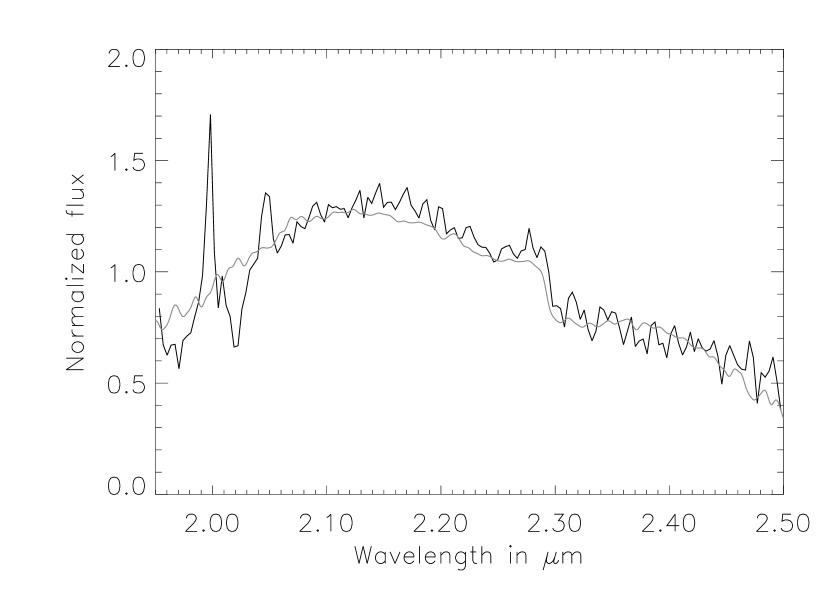
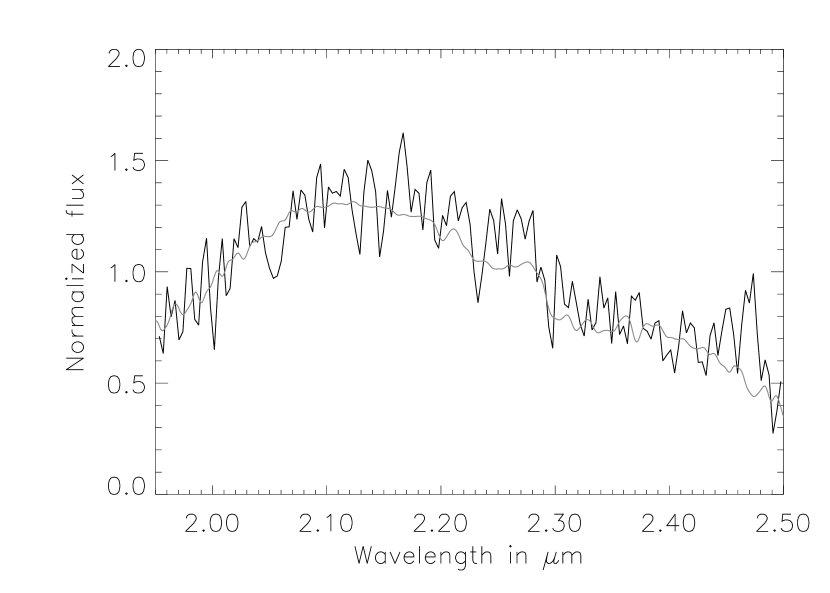
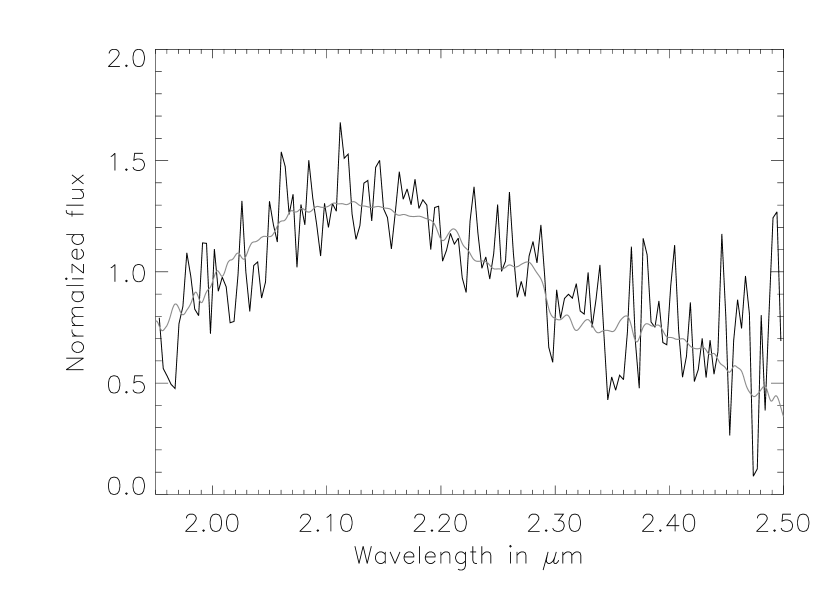
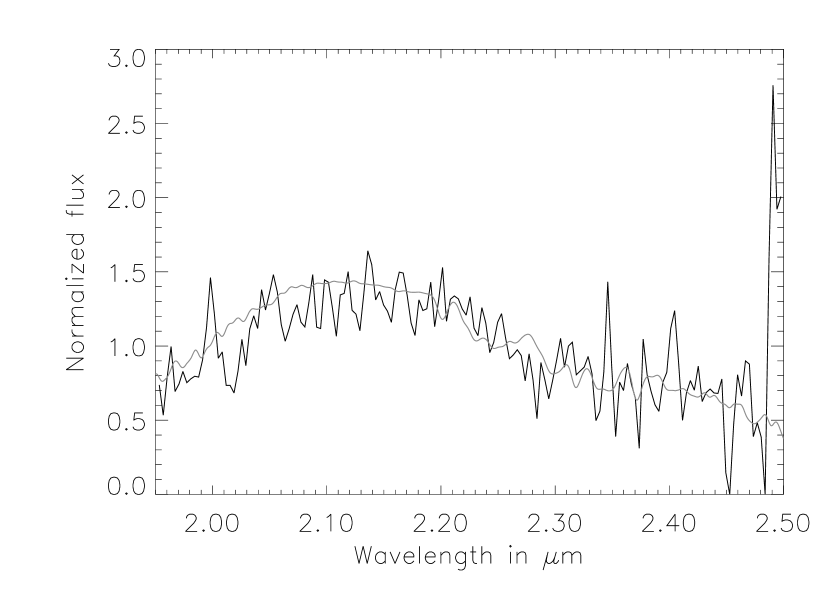
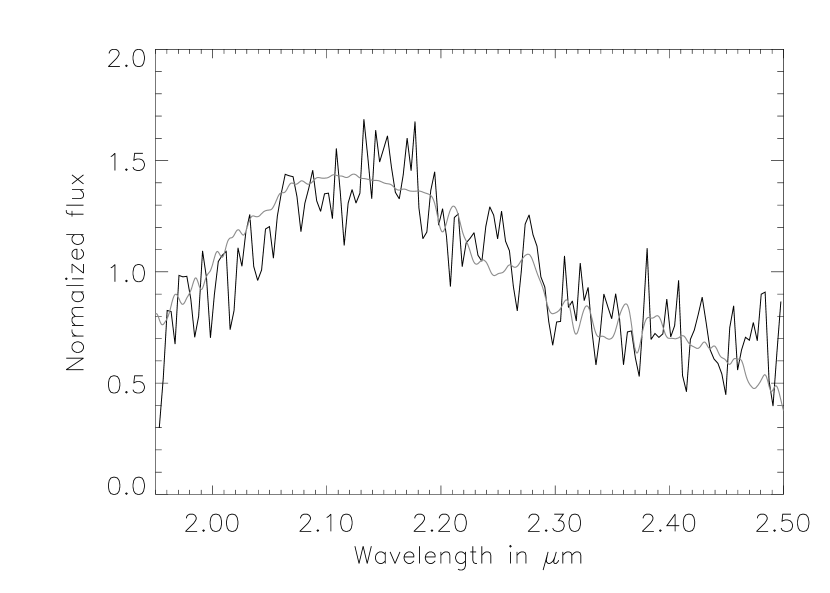
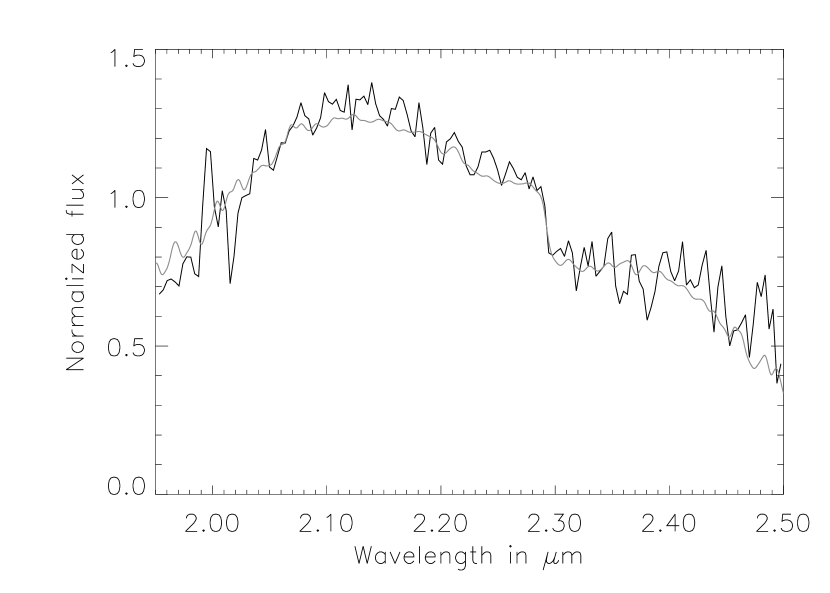
We performed the same type of fitting technique for the infrared spectra as we did for the optical spectra. The model grid for the infrared analysis had to encompass effective temperatures from 1300 K to 1900 K to obtain good fits. The resulting fits are shown in Figs. 8 to 14 and the best fitting parameters are listed in Tab. 1. For the K band spectra the resulting models were significantly hotter than the best fitting models for the optical spectra. However, results from previous (mostly optical) studies showed that AMES-Cond models are appropriate only for effective temperatures below about 1700 K, whereas our fitting process produced significantly hotter effective temperatures. Therefore, we also tried to fit the AMES-Dusty models to the K band spectra, but the resulting temperatures were about the same and the quality of the fits did not improve significantly. As a visual inspection showed, the shape of the K band AMES-Cond spectra is not very temperature sensitive and mostly dominated by CO and H2O absorption for models with 1800 K. Below 1800 K, CH4 starts showing in the synthetic spectra which is further investigated in section 4.4.
4.3 Absolute flux comparisons
To clarify on the different effective temperatures we calculated absolute flux values for both synthetic spectra and synthetic magnitudes and compared them with observed data. The calculation of synthetic absolute flux values hinges on the knowledge of the radius of the object. However, according to Chabrier et al. (2000), the radius of a very low mass object is 0.10.03 R⊙ for an age older than 300Myrs and a mass between 0.01 M⊙ and 0.07 M⊙. These are very conservative limits which are easily fulfilled for a random field sample like the presented 2MASS sample. Therefore, we used a radius of 0.1 R⊙ ( 1 RJupiter) to calculate absolute flux values.
Such a large error in radius will introduce an even larger error in flux. However, the reason for doing this comparison is to compare flux values from the “cool” (1400K) models and from the “warm” (1700K) models. At these low effective temperatures the flux differences from the effective temperatures are much larger than the flux differences from the radius uncertainty. Therefore, we can use the absolute flux values to decide between the results for the effective temperatures from the optical fits and from the infrared fits.
Table 1 lists the observed KS magnitudes and KS magnitudes calculated from the measured trigonometric parallax the synthetic spectra with the best fitting parameters and the 2MASS KS response function. As can be seen, using the parameters from the optical low resolution spectra fitting give excellent agreement with observations. The synthetic magnitudes using the results from the infrared analysis are significantly brighter than the observed magnitudes.
The KS magnitude of 2MASSs J0850359+105716 is within the error bars of both the 1700 K model and the 1900 K model synthetic magnitudes and cannot be used to distinguish between the warm and cold models. For the two L8 dwarfs with parallaxes it would alternatively require an assumed radius of about 0.15 R⊙ to favour the synthetic magnitudes from the infrared fitting over the synthetic magnitudes from the optical fitting. However, according to Chabrier et al. (2000) this would correspond to objects younger than 50 Myrs and less massive than 0.02 M⊙ which have matching effective temperatures. This is extremely unlikely for a field sample like this one and would be in contradiction to recent age estimates for 2MASSW J1523226+301456 (Gl584C) of at least 1Gyr (Kirkpatrick et al., 2001).
Figure 15 shows 2MASSW J1632291+190441 and 2MASSW J1523226+301456 and the respective best fitting models in astrophysical flux. The only scaling applied to the synthetic spectra are the distance and an assumed radius of 0.1 R⊙. As can be seen, the flux agreement is excellent. 2MASSs J0850359+105716 is not shown since the best fitting model (AMES-Cond with =1700K, =5.5) scaled to the distance and 0.1 R⊙ has almost a factor two more flux than the observation. This is within the expected error range due to the radius uncertainty. Also, =1700K is already close to the parameter region between the valid regimes of the AMES-Cond and AMES-Dusty models. In particular, AMES-Cond models (when leaving their applicable parameter range) have too much flux in the optical due to the lack of dust opacity. Again, using spectra with the parameters obtained from the infrared fitting results would be brighter by more than a factor of two (aside from the different spectral shape).
Since the infrared spectra are not absolute flux calibrated and since there are no optical magnitudes available we could not do a corresponding analysis for those quantities.
4.4 Methane behavior
As mentioned above, the AMES-Cond models start showing CH4 at 2.2µm for 1800 K. This is the main reason why the K band fitting only yields effective temperatures above 1800 K. The AMES-Dusty models do not show CH4 at 2.2µm; not even at =1500 K. Below that effective temperature, the AMES-Dusty models are no longer appropriate (see e.g Schweitzer et al., 2001; Allard et al., 2001) and their spectra are unrealistic.
However, late L dwarfs (1500 K according to our optical and flux analysis) do not show CH4 at 2.2µm. Yet, Noll et al. (2000) have recently reported the detection of CH4 at 3.3µm for late L dwarfs.
Therefore, we also investigated the 3.3µm spectral region and found the onset of CH4 to occur at an effective temperature of about 2200 K. This is about 400 K hotter than the onset of the 2.2µm band. The absorption onset at 3.3µm as well the absorption onset at 2.2µm are demonstrated in Fig. 16. As can be seen, the CH4 feature is visible at 2.2µm for 1800K and at 3.3µm for 2200K. The figure shows models with =5.5, however, the result is the same for 4.56.0. Note, that our models are fully self consistent. Unlike the study in Noll et al. (2000) our spectra are a direct output from the model calculations.
The previous sections suggest that there is a systematic offset in the theoretical K band (and most likely other infrared band pass) spectra. They seem to show a typical late L dwarf shape at about 300-400 K too high temperatures. Therefore, the CH4 onset temperature of 2200 K at 3.3µm has to be taken with care. We are much more confident in the differential result than the absolute result. I.e. we are confident that the CH4 absorption at 3.3µm occurs at about 400 K higher effective temperatures than the CH4 absorption at 2.2µm. This is consistent with the 3.3µm band being a fundamental band and the 2.2µm band being an overtone band which only appears when sufficient amounts of CH4 have formed, i.e. at cooler temperatures.
5 Summary and discussion
We have performed a multi-wavelength analysis of late L dwarfs. From optical low resolution fits we determined effective temperatures for L6 to L8 dwarfs between 1700 K and 1400 K. From K band spectral analysis we determined effective temperatures between 1900 K and 1700 K. Comparing absolute flux values (K band magnitudes and absolute flux calibrated optical spectra), we find excellent agreement with the cooler effective temperatures. The mismatch for the K band spectra means that the shape looks too hot, but the flux is correct. Most prominently, the AMES-Cond models predict CH4 absorption at 2.2µm which is not observed.
This can be caused by several factors or a combination of them. For one, the dust is treated only in a limiting case. A more correct treatment which accounts for gravitational settling will change the temperature structure and opacity structure of the atmosphere and hence parts of the spectrum. As already discussed in Allard et al. (2001) and Schweitzer et al. (2001), the treatment of dust has a significant impact on the temperature structure. This together with the improved dust treatment will also change how the elements are distributed over the compounds and this results in different concentrations of CO and CH4 (the most prominent opacities in the K band). Secondly, there are known uncertainties in the H2O line list (Allard et al., 2000). The current water opacity distributes the flux in the J to K bandpasses incorrectly.
This has interesting consequences on the CH4 bands. We found that the onset of the band at 3.3µm appears at about 400 K higher temperatures than the onset of the 2.2µm band. The numbers for the respective effective temperatures have been derived from the AMES-Cond models. Previous studies (Schweitzer et al., 2001; Leggett et al., 2001) have only confirmed their validity for optical spectra of late L dwarfs. It appears from this study that the K band shape and the onset of CH4 seems to be reproduced at too high temperatures. As already discussed above, this sort of effect is consistent with an unrealistic temperature structure which necessarily arises from treating dust only in a limiting case.
The AMES-Dusty models seemed to reproduce realistic spectra in the optical and near infrared when applied to appropriate objects(Leggett et al., 2001; Schweitzer et al., 2001). However, as noted in this study, they do not predict any CH4 absorption. The future models we are currently working on (Allard et al., in preparation) will treat the dust formation and settling in a consistent fashion. These models will then have more realistic temperature structures and reproduce the spectral features more accurately. On the other hand, the excellent fits of the AMES-Cond models in the optical already suggest that the outer atmosphere is dust free.
From the range of previous estimates on the effective temperatures of late L dwarfs we derived relatively low effective temperatures. This leaves little room for objects between classes L and T. Although the optical spectra look significantly different, our study found strong theoretical evidence that CH4 absorption already takes place at late L type supporting the results from Noll et al. (2000). More high signal to noise spectra of L dwarfs in the L band and K band are needed to underpin these recent results.
References
- Allard et al. (2001) Allard, F., Hauschildt, P., Alexander, D., R., Tamanai, A., & Schweitzer, A. 2001, ApJ, 556, 357
- Allard et al. (1996) Allard, F., Hauschildt, P. H., Baraffe, I., & Chabrier, G. 1996, ApJ, 465, L123
- Allard et al. (2000) Allard, F., Hauschildt, P. H., & Schwenke, D. 2000, ApJ, 540, 1005
- Basri et al. (2000) Basri, G., Mohanty, S., Allard, F., Hauschildt, P. H., Delfosse, X., Martín, E. L., Forveille, T., & Goldman, B. 2000, ApJ, 538, 363
- Burgasser et al. (2001) Burgasser, A. J., Kirkpatrick, J. D., Brown, M. E., Reid, I. N., Burrows, A., Liebert, J., Matthews, K., Gizis, J. E., Dahn, C. C., Monet, D. G., Cutri, R. M., , & Skrutskie, M. F. 2001, ApJ, submitted
- Burgasser et al. (2000) Burgasser, A. J., Wilson, J. C., Kirkpatrick, J. D., Skrutskie, M. F., Colonno, M. R., Enos, A. T., Smith, J. D., Henderson, C. P., Gizis, J. E., Brown, M. E., & Houck, J. R. 2000, AJ, 120, 1100
- Burrows et al. (2000) Burrows, A., Marley, M. S., & Sharp, C. M. 2000, ApJ, 531, 438
- Chabrier et al. (2000) Chabrier, G., Baraffe, I., Allard, F., & Hauschildt, P. H. 2000, ApJ, 542, 464
- Gizis et al. (2001) Gizis et al., J. 2001, AJ, submitted
- Hauschildt et al. (1999) Hauschildt, P. H., Allard, F., & Baron, E. 1999, ApJ, 512, 377
- Husson et al. (1992) Husson, N., Bonnet, B., Scott, N. A., & Chedin, A. 1992, Journal of Quantitative Spectroscopy and Radiative Transfer, 48, 509
- Kirkpatrick et al. (2001) Kirkpatrick, J. D., Dahn, C. C., Monet, D. G., Reid, I. N., Gizis, J. E., Liebert, J., & Burgasser, A. J. 2001, AJ, 121, 3235
- Kirkpatrick et al. (1999) Kirkpatrick, J. D., Reid, I. N., Liebert, J., Cutri, R. M., Nelson, B., Beichman, C. A., Dahn, C. C., Monet, D. G., Gizis, J. E., & Skrutskie, M. F. 1999, ApJ, 519, 802
- Kirkpatrick et al. (2000) Kirkpatrick, J. D., Reid, I. N., Liebert, J., Gizis, J. E., Burgasser, A. J., Monet, D. G., Dahn, C. C., Nelson, B., & Williams, R. J. 2000, AJ, 120, 447
- Leggett et al. (2001) Leggett, S., Allard, F., Geballe, T., Hauschildt, P., & Schweitzer, A. 2001, ApJ, 548, 908
- Leggett et al. (2000) Leggett, S. K., Geballe, T. R., Fan, X., Schneider, D. P., Gunn, J. E., Lupton, R. H., Knapp, G. R., Strauss, M. A., McDaniel, A., Golimowski, D. A., Henry, T. J., Peng, E., Tsvetanov, Z. I., Uomoto, A., Zheng, W., Hill, G. J., Ramsey, L. W., Anderson, S. F., Annis, J. A., Bahcall, N. A., Brinkmann, J., Chen, B., Csabai, I. ., Fukugita, M., Hennessy, G. S., Hindsley, R. B., Ivezić, Ž., Lamb, D. Q., Munn, J. A., Pier, J. R., Schlegel, D. J., Smith, J. A., Stoughton, C., Thakar, A. R., & York, D. G. 2000, ApJ, 536, L35
- Marley et al. (1996) Marley, M. S., Saumon, D., Guillot, T., Freedman, R. S., Hubbard, W. B., Burrows, A., & Lunine, J. I. 1996, Science, 272, 1919
- Martín et al. (1997) Martín, E. L., Basri, G., Delfosse, X., & Forveille, T. 1997, A&A, 327, L29
- Martín et al. (1998) Martín, E. L., Basri, G., Zapatero-Osorio, M. R., Rebolo, R., & López, R. J. G. . 1998, ApJ, 507, L41
- Martín et al. (1999) Martín, E. L., Delfosse, X., Basri, G., Goldman, B., Forveille, T., & Zapatero Osorio, M. R. 1999, AJ, 118, 2466
- Noll et al. (2000) Noll, K. S., Geballe, T. R., Leggett, S. K., & Marley, M. S. 2000, ApJ, 541, L75
- Partridge & Schwenke (1997) Partridge, H. & Schwenke, D. W. 1997, J. Chem. Phys., 106, 4618
- Pavlenko et al. (2000) Pavlenko, Y., Zapatero Osorio, M. R., & Rebolo, R. 2000, A&A, 355, 245
- Phillips & Davis (1993) Phillips, J. G. & Davis, S. P. 1993, ApJ, 409, 860
- Schweitzer et al. (2001) Schweitzer, A., Gizis, J., Hauschildt, P., Allard, F., & Reid, N. 2001, ApJ, 555, 368
- Schwenke (1998) Schwenke, D. W. 1998, Faraday Discussions, 109, 321
- Sharp & Huebner (1990) Sharp, C. M. & Huebner, W. F. 1990, ApJS, 72, 417
- Tinney et al. (1998) Tinney, C. G., Delfosse, X., Forveille, T., & Allard, F. 1998, A&A, 338, 1066
- Tsuji et al. (1996) Tsuji, T., Ohnaka, K., Aoki, W., & Nakajima, T. 1996, A&A, 308, L29
- Zapatero Osorio et al. (1999) Zapatero Osorio, M. R., Béjar, V. J. S., Rebolo, R., Martín, E. L., & Basri, G. 1999, ApJ, 524, L115
| Optical fitting | KS band fitting | ||||||||
|---|---|---|---|---|---|---|---|---|---|
| Name | Spectral Type | KS | aafrom Kirkpatrick et al. 2000 | KS,Syn | KS,Syn | ||||
| 2MASSs J0850359+105716 | L6 | 14.460.07 | 30.6 | 1700 | 5.5 | 14.49 | 1900 | 6.0 | 14.09 |
| 2MASSW J0920122+351742 | L6.5 | 13.930.08 | 1700 | 6.0 | 1900 | 6.0 | |||
| 2MASSI J0825196+211552 | L7.5 | 13.050.04 | 1700 | 6.0 | 1800 | 6.0 | |||
| 2MASSW J0929336+342952 | L8 | 14.620.11 | 1400 | 5.0 | 1800 | 6.0 | |||
| 2MASSI J0328426+230205 | L8 | 14.840.13 | 1400 | 6.0 | 1700 | 6.0 | |||
| 2MASSW J1632291+190441 | L8 | 13.980.05 | 16.8 | 1400 | 5.5 | 14.06 | 1700 | 6.0 | 13.28 |
| 2MASSW J1523226+301456 bbGl 584C | L8 | 14.240.07 | 18.8 | 1400 | 5.5 | 14.30 | 1800 | 6.0 | 13.26 |