The Unusually Long Duration Gamma-ray Burst GRB 000911 111Partially based on observations obtained at the W. M. Keck Observatory which is operated by the California Association for Research in Astronomy, a scientific partnership among California Institute of Technology, the University of California and the National Aeronautics and Space Administration.
Abstract
Of all the well localized gamma-ray bursts, GRB 000911 has the longest duration (s), and ranks in the top 1% of BATSE bursts for fluence. Here, we report the discovery of the afterglow of this unique burst. In order to simultaneously fit our radio and optical observations, we are required to invoke a model involving an hard electron distribution, and a jet-break time less than 1.5 day. A spectrum of the host galaxy taken 111 days after the burst reveals a single emission line, interpreted as [OII] at a redshift , and a continuum break which we interpret as the Balmer limit at this redshift. Despite the long , the afterglow of GRB 000911 is not unusual in any other way when compared to the set of afterglows studied to date. We conclude that the duration of the GRB plays little part in determining the physics of the afterglow.
1. Introduction
The revolution in understanding the origin of gamma-ray bursts (GRBs) has been driven by the discovery and exploitation of long-lived lower-energy “afterglow” phenomenon (Costa et al. (1997); van Paradijs et al. (1997); Frail et al. (1997)). However, this revolution has been restricted to GRBs belonging to the so-called long/soft subclass (Kouveliotou et al. (1993)) which are GRBs with duration, s; here is the duration of the 90th percentile of the fluence. Technical difficulties have prevented rapid and precise localisation of short bursts, and consequently these objects continue to remain mysterious (see Hurley et al. 2001b for a summary of the searches for afterglows of short-duration GRBs).
The currently popular theory for GRBs holds that the long/soft GRBs come from the collapse of massive stars (MacFayden & Woosley (1999)), and short/hard GRBs are due to the merger of a pair of compact objects (e.g. Fryer et al. (1999)). The former model naturally accounts for the long duration since the newly formed black hole has access to a large amount of stellar material whereas in the latter model the duration of the accretion process is limited by the small amount of matter left over following such a merger (e.g., Janka et al. (1999), Narayan, Piran & Kumar (2001)).
Regardless of our current theoretical prejudice, the following three phenomena give us the most intimate observational view of the central engine: the variability, the duration of GRB profiles and the opening angles of jets. In the “Internal-External” shock model for long-duration GRBs, a model heavily supported by observations, the variability and the duration have been argued to arise from different processes (Nakar & Piran (2001)). The recent observational evidence for significant diversity in jet opening angles (Frail et al. (2001)) has motivated preliminary theoretical forays into the same (van Putten (2001)).
Unfortunately, we are far from knowing how to translate these three properties (variability, duration and opening angles) into physical properties of the central engine. In contrast, the study of the afterglow yield good measures of bulk properties (explosion energy, ambient density, location within the host galaxy, the host galaxy itself) as well as potentially direct information about the progenitors (X-ray line features, late time red bumps potentially related to an underlying supernova). Thus the next natural step in GRB studies will be to start empirically relating the engine properties to the afterglow properties. It is in this context that the study of GRB 000911 with its unusually long duration, s (the longest GRB with an identified afterglow to date), becomes potentially interesting. Here, we present the gamma-ray time history, the discovery of the afterglow, broad-band modelling of the afterglow and observations of the host galaxy of GRB 000911.
2. Gamma-ray Observations
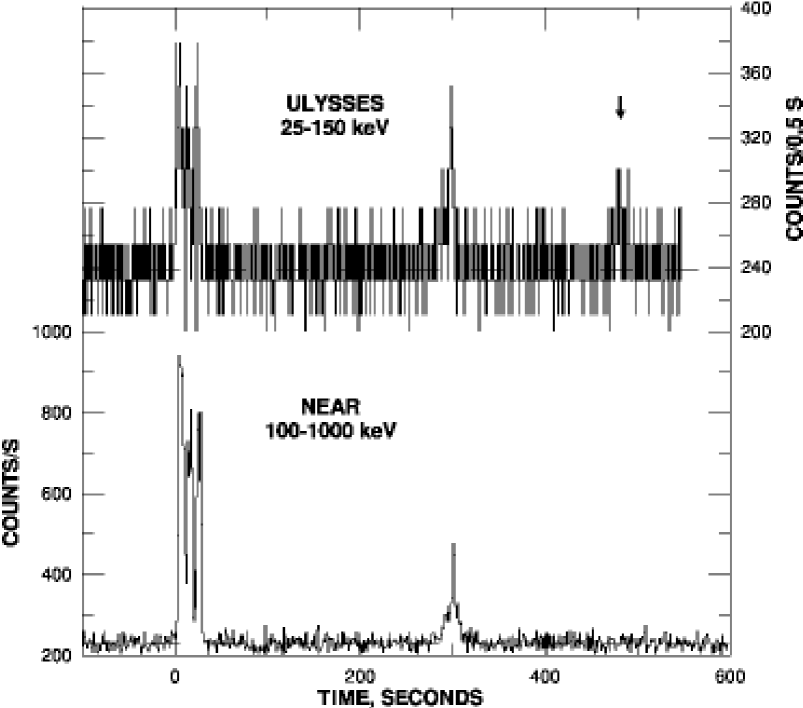
GRB 000911 was observed by three instruments in the Interplanetary Network (IPN): Ulysses GRB (25–150 keV), Konus/Wind, and NEAR/XGRS (100-1000 keV). The earth-crossing time of the burst was 2000 September 11.30242 UT. By 22.8 hours after the burst, the event was localized to an area of 30 arcmin2 and reported promptly to the GRB Coordinates Network (GCN)222http://gcn.gsfc.nasa.gov (Hurley et al. 2001a ).
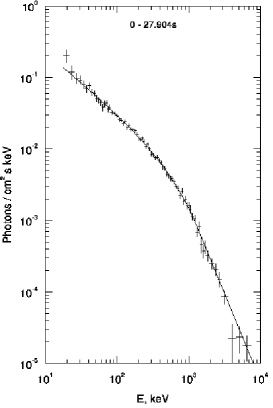
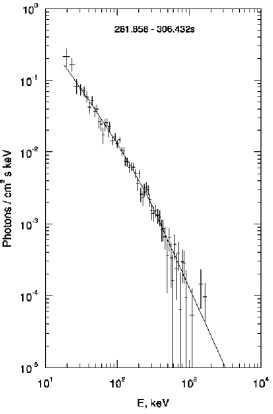
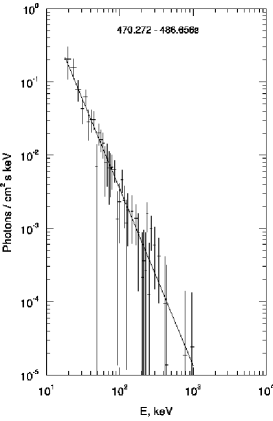
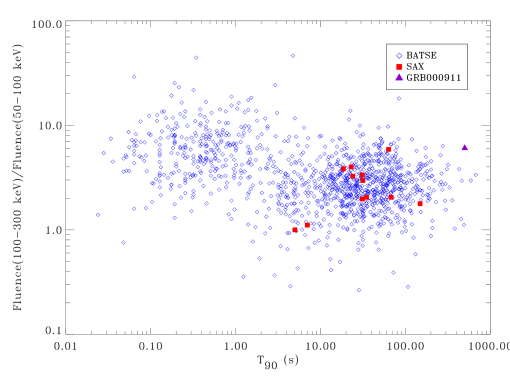
Three distinct episodes (pulses) can be seen in the Ulysses light curve and the first two episodes are clearly detectable in the NEAR data (Figure 1). Energy spectra for each pulse obtained from Konus/Wind (Figure 2) demonstrate the well-known hard-to-soft evolution and thereby support the idea that all three pulses arise from the same GRB. Furthermore, given the Ulysses GRB detection rate of one per three days, we consider it unlikely that the profiles are due to two distinct GRBs which are coincidentally detected at about the same time. Thus we conclude that the duration of this burst is approximately 500 s making it the longest duration GRB whose afterglow has been studied to date (see Figure 3).
3. Discovery of the Optical and Radio Afterglow
The IPN error box was first observed by the robotic 50-inch telescope at Mount Stromlo Observatory with the MACHO dual-beam camera 1.4 days after the burst. Very Large Array (VLA333The National Radio Astronomy Observatory (NRAO) is a facility of the National Science Foundation operated under cooperative agreement by Associated Universities, Inc. NRAO operates the VLA.) observations of GRB 000911 were initiated 0.8 days later at 8.46 GHz. All radio observations were obtained in the standard continuum mode with MHz contiguous bands. We observed the extra-galactic source J0203+115 for phase calibration and 3C48 (J0137+331) for flux calibration. All data were reduced using the Astronomical Image Processing System (AIPS).
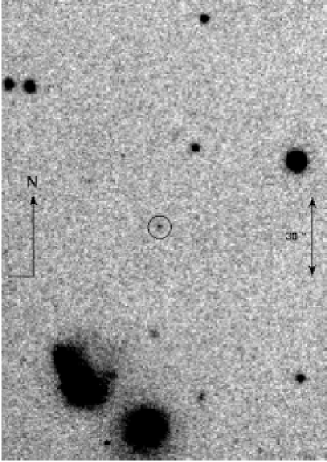
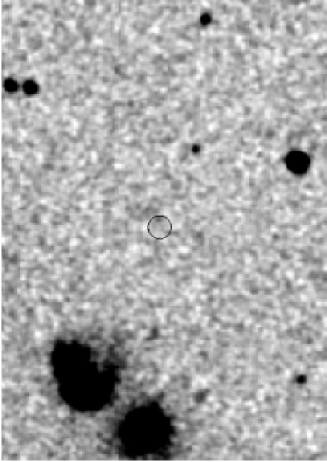
In the earliest radio observations (2.2 and 3.1 days after the burst), we identified as a candidate afterglow a source located at J2000 coordinates 02:18:34.36 +07:44:27.65 (with an estimated 2 error of 0.6 arcseconds in each axis) that brightened by 2 . An optical counterpart to this radio source (Figure 4) with mag was identified in our images obtained from the 50-inch MSO telescope but the source was not present on the Digital Palomar Observatory Sky Survey (Djorgovski et al. (1999)), although this is near the plate limit. Subsequent observations with Echellette Spectrograph and Imager (ESI) on the Keck II telescope of the W. M. Keck Observatory showed that the source decayed and thereby confirmed the identification of this source as the afterglow of GRB 000911.
Subsequently we began a program of VLA observations of the radio afterglow. The log of radio observations and the fluxes of the radio afterglow can be found in Table 2.
We observed the optical afterglow at the Keck Observatory in and bands at three additional epochs after the discovery. We bias-subtracted and flat-fielded the optical observations in the usual way, using the Image Reduction and Analysis Facility (IRAF)444IRAF is distributed by the National Optical Astronomy Observatories.. Aperture photometry was used to measure the magnitude of the optical afterglow in each image. Photometric zero points for the Keck imaging were based on stars in the field, with calibrated values provided by S. Covino and D. Lazzati from their first VLT epoch (Lazzati et al. (2001)). In addition, the large range of the color of stars in the field [ 0.4 to 1.8 mag] allowed us to fit and apply colour terms.
The first epoch optical images (in MACHO blue and red bands) are not sufficiently deep to use the calibrated VLT stars. For these images, we transform the stellar magnitudes calibrated by Henden (2000) to the MACHO photometric system using (the inverse of) the transformation calculated by Bessell & Germany (1999). We then photometered the afterglow against these stars and transformed back to the Johnson-Cousins system. An additional error of 3% was added in quadrature to these measurements to reflect errors in the transformation.
The log of our optical observations and the photometry are displayed in Table 3. All the optical data, photometric and spectroscopic, when displayed in physical units (Jy), have been corrected for foreground Galactic reddening mag (Schlegel, Finkbeiner & Davis (1998)) and an average Galactic extinction curve (with ) modelled by Cardelli, Clayton, & Mathis (1989).
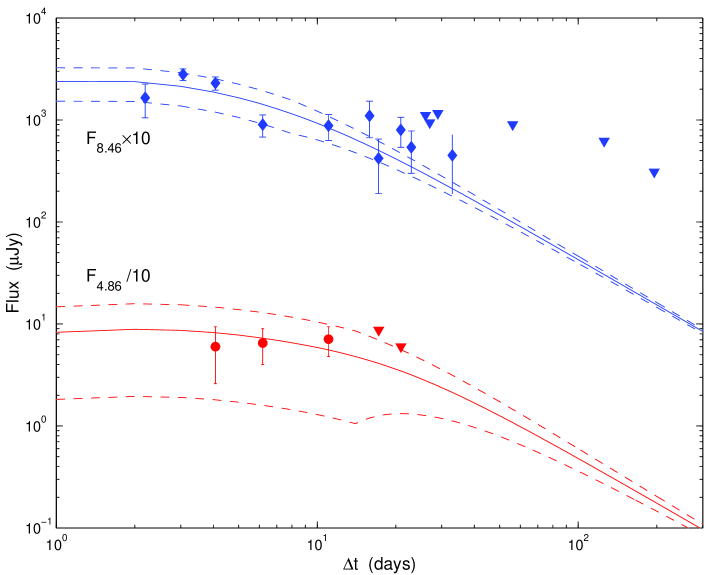
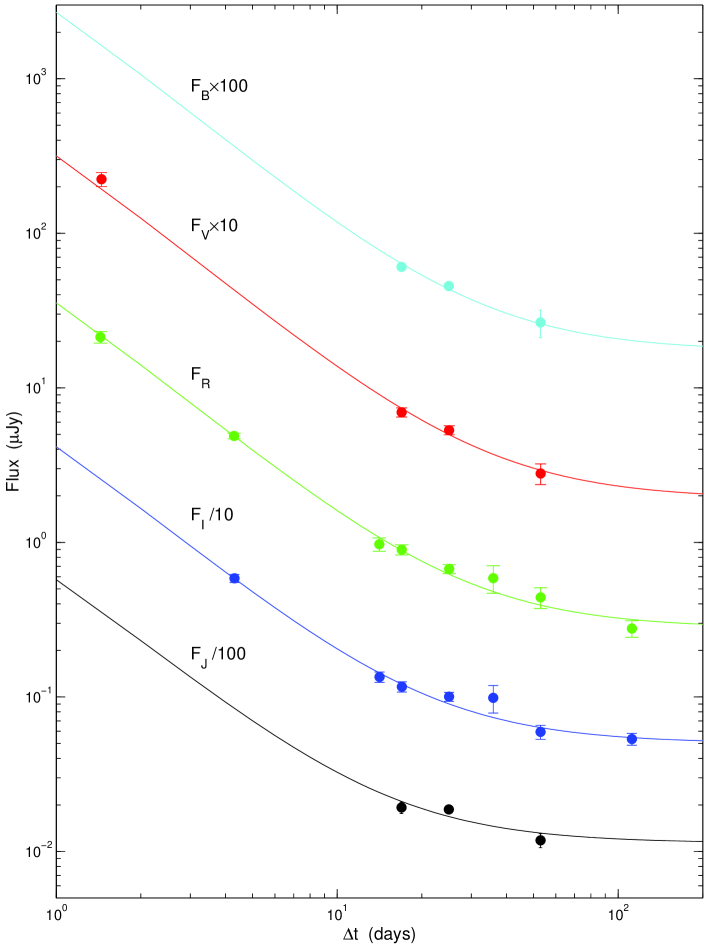
Optical and radio light curves are displayed in Figures 5 and 6 respectively. The optical light-curves (which include data from from Lazzati et al. (2001)) exhibit power law decay, with , followed by a levelling (at about 15 days). We identified the late time steady source with the host galaxy of GRB 000911.
4. The Afterglow Model
We modeled the radio and optical light curves using broad-band modeling programs that have been used for other GRBs (see, e.g., Berger et al. (2000), Panaitescu & Kumar (2000)).
The basic afterglow model assumes a relativistic spherical expansion into a constant-density (Sari, Piran & Narayan (1998); hereafter ISM) or wind-shaped medium (Chevalier & Li (2000); hereafter WIND). In this model electrons are accelerated at the shock front into a power law energy distribution, , with , and emit synchrotron radiation with a spectrum described by three break frequencies and an overall flux normalization, at the synchrotron peak frequency . The temporal evolution of the spectrum depends on the density, and density structure (ISM or WIND) of the ambient environment. In addition to the other microphysics parameters are the electron equipartition factor , and magnetic field equipartition factor .
The ISM model fails to simultaneously fit both the optical and radio data since in this model remains constant with time. As a result, this model predicts a lower flux density level than what is observed in the radio regime. This excess emission is too strong and consistently high to be explained by interstellar scintillation. Explanation in terms of a reverse shock contribution in the radio at early times (e.g. Frail et al. (2000)) also proved to yield unsatisfactory results, with a .
For the WIND model we again fail to find a satisfactory solution, with our best for 32 DOF (we were unable to constrain the cooling frequency in a meaningful way, and so it was fixed). In this case we encounter a similar problem in which the model predicts a lower flux level than is observed in the radio at early times.
We then considered the ISM model but allowed for a conical geometry (jets) for the explosion (Sari, Piran & Halpern (1999)). In this model (hereafter ISM+Jet), the jet edge becomes visible to observers at epoch () when the bulk Lorentz factor falls below , the inverse of the jet opening angle. Prior to this jet break time the evolution of the synchrotron spectrum is equivalent to the spherical evolution scenarios. For the lightcurves are expected to be: or for and , respectively.
The best fit parameters for the jet model are: d, GHz, GHz, GHz, mJy and ; here the epoch for the frequencies is . Thus the ISM+Jet model requires a very “flat ” (). Such flat values have been inferred in the afterglows of several other GRBs, e.g. GRB 000301C, GRB 010222 (see Panaitescu & Kumar (2000)).
Afterglow with must have a high frequency cutoff so that the total energy in the afterglow does not diverge. Bhattacharya (2001) has shown that the temporal evolution of the spectrum of an afterglow with is identical to that for provided the maximum Lorentz factor of the electron distribution scales linearly with the Lorentz factor of the shock. This requirement has yet to be demonstrated, but appears to be a reasonable assumption. Accepting this ad hoc requirement, we can convert the above inferred parameters to yield the following physical parameters: , , , and cm-3. We warn the reader that given the paucity of the afterglow data, each of these values, except for , are subject to the large errors in the fit break frequencies and should not be taken as definitive (the error in is set by the error in the optical decay slope, which is small). The unphysical value of () is likely the result of these large errors. The overall /DOF=29.7/31 is quite good and the results of the fits can be found in Figures 6 and 5.
5. Host Galaxy
Spectra of the host galaxy were obtained on Keck II 01 January 2001 UT, in excellent conditions, using the Low-Resolution Imaging Spectrometer (LRIS; Oke et al. (1995)). We used a 1.0-arcsec wide long-slit, at a position angle , close to the parallactic, and a 300 lines mm-1 grating, giving an effective instrumental resolution FWHM Å, and an approximate wavelength coverage 3950–8900 Å. We obtained 4 exposures of 1800 s each, with small dithers on the slit. Exposures of internal flat-field lamp and arc lamps were obtained for calibrations. Small wavelength shifts due to the instrument flexure were removed by fitting the wavelengths of strong, unblended night sky lines. The net resulting wavelength scatter is Å. Since no adequate flux calibration was obtained for this night, we used the response curves determined from exposures of standard stars BD and BD from Oke & Gunn (1983), obtained 2 nights before with the same instrument setup. We removed the residual flux zero-point uncertainty (due to the differential slit losses and seeing variations) by matching the spectroscopic magnitudes to those determined photometrically; we estimate the net flux zero-point uncertainty to be %.
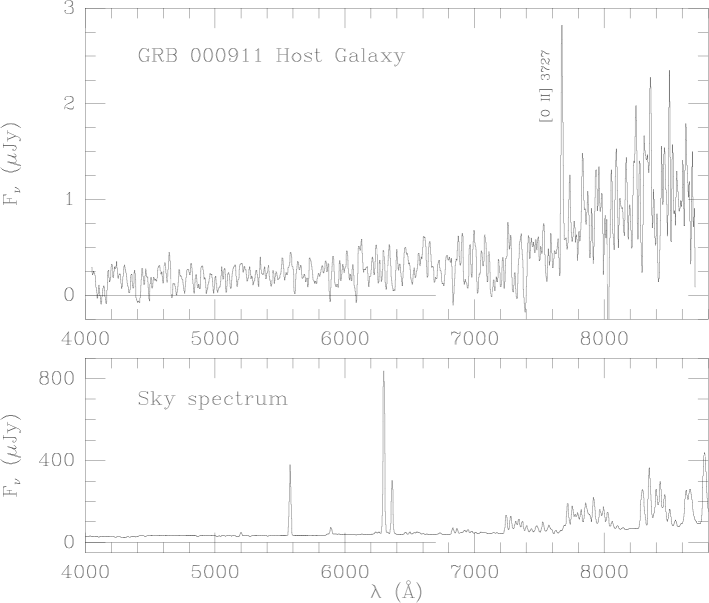
The final combined spectrum of the host galaxy is shown in figure 7. A strong emission line is detected at Å. Given the presence of a well-detected continuum blueward of the line, and the absence of other strong lines, we interpret this line as the commonly detected [O II] 3727 doublet at a redshift . Note that the instrumental resolution was not high enough to resolve this line as a doublet. There is also a hint of the possible H line at Å, but the difficulty inherent in subtracting the strong night sky lines in this part of the spectrum precludes a definitive measurement of this or other high-order Balmer lines. However, there is a clear continuum decrement corresponding to the Balmer limit at this redshift, and thus we consider our redshift interpretation to be secure.
In what follows, we assume for the foreground Galactic reddening mag (Schlegel, Finkbeiner & Davis (1998)) and a standard Galactic extinction curve (Cardelli, Clayton & Mathis (1989)). The fluxes quoted are uncertain by about 20%, with contributions from the statistical noise and the systematic flux zero-point uncertainty contributing about 10% each.
The observed [O II] 3727 line flux555The fluxes quoted are uncertain by about 20%, with contributions from the statistical noise and the systematic flux zero-point uncertainty contributing about 10% each. is erg cm-2 s-1. Correcting for the Galactic extinction, we obtain erg cm-2 s-1. The observed equivalent width is Å, i.e., Å in the restframe. This is typical for field galaxies at comparable redshifts, which have restframe equivalent widths spanning 0 – 50 Å (Hogg et al. (1998)). The observed continuum flux near Å, corresponding to the restframe wavelength of 2800 Å, is Jy. Correcting for the Galactic extinction, we obtain Jy. Finally, from the observed band magnitude of 24.3 mag the host, we estimate the observed flux corresponding to the restframe band to be Jy. Correcting for the extinction, we obtain Jy.
We will assume a flat cosmology with km s-1 Mpc-1, , and . For , the luminosity distance is cm, and 1 arcsec corresponds to 8.7 proper kpc in projection. From the [O II] 3727 line flux, we calculate the line luminosity erg s-1. Using the star formation rate estimator from Kennicutt (1998), we derive the star formation rate yr-1. From the UV continuum power at Å, using the estimator from Madau, Pozzetti & Dickinson (1998), we obtain yr-1. The relatively small difference between these two estimates may be due in part to a combination of our measurement errors (which are about 20% for each value), the intrinsic scatter of these estimators (which is at least 30%), and possibly to some reddening in the host galaxy (the flux at Å would be extincted more than the flux at Å). Our optically derived SFR is a lower limit since the optical/UV tracers are insensitive to star-formation arising in dusty regions.
From the observed continuum flux corresponding to the restframe band we derive mag, i.e. the luminosity (then) corresponding to (today). While the interpretation of this measurement hinges on the assumed evolution of the object (i.e. it may be a progenitor of a present-day spiral, or a dwarf galaxy), we note that it is comparable to the observed luminosities of other GRB hosts (Hogg & Fruchter (1999)).
We measure an offset from the afterglow to the host of arcsec, well within the marginally resolved host (FWHM 720 mas) and consistent with the offsets for other GRBs found by Bloom, Kulkarni & Djorgovski (2000) . Thus even in this respect we find that GRB 000911 appears to be no different from other long/soft GRBs.
6. Conclusions
With a duration of 500 s, GRB 000911 is the longest duration burst to be well localized to date. Here we have presented the high energy profiles and the evolution of the spectrum. Thanks to a combination of prompt radio and optical observations we were able to discover and study the afterglow. After the afterglow had faded, we observed the host galaxy and obtained its redshift, .
We obtained a modest amount of optical and radio data of the afterglow. The best fit model requires a flat electron energy index, and a break in the afterglow at about d after the burst. Following the usual interpretation, we attribute this break to a jet. At a redshift of 1.0585, the isotropic -ray energy release (using the Konus fluence) is erg. Using the particular formulation given in Frail et al. (2001) the jet break time of d translates to a jet opening angle, . The -ray energy corrected for the conical geometry is erg (Sari, Piran & Halpern (1999)) where is the ambient density in units of 0.1 cm-3. This value is consistent with the median found by Frail et al. (2001) of erg with a spread of a factor of two. Since the jet break must have occurred prior to our first observation, a more conservative value of d yields an upper limit on the jet-corrected energy release of erg, again consistent with the result of Frail et al.(2001).
The properties of this afterglow is quite similar to that of the short duration burst ( s) GRB 000301C (Panaitescu (2001)). Both are flat spectrum bursts and with a jet around a day or so. Thus it appears that the duration of the burst had little effect on either the jet opening angle or on the afterglow parameters.
Following the discovery of afterglow of GRB 000911, Lazzati et al. (2001) organized a program at ESO and Keck to follow up the optical afterglow at late times and found marginal evidence for an underlying supernova (SN). Such late time red-bumps were first noted in GRB 980326 (Bloom et al. (1999)) and GRB 970228 (Reichart, (1999); Galama et al. (2000)) and interpreted as underlying SN. Other authors have attributed such bumps to dust echoes (Esin & Blandford (2000)). In any case, the presence of such late time red bumps seem to occur in GRBs with different durations. Finally, the host galaxy of GRB 000911 appears to be quite representative of host galaxies.
We conclude that there is no compelling reason to believe that the duration of GRBs (when restricted to the sub-class of long duration events) plays a significant role in determining either the afterglow properties and perhaps even particularly are related to the properties of the central engine (the jet opening angle).
Acknowledgements
SRK and SGD thank NSF for support of our ground-based GRB observing program. We are grateful to the staff of MSSSO and Keck observatories for their expert help. PAP gratefully acknowledges an Alex Rodgers’ Travelling Scholarship. JSB gratefully acknowledges the fellowship support from the Fannie and John Hertz Foundation. KH is grateful for Ulysses support under JPL Contract 958056, and for IPN support under the NEAR Participating Scientist program, NAG5-9503, and under the LTSA, NAG5-3500.
References
- Berger et al. (2000) Berger, E.J., et al., 2000, ApJ, 545, 56.
- Bessell & Germany (1999) Bessell, M.S. & Germany, L.M., 1999, PASP, 111, 1421.
- Bhattacharya (2001) Bhattacharya, D., 2001, BASI (submitted), astro-ph/0104250.
- Esin & Blandford (2000) Esin, A. A. & Blandford, R. D. 2000, ApJ 534, L151
- Bloom, Kulkarni & Djorgovski (2000) Bloom, J.S., Kulkarni, S.R. & Djorgovski, S.G., 2000, AJ (submitted), astro-ph/0010176.
- Bloom et al. (1999) Bloom, J.S., et al., 1999, Nature, 401, 453.
- Briggs et al. (1999) Briggs, M. S. et al. 1999, ApJ 524, 82.
- Cardelli, Clayton & Mathis (1989) Cardelli, J.A., Clayton, G.C. & Mathis, J.S., 1989, ApJ, 345, 245.
- Chevalier & Li (2000) Chevalier, R.A. & Li, Z.-Y., 2000, ApJ, 536, 195.
- Costa et al. (1997) Costa, E., et al., 1997, Nature, 387, 783.
- Djorgovski et al. (1999) Djorgovski, S. G., Gal, R. R., Odewahn, S. C., DeCarvalho, R. R., Brunner, R., Longo, G. & Scaramella, R. 1999, in Wide Field Surveys in Cosmology, S. Colombi et al., eds., p. 89.
- Frail et al. (2001) Frail, D.A., et al., 2001, astro-ph/0102282.
- Frail et al. (2000) Frail, D.A., et al., 2000, ApJ, 538, L129.
- Frail et al. (1997) Frail, D.A., Kulkarni, S.R., Nicastro, S.R., Feroci, M. & Taylor, G.B., 1997, Nature, 389, 261.
- Frontera et al. (2000) Frontera, F., et al., 2000, ApJSS, 127, 59.
- Fryer et al. (1999) Fryer, C.L., Woosley, S.E., Herant,M., & Davies, M.B., 1999, ApJ, 520, 650.
- Galama et al. (2000) Galama, T. et al. 2000, ApJ 536, 185.
- Galama et al. (2001) Galama, T.J., et al., 2001, in preparation.
- Henden (2000) Henden, A., 2000, GCN Circular 800.
- Harrison et al. (2001) Harrison, F.A., et al., 2001, ApJ (submitted), astro-ph/0103377.
- Hogg & Fruchter (1999) Hogg, D.W. & Fruchter, A.S., 1999, ApJ, 520, 54.
- Hogg et al. (1998) Hogg, D., Cohen, J., Blandford, R., & Pahre, M. 1998, ApJ, 504, 622.
- (23) Hurley, K., et al., 2001a, GCN Circular 791.
- (24) Hurley, K., et al., 2001b, ApJ (submitted), astro-ph/0107188.
- Janka et al. (1999) Janka, H.-T., Eberl, T., Ruffert, M., & Fryer, C.L., 1999, ApJ, 527, L39.
- Kennicutt (1998) Kennicutt, R.C., 1998, ARA&A, 36, 189.
- Kouveliotou et al. (1993) Kouveliotou, C., Meegan, C.A., Fishman, G.J., Bhat, N.P., Briggs, M.S., Koshut, T.M., Paciesas, W.S. & Pendleton, G.N., 1993, ApJ, 413, L101.
- Lazzati et al. (2001) Lazzati, D., et al., 2001, A&A (in press), astro-ph/0109287
- MacFayden & Woosley (1999) MacFayden, A. & Woosley, S. E., 1999, ApJ, 524, 262.
- Madau, Pozzetti & Dickinson (1998) Madau, P., Pozzetti, L. & Dickinson, M., 1998, ApJ, 498, 106.
- Nakar & Piran (2001) Nakar, E. & Piran, T. 2001, astro-ph/0103210.
- Narayan, Piran & Kumar (2001) Narayan, R., Piran, T. & Kumar, P. 2001, ApJ 557, 949.
- Oke & Gunn (1983) Oke, J.B. & Gunn, J.E., 1983, ApJ, 266, 713.
- Oke et al. (1995) Oke, J.B., et al., 1995, PASP, 107, 375.
- Panaitescu (2001) Panaitescu, A., 2001, ApJ (accepted), astro-ph/0102401.
- Panaitescu & Kumar (2000) Panaitescu, A. & Kumar, P., 2001, ApJ (submitted), astro-ph/0108045.
- van Paradijs et al. (1997) van Paradijs J., et al., 1997, Nature, 386, 686.
- Reichart, (1999) Reichart, D.E., 1999, ApJ, 521, L111.
- Sagar et al. (2001) Sagar, R., et al., 2001, BASI (submitted), astro-ph/0104249.
- Sari, Piran & Halpern (1999) Sari, R., Piran, T. & Halpern, J., 1999, ApJ, 519, L17.
- Sari, Piran & Narayan (1998) Sari, R., Piran, T. & Narayan, R., 1998, ApJ, 497, L17.
- Schlegel, Finkbeiner & Davis (1998) Schlegel, D.J., Finkbeiner, D.P., & Davis, M., 1998, ApJ, 500, 525.
- van Putten (2001) van Putten, M. H. P. M. 2001, astro-ph/0109429
- Walker (1998) Walker, M.A., 1998, MNRAS, 294, 307.
| Epoch (s) | Fluence | Peak Flux | Energy Interval |
|---|---|---|---|
| (s) | erg cm-2 | erg cm-2 s-1 | keV |
| 0–27.9 | 15–8000 | ||
| 281.9-306.4 | – | 15–5000 | |
| 470.3–486.7 | – | 15-1000 |
Note. — Peak fluxes for the second and third pulses are not shown because the time bins were too large, 8.192 s.
| Epoch | S | |
|---|---|---|
| (UT) | (GHz) | (Jy) |
| 2000 Sep 13.49 | 8.46 | 16560 |
| 2000 Sep 14.36 | 8.46 | 27836 |
| 2000 Sep 15.36 | 4.86 | 6034 |
| 2000 Sep 15.36 | 8.46 | 23034 |
| 2000 Sep 17.49 | 4.86 | 6525 |
| 2000 Sep 17.49 | 8.46 | 9022 |
| 2000 Sep 22.35 | 4.86 | 7123 |
| 2000 Sep 22.35 | 8.46 | 8825 |
| 2000 Sep 28.50 | 4.86 | 2731 |
| 2000 Sep 28.50 | 8.46 | 4223 |
| 2000 Oct 2.22 | 4.86 | 1025 |
| 2000 Oct 2.22 | 8.46 | 8026 |
| 2000 Oct 4.23 | 8.46 | 5424 |
| 2000 Oct 8.29 | 8.46 | -650 |
| 2000 Oct 10.27 | 8.46 | -4681 |
| 2000 Oct 14.24 | 8.46 | 4526 |
| 2000 Nov 7.38 | 8.46 | 3030 |
| 2001 Jan 15.08 | 8.46 | 2618 |
Note. — The columns are (left to right), (1) UT date of the start of each observation, (2) time elapsed since the -ray burst, (3) telescope name, (4) observing frequency, and (5) peak flux density at the best fit position of the radio transient, with the error given as the root mean square noise on the image.
| Date (UT) | Filter | Magnitude | Telescope |
|---|---|---|---|
| 2000 Sep 12.737 | V | 20.90 0.10 | MSO50 |
| 2000 Sep 12.737 | R | 20.700 0.081 | MSO50 |
| 2000 Sep 15.593 | R | 22.299 0.030 | Keck II + ESI |
| 2000 Sep 15.606 | I | 21.816 0.052 | Keck II + ESI |
| 2000 Sep 25.421 | R | 24.052 0.094 | Keck I + LRIS |
| 2000 Sep 25.451 | I | 23.412 0.071 | Keck I + LRIS |
| 2001 Jan 1.221 | R | 25.414 0.119 | Keck II + ESI |
| 2001 Jan 1.248 | I | 24.415 0.083 | Keck II + ESI |