Molecular Gas Around Young Stellar Clusters
Abstract
We have begun a survey of the molecular gas surrounding 31 young clusters in order to investigate the link between environment and the resulting cluster. We present here a preliminary comparison of two clusters in our sample: GGD12-15 and Mon R2. Since both clusters are located in the MonR2 molecular cloud at a distance of 830 pc (Carpenter 2000), observational biases due to differing sensitivities and angular resolutions are avoided.
FCRAO, University of Massachusetts, 619 Lederle GRC, Amherst, MA, 01003, USA. email: naomi@fcrao.umass.edu
Harvard-Smithsonian CfA, 60 Garden St., Cambridge, MA, USA.
Steward Observatory, University of Arizona, Tucson, AZ, USA & Max-Planck-Inst. f. Radioastronomie, Bonn, Germany.
1. Introduction
Surveys for young stars in molecular clouds have shown that most stars do not form in isolation, but in aggregates ranging from the widely dispersed groups of stars found in the Taurus cloud, to the clusters found in Orion, and ultimately to the “superclusters” such as NGC 3603. There is an enormous range in the richness of these stellar groups/clusters, from several stars in Taurus to more than a thousand stars in NGC 3603, all within regions of a few cubic parsecs. To understand this enormous range in richness and the dependence of the richness on the molecular gas environment, we have undertaken a comparative study of both the molecular and stellar components of a sample of 31 clusters within 1 kpc of the Sun.
2. Observations
We have obtained maps of the molecular gas surrounding the two young stellar clusters in 13CO 1–0 and C18O 1–0 at 45′′ resolution with the FCRAO 14m telescope. These observations were followed up with higher resolution (30′′) C18O 2–1 On-the-Fly (OTF) maps, obtained at the Heinrich Hertz Telescope (HHT), operated by the Submillimeter Telescope Observatory (SMTO).
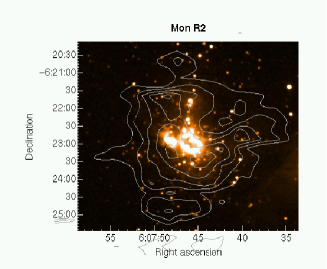
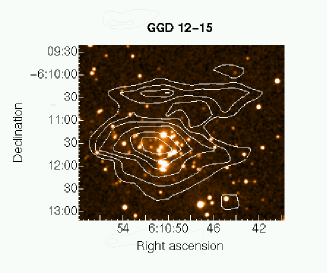
Figure 1 shows contours of the C18O 2–1 emission overlaid on a 2MASS K-band image. The dense gas traced by the C18O seems to trace the ring structure apparent in the stellar component of Mon R2. The gas around GGD 12-15 appears elongated in the east-west direction.
The table below compares the gas and stellar properties of the two clusters. The stellar properties are taken from Carpenter (2000), while the gas properties are derived from our C18O observations.
| Cluster | Nstars | Mgas(total) | mean V |
|---|---|---|---|
| x 104 M | km s-1 | ||
| Mon R2 | 371 | 9.2 | 1.68 |
| GGD 12–15 | 134 | 5.4 | 2.26 |
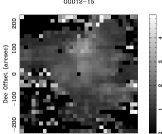
Figure 2 shows maps of the C18O line width, centered on the same position as fig. 1 . The ring-like morphology seen in the K-band image of Mon R2 can also be clearly seen in the line-width map. The horizontal line apparent at a Dec offset +100′′ is an artifact due to lower signal–noise ratio in this region of the map. There is also a region of low line-width north-east of the stellar cluster. It is harder to pick out any structure in the noisier line-width map of GGD 12-15, but it does appear to increase towards the centre.
References
Carpenter, J.M. 2000, AJ, 120, 3139