Cataclysmic Variables from SDSS I. The First Results 111Based on observations obtained with the Sloan Digital Sky Survey and with the Apache Point Observatory (APO) 3.5m telescope, which are owned and operated by the Astrophysical Research Consortium (ARC)
Abstract
The commissioning year of the Sloan Digital Sky Survey has demonstrated that many cataclysmic variables have been missed in previous surveys with brighter limits. We report the identification of 22 cataclysmic variables, of which 19 are new discoveries and 3 are known systems (SW UMa, BH Lyn and Vir4). A compendium of positions, colors and characteristics of these systems obtained from the SDSS photometry and spectroscopy is presented along with data obtained during follow-up studies with the Apache Point Observatory (APO) and Manastash Ridge Observatory (MRO) telescopes. We have determined orbital periods for 3 of the new systems: two show dwarf nova outbursts, and the third is a likely magnetic system with eclipses of its region of line emission. Based on these results, we expect the completed survey to locate at least 400 new CVs. Most of these will be faint systems with low accretion rates that will provide new constraints on binary evolution models.
1 Introduction
Cataclysmic Variables (CVs) comprise all the close binaries that contain a white dwarf accreting material transferred from a companion, usually a late main-sequence star (see review book by Warner 1995). CVs include novae, dwarf novae and nova-likes, which are distinguished by their amplitudes and timescale for variability. A nova outburst due to a thermonuclear runaway event creates a rise in brightness of 10-20 mag; a dwarf nova undergoes 2-7 mag outbursts from a normal quiescent state on a quasi-periodic timescale ranging from weeks to years (usually attributed to a disk instability); and a nova-like exhibits random variability of several magnitudes likely related to changes in mass transfer causing states of low or high accretion. A large range in orbital period (from just under 80 min to over 2 days, with most being under 2 hrs) and in magnetic field strength of the white dwarf (from 1 MG to 240 MG), results in a wide variety of characteristic behavior and various observational selection effects. While most of the nearly 1000 known or suspected CVs (Downes et al. 2001; D01) are faint at quiescence and have late-type M dwarf secondaries, most of the early discoveries from past surveys were blue, bright objects with dominant accretion disks or outbursts that brought them to high luminosities, thus making them accessible to detection.
Evolutionary models for close binaries (Howell, Rappaport & Politano 1997) predict CVs should reach a period minimum near 80 min in the lifetime of the Galaxy and have very cool, optically unobservable secondaries with very low mass transfer rates. Surveys that have the capability to reach faint magnitudes ( 16) should be able to find this population of faint, old systems. By determining the numbers and characteristics of these faint systems, we can constrain evolutionary theories and determine the true distribution of CV types in the Galaxy. We expect these results to be quite different from the bright-end surveys comprised of accretion disk-dominated systems e.g. the Palomar-Green survey (Green et al. 1982).
The Sloan Digital Sky Survey (SDSS, York et al. 2000) is ideal for finding these faint blue and red objects. The photometry of 104 deg2 of sky in 5 filters to 20th mag allows a selection of all types of CV systems (blue ones dominated by disks or white dwarfs as well as those that are both blue and red if the accretion disk is negligible and the primary white dwarf and M dwarf secondary are the main sources of light). In addition to the photometry, SDSS spectroscopy allows unambiguous identification of a CV from the strong hydrogen Balmer and helium emission lines that typically signify ongoing accretion. The strength and width of these lines provide clues to the inclination, orbital period and mass accretion rate (Patterson 1984, Warner 1995). We report here the results we have obtained for objects we could clearly identify as CVs during the SDSS commissioning year (data obtained prior to 1 January 2001) and the implications for the total number of CVs that will be found by the completion of the SDSS project.
2 Finding CV Candidates
The SDSS imaging data are obtained on a dedicated 2.5m telescope at Apache Point Observatory with a mosaic CCD camera (Gunn et al. 1998) which observes in 5 bands (Fukugita et al. 1996; see Lupton, Gunn, & Szalay 1999 for a discussion of the modified magnitude scale). Until the final SDSS photometric system is defined, the preliminary magnitudes are denoted by , with the errors in the calibration estimated to be about 5% at 20th mag. The data are reduced by a photometric pipeline (Lupton et al. 2001) which separates stars from galaxies using their surface brightness distribution and computes several types of magnitude, including the point source magnitudes which we use in this paper. The astrometric accuracy is 0.10 arcsec. Spectra of objects selected from the photometric data are observed for typically 45 min with two fiber-fed CCD spectrographs (on the 2.5m telescope) covering the range of 3900-6200Å (blue beam) and 5800-9200Å (red beam) at a resolving power of 1800 (York et al. 2000). The spectra are wavelength and flux-calibrated and atmospheric absorption bands are corrected using sdF stars. The resulting spectra are then classified as stars, galaxies or quasars and redshifts are determined. Of the 640 fibers used in each 3∘ field, 32 are used for sky measurements, 10 for standards and the rest are primarily for galaxies and quasars. Stellar projects typically target about 10 fibers per field with CVs having approximately one of these fibers.
During the commissioning year, a number of photometric selection criteria were attempted in order to maximize the chance of finding new CVs. We first tried the range of colors found by Krisciunas, Margon & Szkody (1998), who used filters close to those of SDSS to observe known CVs of various types. The CVs easily separate from main-sequence stars in , but overlap with quasars (Fan 1999) and white dwarfs. In addition, the large color range possible for redder colors does not allow a unique discriminator. Thus, selecting by the blue colors resulted in spectra that turned out to be primarily quasars and single white dwarfs. When we tried simultaneous blue and red criteria ( and ) to select for CVs without much disk contribution, we were successful in obtaining mostly non-interacting WD+M binaries with a few CVs. These criteria remain for the project color selection; in addition to the CVs found, the WD+M binaries are being used in follow-up studies to search for systems which are close to starting mass transfer (i.e pre-CVs), and to compare magnetic activity levels for single M stars to those in close binaries (Raymond, Szkody & Hawley 2001).
The best success at finding the blue CVs came from using the fact that QSOs are primary targets for spectroscopic fibers (hence more are observed than stars) and some quasars overlap the colors of CVs. Thus, we could search the spectra obtained of quasar candidates for those that turned out to be non-quasars i.e. those having zero-redshift and broad hydrogen Balmer and helium emission lines. Several fibers for extreme blue objects obtained under a serendipity classification also yielded blue CVs.
Because the commissioning year involved changing color selections for all targets, this is not a uniform sample. Nor will the final sample of CVs be complete, as there are not sufficient fibers for stars to target all possible CVs. However, since the QSO, serendipity and CV selection criteria will not undergo further large changes, the results from this past year cover a representative sample of what will be found and represent a lower limit to the actual number of CVs that can be located by combining the SDSS database with follow-up spectroscopic and variability studies. Our results reported here include spectra obtained from fields that cover an effective area of about 600 sq deg. The spectroscopic identification of 22 CVs in this area means that we found about 0.04 per sq deg. Thus, we can expect about 400 new CVs in the entire survey from the spectra alone. Follow-up time-resolved spectra can be used to determine the nature of these objects, as well as to identify pre-CVs from the WD+M binary sample. Wide-field, time-resolved photometry on selected fields will be necessary to identify a complete sample of CVs using the SDSS colors combined with variability information.
3 Results
The 22 objects that we identify as CVs are listed in Table 1 along with the date of the SDSS spectrum, and the magnitude and colors (with no correction for reddening). The naming convention is SDSSp Jhhmmss.ss+ddmmss.s, where the coordinate equinox is J2000 and the “p” refers to the preliminary astrometry. Throughout the rest of this paper, we will abbreviate the names to SDSShhmm for convenience. Objects which have data publicly available through the SDSS early data release (Stoughton et al. 2001) are marked. Finding charts from the Palomar Digitized Sky Survey (DSS) will be available from the online CV catalog (D01). The last column of Table 1 gives brief comments which are elaborated in the sections below.
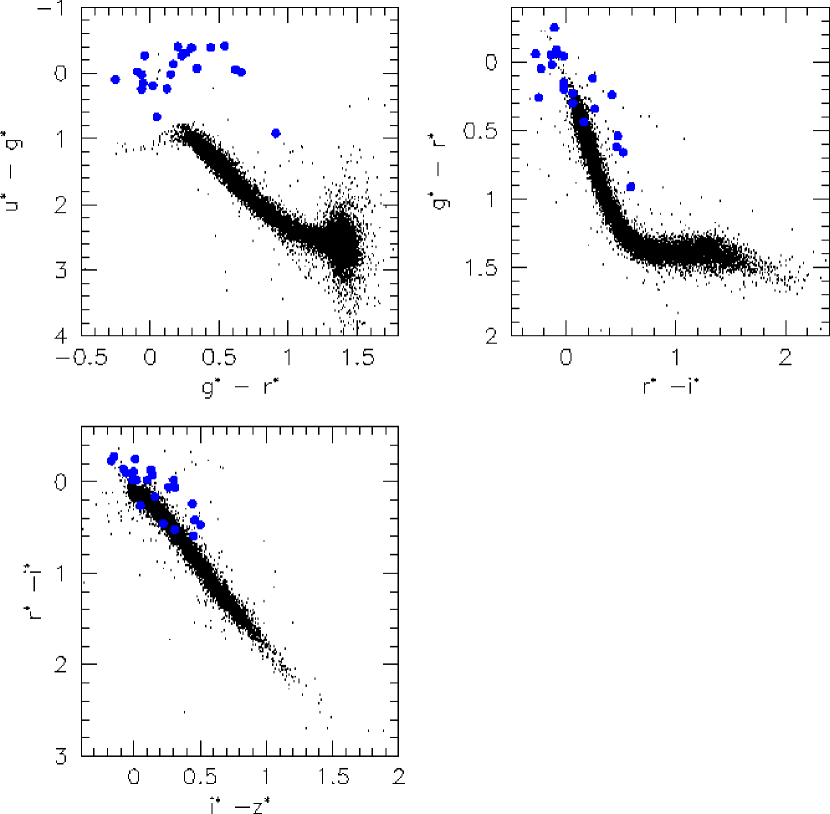
Figure 1 shows the colors of the 22 objects in the SDSS color-color diagrams along with the stellar locus. As noted above, the contributions of the accretion disk and white dwarf generally result in a separation of the CVs from the main sequence, especially in the bluest colors. In this sample, about 90% of the objects were found by QSO and serendipity selection criteria. Two CVs (SDSS0155 and SDSS0813) satisfied the selection criteria of blue+red colors given in Section 2.
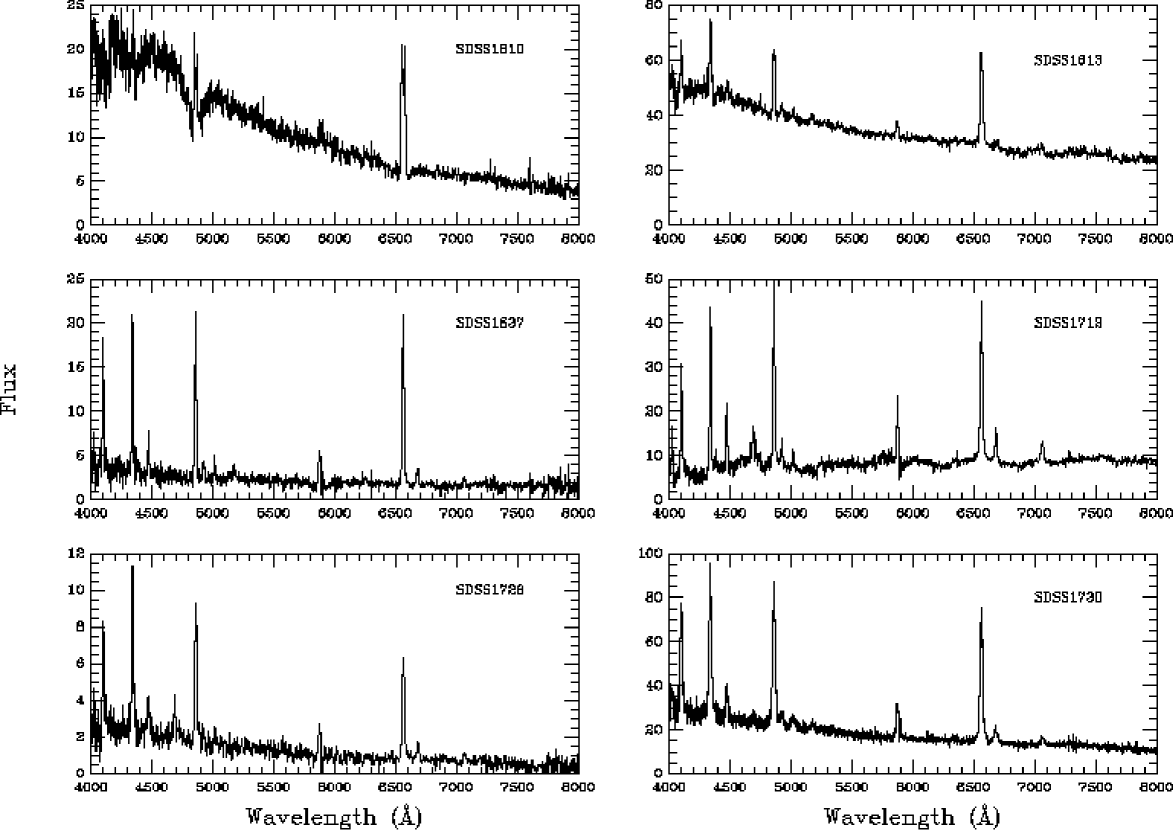
Figure 2 shows the SDSS spectra for all systems except for the previously known ones, BH Lyn and SW UMa, which have published spectra available (Hoard & Szkody 1997; Shafter, Szkody & Thorstensen 1986), and SDSS0155 which was saturated in the fixed exposure time for its field. Table 2 lists the equivalent widths and fluxes of the prominent hydrogen Balmer and helium lines. In this table, the object is identified both by its abbreviated SDSS name and the plate-fiber number, where the plate number refers to the catalog number of the SDSS plug plate used to observe each field. Of the 20 objects in Table 2, 13 (65%) have H equivalent widths 20Å, and 10 (50%) have values 50Å. According to the approximate relation between H EW and given in Patterson (1984), these numbers indicate we are finding the low accretion rate systems ( of 10-10 to 10-12M⊙ yr-1) i.e. the objects are faint not because they are observed at a large distance, but because they are intrinsically faint due to low mass transfer rates.
For several systems, we conducted follow-up photometric observations using the UW 0.76m telescope in Eastern Washington at Manastash Ridge Observatory (MRO) equipped with a 1024x1024 CCD, and spectroscopic observations with the UW share of the 3.5m telescope in New Mexico at Apache Point Observatory (APO) equipped with a Double Imaging Spectrograph (DIS). The spectrograph was used in high resolution mode (resolution about 3Å) with a 1.5 arcsec slit covering the wavelength regions of 4200-5000Å in the blue and 6300-7300Å in the red. Sporadic spectra on different nights were obtained to look for changes in the spectral lines and intensities that would identify a dwarf nova outburst or the high/low state of a nova-like object. For the brightest systems, time-resolved spectra over several hours were used to determine the orbital period and to measure radial velocities. The orbital period can also be an indicator of accretion rate, as the lowest rates generally exist in disk systems at quiescence that have orbital periods under two hours (Patterson 1984, Warner 1995), although low accretion rates can also occur in systems with longer orbital period when mass transfer sporadically turns off. The dates and modes of follow-up observations are listed in Table 3.
3.1 Previously Known Systems
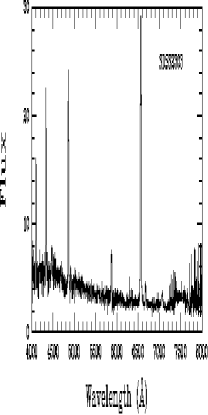
There were 3 previously known CVs for which SDSS spectra were obtained, as their colors matched the selection criteria of quasars or serendipity. Two are relatively well-known systems with published photometry and spectroscopy (SW UMa and BH Lyn) listed in the D01 catalog as well as the Ritter & Kolb (1998) catalog. The third object (listed as Vir4 in the D01 catalog) is a recently discovered eclipsing dwarf nova with an orbital period of 1.75 hrs (Vanmunster, Velthuis & McCormick 2000). Two SDSS spectra of this object at quiescence were obtained (April and May; Table 1) and three APO spectra in May (Table 3). As there are no published spectra of this system, we show its spectrum (SDSS1435) in Figure 1. All the spectra of Vir4 reveal deep central absorption in the Balmer emission lines, which increases up the Balmer series. This feature is typical of high inclination, eclipsing systems (Vogt 1981) and is postulated to be caused by low velocity, cool outer disk material in the line of sight.
3.2 High Inclination Systems
Two other systems also reveal the deep central absorption that is likely an indication of high inclination (SDSS1555 and SDSS0151). Confirmation of high inclination from an eclipse awaits time-resolved photometry or spectroscopy with larger aperture telescopes, or observations during an outburst when the system is brighter.
3.3 Dwarf Novae
As the SDSS photometry provides a separate epoch of observation from the SDSS spectroscopy, and the Palomar DSS provides an additional observation, there are several instances where the brightness of the system can be verified to be different, signifying either outbursts (in the case of dwarf novae) or high vs low states for nova-like objects. To distinguish these cases requires spectra at the high and low brightness states.
In the case of SDSS1637, the SDSS photometry reveals a bright source (=16.6) while the spectra are consistent with a 20th mag object. In addition, the SDSS photometry reveals two close (but separated) stars, the northern object being the bright one, while the DSS shows it fainter than its southern neighbor. This fact is consistent with the northern object being caught at an outburst during the SDSS photometry. Several random followup spectra at APO (Table 3) and other quick-look images during the course of 3 months all found the system at its quiescent state so the outbursts are likely infrequent or of short duration. As the quiescent spectra show none of the high excitation lines of a novalike system, this object is very likely a dwarf nova.
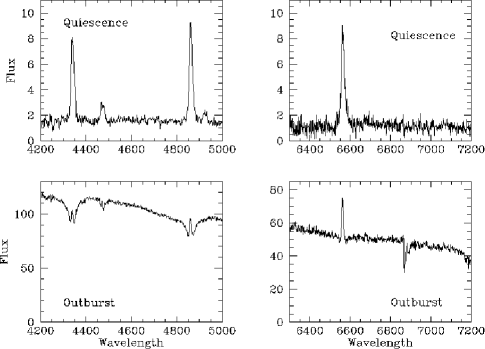
In two instances (SDSS1730 and SDSS2303), the APO spectra revealed objects undergoing a dwarf nova outburst, during which the Balmer emission lines turned into absorption lines when the systems were several magnitudes brighter than quiescence. On 2000 October 2, we obtained a total of 20 time-resolved spectra of SDSS1730 at outburst and two spectra, three nights later, when the system was at quiescence. Figure 3 shows typical outburst spectra and the smoothed mean of the 2 quiescent spectra for the blue and red wavelength regions. At outburst, the overall flux increased by a factor of 20 in the blue and 4 in the red, with noticeable, broad absorption features surrounding the H and H emission lines. Figure 4 shows a closeup of the H line throughout the orbit. While inspection of the line suggests the possible presence of a narrow component passing from blue (phase 0.48) to red (phase 0.57), careful analysis of the velocity of the peak component did not produce an unambiguous feature which could be associated with the orbital period.
The presence of the underlying absorption features at H and H in SDSS1730 made it difficult to obtain radial velocities for these two lines, and a reliable solution was obtained only for the H data. We obtained values for the central peak of the H line by using IRAF’s 222IRAF (Image Reduction and Analysis Facility) is distributed by the National Optical Astronomy Observatories, which are operated by AURA, Inc., under cooperative agreement with the national Science Foundation. fitting routines in splot. As the line shows a fair amount of structure at outburst, the centroid “e” method returned more consistent answers than did Gaussian fitting. An IDL routine, CURVEFIT, was used to fit the radial velocities with a sinusoidal function of the form , where (systemic velocity), (semi-amplitude), (orbital period) and (time of conjunction) were left as free parameters (see Table 4 for the best fit parameters). Figure 5 shows the best fit to the H radial velocity curve. Four spectra showed extreme deviations and were not included in the fitting, and are indicated in Figure 5 as open circles. We studied these spectra for evidence of shifts in the lines and for other potential sources of error, but were unable to detect any cause. Nevertheless, they provided velocities which were clearly inconsistent with the rest of our measurements. The velocities for these 4 spectra shown in Figure 5 are from measurements of the midpoint of the extremes of the H line done by eye. We tested our fitting program while including these spectra, and found that the best fit obtained for the orbital period (1175 min) was consistent with the fit excluding these points.
Finally, we used the period obtained from the spectra to look for evidence of variability in the photometry of this system obtained at MRO. We folded the differential magnitudes on each of the two longest nights on the orbital period but found no evidence for any significant orbital variability. An average of the two nights’ data produces an upper limit for any such variability of 0.04 magnitudes. The absence of variability, along with the lack of line doubling, suggests that SDSS1730 is a system with a fairly low inclination (Warner 1995).
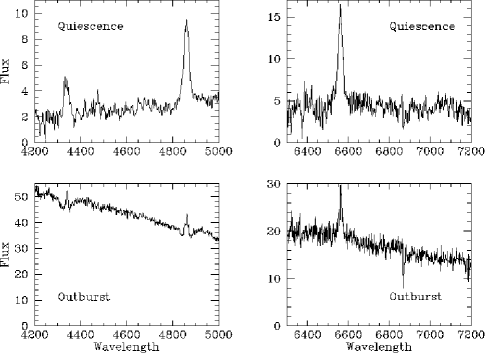
For SDSS2303, we obtained a total of 9 time-resolved spectra at quiescence on 2000 October 2 and 11 spectra at outburst 3 nights later. Figure 6 shows typical outburst and quiescent spectra for both nights. At outburst, the overall flux increases by a factor of 120 in the blue and 60 in the red with broad absorption features surrounding the H and H emission lines.
We obtained the velocities for the H and H emission lines by using the IRAF fitting routines, with the Gaussian fitting routine “k” providing the best fit to a velocity curve (lowest residuals). Once again, the CURVEFIT routine was used to fit the radial velocity data with a sinusoidal function. The lines of H and from the quiescent data provided the most consistent solutions with the lowest errors. These solutions are given in Table 4 and the fit to the velocity curve for H is shown in Figure 7. The outburst data resulted in consistent period and velocity curves. Using the best fit period of 100 min, the phases for H were computed with the time of the red-to-blue crossing of the emission lines for H as phase zero. The absence of any eclipse during quiscence or outburst suggests that SDSS2303 is a system with a fairly low inclination.
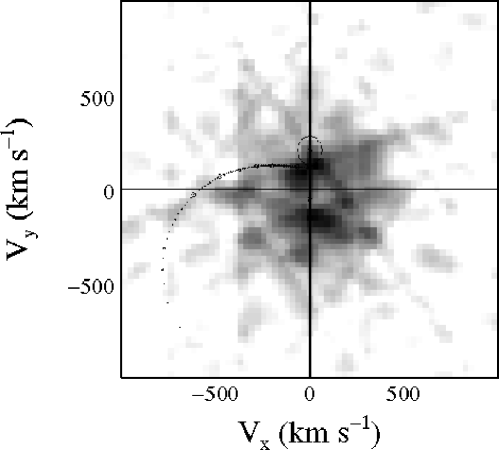
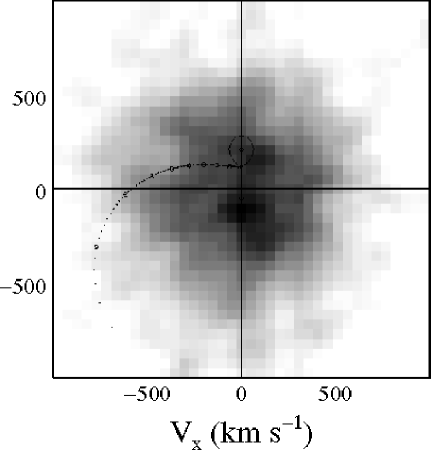
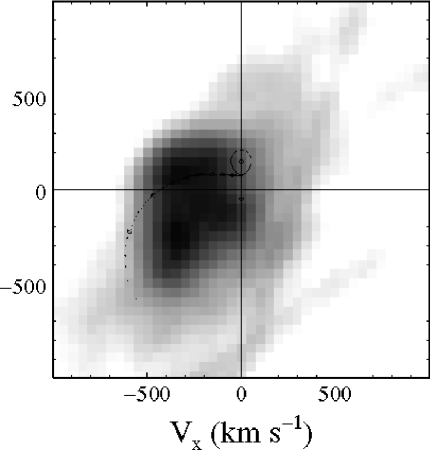
To obtain further information about the disk at quiescence, we computed a doppler tomogram. Doppler tomography (Horne 1991) is a technique that allows imaging of the line-forming regions in a binary system by combining the velocity profile information obtained at all binary phases. To construct our tomogram, we used the Fourier-filtered back-projection program provided by Keith Horne and modified for our computers and plotting needs by Donald Hoard. As we have no fiducial phasing from an eclipse or lines from the secondary, we used the phasing from the red to blue crossing of the H line solution (Table 4) at quiescence. This assumes that the emission lines originate near the white dwarf and that zero phase is inferior conjunction of the secondary. Figure 8 shows the tomograms for H and H with a mass ratio of used to compute the Roche lobe and stream. While a phase resolution of 0.1 is not suitable to determine any detailed disk structure, it can provide information on the disk extent and the stream. The tomograms of SDSS2303 are consistent with a low mass-transfer rate system with minimal disk emission and no evidence for a luminous hot spot near the stream location. There is some evidence for emission regions near the locations of the secondary (Vy=+150, Vx=0) and of the white dwarf (Vy=-150, Vx=0), but better data are required to confirm this.
3.4 Nova-likes with Strong HeII
The 3 systems SDSS0155, SDSS0729 and SDSS0747 reveal strong emission in HeII 4686. While SDSS0729 is very faint and has very narrow lines, indicative of a low mass-transfer rate (possibly a magnetic) system, SDSS0747 shows the bright blue continuum and weak Balmer emission of an old nova with a high accretion rate.
The system SDSS0155 caught our attention for further study as the SDSS photometry and spectra indicated a very bright object, but the Palomar DSS showed a much fainter star. The presence of strong emission at the bright state, combined with the presence of HeII, suggests either an AM Her system with a magnetic white dwarf or a high accretion rate SW Sex star (characteristics of these types of CVs are reviewed by Warner 1995).
Our followup spectroscopy at APO, one month after the SDSS spectrum, showed the system also in its high state. Time-resolved spectra throughout 3 hours showed asymmetries and narrow component structure in the Balmer emission lines. Most important, an eclipse of the Balmer lines was evident (Figure 9). When this occurred, the Balmer and HeI lines went into absorption while HeII remained visible but weaker, and the continuum did not appear to be eclipsed. This is opposite to the behavior typically seen in an eclipsing SW Sex system (e.g. BH Lyn, Hoard & Szkody 1997) where the HeII line (usually originating near the white dwarf) is deeply eclipsed along with the continuum light, while the Balmer emission lines (from the outer disk area) remain largely visible through the eclipse. Unfortunately, rising humidity levels necessitated a dome closure which caused a 70 min gap in the data sequence. The datasets before and after the dome closure cover intervals of 100 min and 60 min respectively.
Despite the gap, the velocities show a large and repetitive variation, allowing the determination of the orbital period to be 87 min. This short period also argues against an interpretation as an SW Sex system since those objects usually have orbital periods between 3-4 hrs. The best fit to the radial velocity curve for HeII is shown in Figure 10 and the solutions are given in Table 4 for that line as well as H and H. The very large (400 km/s) semi-amplitude of the velocity curves of SDSS0155 compared to the other disk systems in Table 4 is typical of AM Her systems (Warner 1995) and strengthens the case for a magnetic interpretation for SDSS0155.
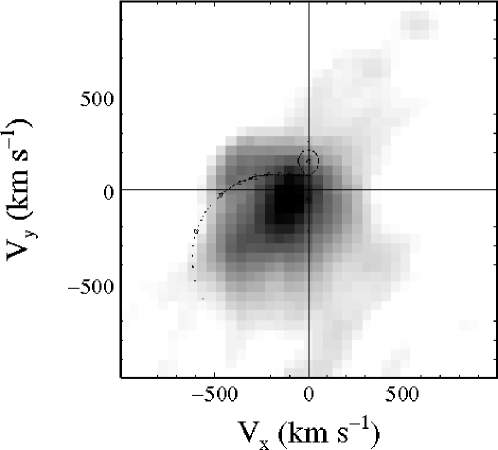
Using the convention of the red to blue crossing of the HeII line as phase zero, the eclipse of the lines occurs at phase 0.7, which is maximum redshift. The most reasonable explanation for the lack of continuum eclipse is that the eclipse is of a line-forming area in a magnetic CV system. Because the lines are affected through more than one 10 minute exposure, the area must be larger than just a spot on the white dwarf. The emission region may be eclipsed by the secondary or self-eclipsed by the white dwarf. To test the geometry further, we constructed tomograms for the HeII and H lines, trying a phasing based on a zero of the red to blue crossing of the HeII line (if its origin were on the white dwarf) and, alternatively, considering zero phase to be the eclipse. Figure 11 shows the results for the phasing of red-blue crossing, which produced tomograms that are consistent with those of AM Her stars (Hoard 1999, Schwope et al. 1999) with the brightest emission zones associated with the magnetic settling region (lower left quadrant) and the ballistic stream as drawn for a mass ratio of 1/3. Unfortunately, the usual prominent areas due to the white dwarf and the irradiated secondary are not apparent and so the actual phasing is ambiguous. Data obtained during a low state should allow the absolute phasing to be determined by using the velocities of spectral lines from both the secondary star and the white dwarf.
3.5 Systems Showing the Secondary Star
Inspection of the spectra of Figure 2 shows that there are two systems which have spectral signatures of the secondary. SDSS0813 shows the spectrum of a K5-M0 star (Mg band near 5200Å and TiO at 7100Å), similar to the long period system TT Crt (Szkody et al. 1992). Thus, SDSS0813 is likely to also have a long orbital period. The other system, SDSS0816, also shows evidence for the TiO band at 7100Å. The appearance of these features indicates a relatively low contribution of the accretion disk and hence, a low mass-transfer rate system.
3.6 ROSAT, 2MASS and LONEOS Correlations
The newly identified CVs were cross-checked against the X-ray ROSAT All Sky Survey (RASS; Voges et al. 1999, 2000), the infrared Two Micron All Sky Survey (2MASS), and the optical Lowell Observatory Near Earth Object Survey (LONEOS; Rest et. al. 2001).
Besides the previously known bright system that is a known X-ray source (SW UMa; Shafter, Szkody & Thorstensen 1986), 5 of the new CVs are detected in the RASS bandpass of 0.1-2.4 keV. Table 5 lists the X-ray count rates of these 5 sources. The two objects identified as dwarf novae (SDSS1730 and SDSS2303) are both detected, as well as the system with strong HeII that is likely to be magnetic (SDSS0155). As about half the known dwarf novae are detected by the RASS (Verbunt et al. 1997; V97), it is not so surprising that SDSS1730 and SDSS2303 are detected. However, it is unusual that the RASS count rates are identical for these two systems, while their optical fluxes differ by 3 mags. Since V97 found that a higher accretion rate corresponds to a lower X-ray to optical flux ratio, this would argue that the fainter system SDSS2303 has the lower accretion rate (consistent with its shorter orbital period) compared to SDSS1730, and that the lower optical flux is not just due to a greater distance for SDSS2303 than SDSS1730. In addition, it is remarkable that the two dwarf novae are brighter than the likely magnetic system SDSS0155, as V97 and others have found that magnetic systems stand out as the brightest soft X-ray sources among CVs. However, this can be explained if SDSS0155 was in a low state of mass accretion at the time of the RASS observations. We searched the existing X-ray data on the objects in Table 5 for any evidence of time variability and found a result only for SDSS0233. In this case, the long pointing revealed variability of at least a factor of 4 on a time-scale of 500 sec. However, the low statistics and sampling do not allow any conclusion about periodicity.
Table 6 lists the 2MASS detections among the 19 new CVs (the known system SW UMa is also detected). The bright dwarf nova SDSS1730 is among the detections and shows IR colors typical of accretion disks (Szkody 1985). The system showing a K-M dwarf secondary in the SDSS spectrum (SDSS0813) is also detected and has red colors consistent with a K star. SDSS1712 appears to have red colors (also evident in the optical; Table 1) but does not show any spectral features from a late secondary (Figure 2). Thus, this faint object may be at a large distance and/or may have significant reddening.
While the primary targets of the LONEOS project are moving objects, the existing database of a large fraction of the sky imaged in multiple epochs, and calibrated to USNO-A2.0 red magnitudes, provides a good resource for time-variable objects such as CVs. We searched the LONEOS database for our new SDSS CVs and found observations for the objects listed in Table 7 (data on the known system BH Lyn also exist). This table summarizes the range of variability evident along with the number of measurements made and the number of nights on which observations were obtained. Two of the four objects show evidence of large variability (more than one magnitude). The dwarf nova SDSS2303 was near quiescence on 2 of the 6 measurements and at brighter magnitudes on the other 4 observations. Considering that 1 of our 2 APO measurements was also at outburst, the outburst timescale for this dwarf nova is likely to be very short. The other object showing large variablility is the eclipsing, likely magnetic, system SDSS0155. This objects shows one mag variations among observations obtained on a single night (likely due to the eclipse), as well as 3 mag variations in observations separated by months (likely due to high and low states of mass transfer). The LONEOS database can ultimately be matched to the SDSS photometric fields to help identify new CV candidates by their variability.
4 Conclusions
The commissioning year of SDSS operation has shown that a wide variety of interesting CVs may be easily identified. Included among these are a few bright systems missed in past surveys as well as members of the fainter population that models predict. This year of partial operation has led to the discovery of 19 new CVs and the recovery of 3 known systems. While the objects fainter than 20th mag at short orbital periods will need their orbital characteristics determined by 8-10m class telescopes, the 15-19th mag ones can be followed-up with 4m class or smaller apertures. Using sporadic and time-resolved data, we have been able to identify two dwarf novae and one interesting, high excitation, eclipsing system that is likely to be a magnetic CV. The fact that the orbital periods of these 3 systems are all short (under 2 hrs), and that more than half of all the CVs found have large H equivalent widths, argue that we are finding lower accretion-rate systems compared to previous surveys. These preliminary results show that the SDSS will be highly successful at identifying new CVs of a variety of types, with at least 400 total expected from the completed survey. Most of these should be faint, low accretion-rate systems, which will provide insight into the nature and numbers of the true CV population in our galaxy.
References
- (1) Downes, R. A., Webbink, R. F. Shara, M. M., Ritter, H., Kolb, U. & Düerbeck, H. W. 2001, PASP, 113, 764
- (2) Fan, X. 1999, AJ, 117, 2528
- (3) Fukugita, M., Ichikawa, T., Gunn, J. E., Doi, M., Shimasaku, K. & Schneider, D. P. 1996, AJ, 111, 1748
- (4) Green, R. F., Ferguson, D. H., Liebert, J. & Schmidt, M. 1982, PASP, 94, 560.
- (5) Gunn, J. E. et al. 1998, AJ, 116, 3040
- (6) Hoard, D. W. 1999, ASP Conf. Ser. 157, 1999
- (7) Hoard, D. W. & Szkody, P. 1997, ApJ, 481, 433
- (8) Horne, K. 1991, in Fundamental Properties of Cataclysmic Variable Stars, ed. A. Shafter (San Diego:SDSU), 23
- (9) Howell, S. B., Rappaport, S. & Politano, M. 1997, MNRAS, 287, 929
- (10) Krisciunas, K., Margon, B. & Szkody, P. 1998, PASP, 110, 1342
- (11) Lupton, R. H., Gunn, J. E. & Szalay, A. 1999, AJ, 118, 1406
- (12) Lupton, R. H., Gunn, J. E., Ivezic, Z., Knapp, G. R., Kent, S. M. & Yasuda, N. 2002, ASP Conf. Ser. 238, in press (astro-ph/0101420)
- (13) Patterson, J. 1984, ApJS, 54, 443
- (14) Raymond, S., Szkody, P. & Hawley, S. L. 2001, Cool Stars 12 Conf. Proc. in press
- (15) Rest, A., Miknaitis, G., Miceli, A. & Stubbs, C. 2001, in preparation
- (16) Ritter, H. & Kolb, U. 1998, A&AS, 129, 83
- (17) Schwope, A. D., Schwarz, R., Staude, A., Heerlein, C., Horne, K. & Steeghs, D. 1999, ASP Conf. Ser. 157, 71
- (18) Shafter, A. W., Szkody, P. & Thorstensen, J. R. 1986, ApJ, 308, 765
- (19) Stoughton, C. et al. 2001, AJ, submitted
- (20) Szkody, P. 1985, in Cataclysmic Variables and Low-Mass X-ray Binaries, D. Q. Lamb and J. Patterson (eds), Reidel, 385
- (21) Szkody, P., Williams, R. E., Margon, B., Howell, S. B. & Mateo, M. 1992, ApJ, 387, 357
- (22) Vanmunster, T., Velthuis, F. & McCormick, J. 2000, IBVS 4955
- (23) Verbunt, F., Bunk, W. H., Ritter, H. & Pfeffermann, E. 1997, A&A, 327, 602
- (24) Voges, W. et al. 1999, A&A, 349, 389
- (25) Voges, W. et al. 2000, IAUC 7432
- (26) Vogt, N. 1981, ApJ, 252, 653
- (27) Warner, B. in Cataclysmic Variable Stars, 1995, CUP
- (28) York, D. G. et al. 2000, AJ, 120, 1579
![[Uncaptioned image]](/html/astro-ph/0110291/assets/x2.png)
![[Uncaptioned image]](/html/astro-ph/0110291/assets/x3.png)


| SDSSp J | DatebbUT Date of spectrum (mm/dd/2000) | CommentsccDN is a dwarf nova, e is eclipsing, NL is a nova-like, H,L means shows high and low brightness states | |||||
|---|---|---|---|---|---|---|---|
| 015151.87140047.2 | 11/29 | 20.26 | 0.29 | 0.24 | 0.42 | 0.46 | high i |
| 015543.40002807.2* | 11/23 | 15.39 | 0.67 | 0.05 | 0.23 | 0.17 | H, L, HeII, e |
| 023322.61005059.5* | 10/03 | 19.94 | 0.30 | 0.26 | 0.25 | 0.01 | |
| 072910.68365838.3 | 11/29 | 20.38 | 0.07 | 0.34 | 0.26 | 0.05 | HeII |
| 074716.81424849.0 | 12/07 | 17.10 | 0.02 | 0.09 | 0.09 | 0.06 | NL, HeII |
| 081321.91452809.4 | 11/29 | 18.29 | 0.05 | 0.62 | 0.46 | 0.22 | long P, K-M sec |
| 081610.84453010.2 | 11/29 | 20.08 | 0.41 | 0.54 | 0.47 | 0.50 | M sec |
| 082236.05510524.6 | 12/04 | 15.34 | 0.02 | 0.15 | 0.02 | 0.01 | BH Lyn |
| 082409.73493124.4 | 11/21 | 19.28 | 0.39 | 0.44 | 0.16 | 0.16 | |
| 083642.80532838.1 | 12/05 | 16.87 | 0.03 | 0.06 | 0.07 | 0.14 | SW UMa |
| 083845.23491055.5 | 11/25 | 19.59 | 0.40 | 0.20 | 0.02 | 0.30 | |
| 125641.29015852.0 | 05/30 | 20.12 | 0.25 | 0.06 | 0.28 | 0.15 | |
| 143500.22004606.2* | 04/03ddThis object also had spectra obtained on 05/26 | 18.59 | 0.14 | 0.17 | 0.02 | 0.10 | Vir4 |
| 155531.99001055.0 | 05/28 | 19.36 | 0.26 | 0.23 | 0.06 | 0.31 | high i |
| 155644.24000950.2 | 05/29 | 18.05 | 0.24 | 0.12 | 0.24 | 0.44 | |
| 161033.64010223.3 | 05/26 | 19.07 | 0.19 | 0.02 | 0.13 | 0.13 | |
| 161332.56000331.0 | 05/29 | 18.63 | 0.01 | 0.66 | 0.52 | 0.31 | |
| 163722.21001957.1eeThe correct object is the northern one of a close pair | 05/07 | 16.56 | 0.15 | 0.05 | 0.14 | 0.08 | H, L |
| 171247.71604603.3*ffThe correct object is the southern one of a close pair | 05/31ggThis object also had spectra obtained on 08/24 | 19.95 | 0.92 | 0.91 | 0.59 | 0.45 | |
| 172601.96543230.7* | 09/26 | 20.52 | 0.26 | 0.04 | 0.02 | 0.02 | |
| 173008.38624754.7* | 05/30 | 15.92 | 0.10 | 0.25 | 0.11 | 0.00 | DN |
| 230351.64010651.0 | 09/05 | 19.05 | 0.38 | 0.30 | 0.06 | 0.26 | DN |
| SDSS | Plate-Fiber | H | H | H | He4471 | HeII4686 | |||||
|---|---|---|---|---|---|---|---|---|---|---|---|
| F | EW | F | EW | F | EW | F | EW | F | EW | ||
| 0151 | 430-430 | 0.9 | 15 | 1.7 | 36 | 2.6 | 77 | ||||
| 0155 | 403-423bbMeasurements from APO spectra as SDSS spectrum saturated | 59.7 | 10 | 63.4 | 11 | 37.8 | 13 | 12.2 | 2 | 44.5 | 8 |
| 0233 | 407-592 | 1.9 | 43 | 2.5 | 74 | 4.5 | 303 | 0.2 | 5 | ||
| 0729 | 431-316 | 0.5 | 17 | 0.6 | 24 | 0.8 | 35 | 0.07 | 3 | 0.5 | 19 |
| 0747 | 434-430 | 0.4 | 0.8 | 0.6 | 1.2 | 0.9 | 3.3 | 0.8 | 1.5 | ||
| 0813 | 439-582 | 1.6 | 15 | 1.9 | 14 | 2.8 | 15 | ||||
| 0816 | 439-624 | 3.5 | 43 | 3.8 | 53 | 5.3 | 91 | 0.9 | 12 | ||
| 0824 | 443-360 | 1.0 | 17 | 1.5 | 26 | 1.9 | 46 | ||||
| 0838 | 445-89 | 2.9 | 65 | 3.2 | 87 | 5.1 | 211 | 0.4 | 8 | ||
| 1256 | 338-382 | 0.4 | 11 | 0.4 | 14 | 0.7 | 52 | ||||
| 1435ccMeasured from spectrum on 04/03 | 306-4 | 2.9 | 19 | 2.5 | 23 | 4.4 | 64 | ||||
| 1435ddMeasured from spectrum on 05/26 | 306-20 | 22.4 | 59 | 18.3 | 66 | 19.0 | 105 | 3.9 | 11 | ||
| 1555 | 343-198 | 4.9 | 33 | 5.9 | 62 | 10.1 | 195 | 0.8 | 5.5 | ||
| 1556 | 344-315 | 1.7 | 6 | 2.8 | 14 | 6.2 | 62 | ||||
| 1610 | 345-138 | 0.9 | 5 | 1.9 | 16 | 5.1 | 86 | ||||
| 1613 | 346-263 | 5.1 | 11 | 5.4 | 14 | 8.3 | 27 | ||||
| 1637 | 348-103 | 2.6 | 80 | 3.0 | 129 | 3.4 | 186 | 0.6 | 21 | ||
| 1712 | 351-17 | 6.0 | 100 | 6.8 | 79 | 8.3 | 90 | 2.0 | 28 | 2.0 | 23 |
| 1726 | 357-51 | 1.4 | 56 | 1.6 | 94 | 1.3 | 158 | 0.3 | 13 | 0.25 | 12 |
| 1730 | 352-26 | 16.1 | 58 | 15.4 | 63 | 17.5 | 118 | 3.4 | 14 | 1.3 | 6 |
| 2303 | 380-575 | 2.8 | 52 | 3.3 | 74 | 5.1 | 193 | 0.5 | 10 | ||
| UT Date | SDSS | Site | Interval | Data Obtained |
|---|---|---|---|---|
| 05/06/00 | 1435 | APO | 0.3 hrs | 2 spectra at quiescence |
| 05/15/00 | 1435 | APO | 10 min | 1 spectrum at quiescence |
| 05/28/00 | 1637 | APO | 10 min | 1 spectrum at quiescence |
| 07/03/00 | 1637 | APO | 15 min | 1 spectrum at quiescence |
| 06/05/00 | 1730 | MRO | 5 hrs | V photometry |
| 06/16/00 | 1730 | MRO | 1.75 hrs | V photometry |
| 07/16/00 | 1730 | MRO | 2.4 hrs | V photometry |
| 08/07/00 | 1730 | MRO | 4.8 hrs | V photometry |
| 08/08/00 | 1730 | MRO | 7.2 hrs | B photometry |
| 08/25/00 | 1730 | MRO | 2 hrs | B photometry |
| 10/03/00 | 1730 | APO | 2.2 hrs | 20 spectra at outburst |
| 10/06/00 | 1730 | APO | 0.25 hr | 2 spectra at quiescence |
| 10/03/00 | 2303 | APO | 1.5 hrs | 9 spectra at quiescence |
| 10/06/00 | 2303 | APO | 1.9 hrs | 10 spectra at outburst |
| 12/29/00 | 0155 | APO | 3 hrs | 17 spectra at high state |
| 01/15/01 | 0747 | APO | 10 min | 1 spectrum at high state |
| SDSS | Line | P (min) | K (km/s) | |||
|---|---|---|---|---|---|---|
| 1730 | H | 1175 | 233 | 746 | 0.00.02 | 19 |
| 2303 | H | 10014 | 9.30.1 | 537 | 0.00.02 | 14 |
| 2303 | H | 100 | 55.40.1 | 495 | 0.110.02 | 9 |
| 0155 | H | 862 | 898 | 35929 | 0.090.01 | 64 |
| 0155 | H | 872 | 1355 | 40620 | 0.050.01 | 45 |
| 0155 | HeII4686 | 882 | 1534 | 40418 | 0.000.01 | 38 |
| SDSS | ROSAT (c/s)aaFor a 2 keV bremsstrahlung spectrum, 1 c/s corresponds to a 0.1-2.4 keV flux of about 7 ergs cm-2 s-1 | Exp (sec) | ObsbbS signifies a survey observation; P a pointed observation |
|---|---|---|---|
| 0155 | 0.040.01 | 394 | S |
| 0233 | 0.00580.0005 | 28220 | P |
| 0838 | 0.0170.003 | 4569 | P+S |
| 1730 | 0.0600.006 | 2644 | S |
| 2303 | 0.0610.015 | 348 | S |
| SDSS | J | H | K |
|---|---|---|---|
| 0747 | 16.590.13 | 16.310.22 | 15.5aaDetection only |
| 0813 | 15.990.09 | 15.300.09 | 15.190.13 |
| 1712 | 16.800.16 | 15.940.19 | 15.5aaDetection only |
| 1730 | 15.300.05 | 15.200.09 | 15.280.19 |
| SDSS | No.Obs | Days | Mag RangeaaCalibration from USNO-A2.0 red magnitudes | Error |
|---|---|---|---|---|
| 0155 | 21 | 8 | 14.7 - 17.6 | 0.05 |
| 0747 | 6 | 4 | 17.04 - 17.10 | 0.15 |
| 0824 | 7 | 2 | 17.60 - 17.75 | 0.1 |
| 2303 | 14 | 6 | 17.3 - 18.6 | 0.1 |