The XMM-Newton Serendipitous Survey
We present the first results on the identifications of a medium sensitivity survey (X-ray flux limit in the 0.5-4.5 keV band) at high galactic latitude () carried out with the XMM-Newton X-ray observatory within the AXIS observing programme. This study is being conducted as part of the XMM-Newton Survey Science Centre activities towards the identification of the sources in the X-ray serendipitous sky survey. The sample contains 29 X-ray sources in a solid angle of (source density sources ), out of which 27 (93%) have been identified. The majority of the sources are broad-line AGN (19), followed by narrow emission line X-ray emitting galaxies (6, all of which turn out to be AGN), 1 nearby non-emission line galaxy (NGC 4291) and 1 active coronal star. Among the identified sources we find 2 broad-absorption line QSOs ( and ), which constitute 10% of the AGN population at this flux level, similar to optically selected samples. Identifications of a further 10 X-ray sources fainter than our survey limit are also presented.
Key Words.:
X-rays:general, galaxies, stars; Galaxies: active1 Introduction
The XMM-Newton observatory, the second cornerstone of the Horizon 2000 science programme of the European Space Agency has been carrying out science operations since early 2000. Thanks to its high collecting area, large field of view and moderate angular and spectral resolution XMM-Newton is the most powerful observatory in hard X-rays (photon energy keV), opening an almost unexplored window to the Universe (Jansen et al. 2001). The sensitivity to hard X-rays (not attained by previous missions like and ) allows the detection and study of the most energetic objects in the Universe (Active Galactic Nuclei - AGN), most of which are believed to be deeply hidden inside large amounts of absorbing gas and inconspicuous at virtually all other wavelengths.
During science observations (with exposure time over ks) with the EPIC cameras operating in “Full Frame” mode (Turner et al. 2001; Strüder et al. 2001) XMM-Newton is discovering new X-ray sources, which add to the XMM-Newton serendipitous survey at an expected rate of new sources per year. The XMM-Newton Survey Science Centre (SSC) was appointed by ESA to exploit scientifically the XMM-Newton serendipitous survey for the benefit of the scientific community and as a major legacy of XMM-Newton to future generations. This is being tackled by the SSC consortium in terms of a mostly ground-based optical follow-up and identification (XID) programme.
The XID programme has been described in detail in Watson et al. (2001). Briefly, its implementation has been divided into two parts: a core programme which will identify – spectroscopically – significant samples of sources at X-ray flux limits around (bright sample), (medium sample) and (faint sample) covering a range of galactic latitudes, and an imaging programme aiming at providing deep optical/infrared images in several colours of a large number of XMM-Newton fields to facilitate statistical identifications of the serendipitous sources.
AXIS (“An XMM-Newton International Survey”)111See http://www.ifca.unican.es/~xray/AXIS forms the backbone of the XID programme by providing the ground-based resources that are essential for the exploitation of the XMM-Newton serendipitous sky survey. Besides making a first and major contribution to the XID programme, AXIS will define the quality standard and will guide future steps in the implementation of the XID programme. AXIS has been conceived and designed to make optimal use of the available instrumentation on the telescopes of the Observatorio del Roque de los Muchachos. AXIS has been awarded a total of 85 observing nights spread over the period April 2000 - April 2002 on the 4 larger telescopes of the Observatorio del Roque de Los Muchachos: the 2.5m Isaac Newton Telescope (INT), the 2.5m Nordic Optical Telescope (NOT), the 3.5m Telescopio Nazionale Galileo (TNG) and the 4.2m William Herschel Telescope (WHT).

In this paper we report on the first results obtained in the AXIS medium sensitivity survey at high galactic latitude. X-ray sources serendipitously found in two XMM-Newton observations (field names G133-69 Pos_2 and Mkn 205) have been studied and followed up down to a 0.5-4.5 keV flux of . The survey reaches a source density in excess of 100 sources , which is appropriate for spectrocopic follow up using fibre spectroscopy. Our survey is therefore shallower than the XMM-Newton Lockman Hole survey (Hasinger et al. 2001) and the deep surveys (Mushotzky et al. 2000; Barger et al. 2001; Giacconi et al. 2001). The surface density reached is, however, similar to that of the so-called Rosat Deep Survey (Boyle et al. 1994) and deeper than the survey (Mason et al. 2000).
Although we are still dealing with a small number of sources (29) the sample presented here provides a flavour of the dominant X-ray source populations at high galactic latitude down to that flux level. The paper also describes the observational techniques that we are following in the AXIS project to build up larger source catalogues at various flux levels and galactic latitudes.
2 The X-ray data
2.1 XMM-Newton observations
The identifications presented in this paper correspond to X-ray sources serendipitously found in 2 XMM-Newton images (G133-69 Pos_2 and Mkn 205). G133-69 Pos_2 was observed as a Guaranteed Time observation to probe the galactic halo using X-ray shadows. It consists of a single data set totalling 16 ks of good exposure time in full frame mode. The Mkn 205 field was observed as a calibration observation, and consists of 3 exposures of 17 ks each. One of these is in large-window mode (for the EPIC pn camera) which only covers half of the field of view. The remaining 2 data sets are in full window mode, and we merged them. One of these was free of particle background flares, but the other one was strongly contaminated and only ks of it survived the cleaning process. Details of the X-ray observations are reported in Table 1.
| Target | G133-69 Pos_2 | Mkn 205 |
|---|---|---|
| Observation date | 03-07-2000 | 06-05-2000 |
| XMM-Newton Obsid | 0112650501 | 0124110101 |
| RA(J2000) | 01:04:00 | 12:21:44 |
| DEC(J2000) | -06:42:00 | 75:18:37 |
| -69.35 | +41.67 | |
| Clean exposure time (ks)a | 15.86 | 18.97 |
| pn Filter | Thin | Medium |
| Conversion factorb |
a This corresponds to the maximum of the exposure map in the pn image
b The conversion factor is the ratio between flux in and pn count rate, both in the 0.5-4.5 keV band.
Both of these observations have been processed through the pipeline processing system222See http://xmmssc-www.star.le.ac.uk (Watson et al. 2001), using tasks from the XMM-Newton Science Analysis Software (SAS) v5.1. Subsequent analyses were also performed using the same version of the SAS. All event patterns (single, double and triple) were kept when constructing the event files. This provides maximum sensitivity at high photon energies but the fraction of non-X-ray events rejected is consequently smaller. When flaring intervals are removed from the event lists, higher S/N is usually achieved by keeping all patterns.
The pipeline processing source searching procedure has been adopted. We now sketch briefly its main features. We have used data from EPIC-pn because its sensitivity is double that of the invidual EPIC-MOS detectors. Images were extracted in the following 4 spectral bands: 0.5-2 keV, 2-4.5 keV, 4.5-7.5 keV and 7.5-10 keV. Exposure maps, which account for vignetting, CCD gaps, bad columns and bad pixels, were constructed for each band. The combination of the 4 images was used to search for sources with an overall likelihood above 16. This corresponds to a probability of a source being spurious of , i.e., up to one spurious detection per image with that likelihood.

First, a simple sliding box algorithm was applied to mask out the brightest sources and to spline-fit the background in each CCD chip. The sliding box algorithm was applied again to search for sources significant against the fitted background. Finally a maximum likelihood fit of the source profiles to the images, simultaneous to all bands, was performed to produce a final source list with exposure corrected count rates in each band. Sources were sorted in terms of the flux in the 0.5-4.5 keV flux. Table 1 lists the countrate to flux conversion factors for both fields which we derived assuming a standard power law absorbed by the galactic column. Fluxes are corrected for galactic absorption. We experimented with variations in the spectral shape of the sources and found changes of up to 15% only in the conversion factor when varying the spectral index from to . That was expected as the 0.5-4.5 keV band was selected because of the fairly flat sensitivity of XMM-Newton accross the whole band. As there are still issues regarding the processing and calibration of EPIC data (out-of-time events, multiple pattern events, etc.), our listed fluxes have to be understood modulo these uncertainties.
For each 0.5-4.5 keV image we also extracted a sensitivity map (using the SAS task esensmap) showing the minimum count rate that a point source must have to be detectable by the algorithm used, at every position of the detector. We choose a likelihood limit of 10 (as opposed to 16) since we are dealing with a single band. This gives a probability for a spurious detection in a single band (again spurious detection per image), similar to the multi-band source search. This map takes into account vignetting, inter-CCD gaps and bad pixels and columns. We then computed the total solid angle where a source brighter than any given flux limit would have been detected. In the case of the Mkn 205 we further excluded a circle of radius 2 arcmin around the target. The field also happens to contain an extended source which we identified as the galaxy NGC 4291. The extent of this X-ray source effectively masks out a circle of 1.5 arcmin radius around it where the much enhanced background due to extended X-ray emission prevents us from detecting any further X-ray sources. We therefore included this galaxy as a serendipitous source in our survey but ignored any other possible sources within a circle of 1.5 arcmin radius around it. Fig. 1 shows the solid angle surveyed at each flux level. At , which is our survey limit, we have surveyed 0.26 .
2.2 X-ray sources
The source-searching algorithms produced a number of sources in each field (37 and 52 in the G133-69 Pos_2 and Mkn 205 data respectively), some as faint as (all fluxes refer to the 0.5-4.5 keV band). The faintest of these sources have likelihood detections very close to our threshold. When truncating at a flux of a total of 12 and 17 X-ray sources were found in the G133-69 Pos_2 and Mkn 205 fields respectively. Two sources in the Mkn 205 field whose positions fall in CCD gaps have already been excluded from the list. The sensivity of both fields was clearly enough to ensure completeness at that flux level, i.e., sources significantly fainter than our survey limit were detected in each field. Care was taken to visually screen the source lists in order to clean it from artifacts derived from the proximity of inter-CCD gaps, bad columns or other cosmetic effects.
The X-ray source list was then astrometrically corrected. The pipeline-processed data provides astrometry drawn from the attitude and orbit control system (AOCS), which we believe to be good to within a few arcsec. To further improve that, we cross-correlated the source positions of the X-ray sources obtained with a list of optical sources obtained from the i’-band images (see Sect. 3.1) using the SAS task eposcorr. To this goal, we used all detected X-ray sources and all detected optical sources in the field to maximize the number of matches. The situation is summarized in Table 2, were we show that significant astrometric shifts were still present in both data sets. One point that needs stressing is that the number of X-ray to optical matches is much larger when we use the full catalogue of optical sources obtained in our wide-field images than if we used, e.g., the USNO A2 (Monet et al. 1998) catalogued sources. In that case we would be restricted to matches per field, with the corresponding uncertainty in the astrometric correction parameters. We further discuss the accuracy of the astrometric solution in the X-ray images in Sect. 5.1. Table 3 lists the X-ray sources brighter than our survey limit with the astrometrically corrected positions.
| Field | Rotation () | ||
|---|---|---|---|
| Mkn 205 | |||
| G133-69 Pos_2 |
In order to gain X-ray spectral information on the X-ray sources, we used the count rates in individual bands to construct the following hardness ratios:
and
Note that these are computed using the exposure-map corrected count-rates, so that energy dependent vignetting is approximately corrected. All sources in the sample selected here had positive count rates in all bands.Also, note that the typical number of counts per source is fairly small and therefore a detailed individual spectral analysis of each source is difficult and beyond the scope of this paper. Table 3 contains the basic X-ray data on these sources.
| Source name | RA (J2000) | DEC (J2000) | Perrb | Fluxc | Comments | ||
|---|---|---|---|---|---|---|---|
| XMMU J010316.7-065137 | 01:03:16.72 | -06:51:37.28 | 1.99 | ||||
| XMMU J010327.3-064643 | 01:03:27.30 | -06:46:43.69 | 0.80 | Close to pn noisy column | |||
| XMMU J010328.7-064633 | 01:03:28.71 | -06:46:33.34 | 1.30 | Close to pn noisy column | |||
| XMMU J010333.8-064016 | 01:03:33.86 | -06:40:16.07 | 0.82 | ||||
| XMMU J010339.8-065224 | 01:03:39.87 | -06:52:24.74 | 0.96 | ||||
| XMMU J010355.6-063710 | 01:03:55.62 | -06:37:10.48 | 0.82 | ||||
| XMMU J010400.9-064949 | 01:04:00.96 | -06:49:49.37 | 0.96 | ||||
| XMMU J010410.5-063926 | 01:04:10.56 | -06:39:26.46 | 0.62 | ||||
| XMMU J010420.9-064701 | 01:04:20.91 | -06:47:01.46 | 0.89 | ||||
| XMMU J010430.1-064456 | 01:04:30.13 | -06:44:56.07 | 0.72 | ||||
| XMMU J010437.5-064739 | 01:04:37.56 | -06:47:39.29 | 1.15 | ||||
| XMMU J010444.6-064833 | 01:04:44.68 | -06:48:33.42 | 1.16 | ||||
| XMMU J121819.4+751919 | 12:18:19.48 | +75:19:19.61 | 1.29 | ||||
| XMMU J122017.9+752212 | 12:20:17.98 | +75:22:12.17 | 0.28 | Extendedd | |||
| XMMU J122048.4+751804 | 12:20:48.43 | +75:18:04.10 | 0.69 | ||||
| XMMU J122051.4+752821 | 12:20:51.45 | +75:28:21.84 | 1.26 | ||||
| XMMU J122052.0+750529 | 12:20:52.02 | +75:05:29.44 | 0.40 | ||||
| XMMU J122111.2+751117 | 12:21:11.29 | +75:11:17.19 | 0.54 | ||||
| XMMU J122120.5+751616 | 12:21:20.56 | +75:16:16.10 | 0.57 | ||||
| XMMU J122135.5+750914 | 12:21:35.59 | +75:09:14.28 | 0.63 | ||||
| XMMU J122143.8+752235 | 12:21:43.88 | +75:22:35.32 | 0.77 | ||||
| XMMU J122206.4+752613 | 12:22:06.48 | +75:26:13.78 | 0.21 | ||||
| XMMU J122242.6+751434 | 12:22:42.69 | +75:14:34.96 | 0.75 | Close to pn CCD gap | |||
| XMMU J122258.1+751934 | 12:22:58.11 | +75:19:34.31 | 0.55 | Close to pn CCD gap | |||
| XMMU J122318.5+751504 | 12:23:18.58 | +75:15:04.08 | 0.55 | ||||
| XMMU J122344.7+751922 | 12:23:44.79 | +75:19:22.18 | 0.60 | ||||
| XMMU J122351.0+752227 | 12:23:51.02 | +75:22:27.99 | 0.36 | ||||
| XMMU J122435.7+750812 | 12:24:35.77 | +75:08:12.02 | 1.36 | ||||
| XMMU J122445.5+752224 | 12:24:45.53 | +75:22:24.80 | 0.88 |
Notes to Table: a Position of the X-ray source after astrometric correction; b Position error in arcsec (statistical only); c Flux in the 0.5-4.5 keV band in units of ; d The flux for this source has been estimated from aperture photometry.
In Fig. 2 we plot the integrated source counts derived from this survey. The source density at the survey limit is sources . This curve is to be compared with the source counts (Hasinger et al. 1998) which we converted to our 0.5-4.5 keV band by using a spectrum which is consistent with the average value of (see below). Our source counts are higher than the ones at the survey limit. Choosing a conversion factor corresponding to a power-law with spectral index just brings the curve up by , still significantly below our source counts.
We also compare the source counts with those derived in the 2-10 keV from ASCA (Ueda et al. 1999) and (Mushotzky et al. 2000). Note that the Baldi et al. (2001) source counts, based on XMM-Newton data, are consistent with these earlier work. Here a conversion factor for has been applied, which is consistent with the value of (see below). Our source counts fall modestly below (17%, only sigma significant) those in the harder band at the survey limit. It is clear that by selecting in the 0.5-4.5 keV band we find a large fraction of the sources that missed, but we may still be missing a small fraction of the hard sources detected in the 2-10 keV band.
Fig. 3 shows the hardness ratios for the sources as a function of flux. We must caution that although the two fields under consideration have different Galactic absorbing columns and furthermore have been observed with different EPIC-pn filters (thin and medium, see Table 1), the effect of both of these facts on the hardness ratios (particularly ) is completely negligible. No obvious trend of the source spectra is seen with source flux. The so-called spectral paradox (Fabian & Barcons 1992), i.e., the source’s spectra being steeper than the X-ray background spectrum (), is therefore not obviously solved at this flux level, i.e., we do not find a significant sample of sources that have an X-ray spectrum close to that of the X-ray background. This is also revealed by the histograms of and which are shown in fig. 4 together with the expected values for various power laws with galactic absorption. The weighted averages of the hardness ratios are and , consistent with a fairly steep X-ray spectrum (). Further details on the X-ray spectra of the different source classes are given in Sect. 5.2.


3 Optical observations
3.1 Imaging
Both target fields were observed with the Wide-Field Camera (WFC) on the 2.5m INT telescope in dark time. Table 4 summarizes the main features of the images obtained. The WFC covers virtually all the field of view of EPIC, if centered optimally. In our case, all sources listed in Table 3 were imaged.
| Target | Mkn 205 | G133-69 Pos_2 |
|---|---|---|
| Observation date | 30-04-2000 | 25/26-07-2000 |
| Seeing (arcsec in i’) | 1.5 | 1.1 |
| i’ limiting magnitude | 22.1 | 23.0 |
| u exposure time (s) | 600 | - |
| g’ exposure time (s) | 600 | 600 |
| r’ exposure time (s) | 600 | 600 |
| i’ exposure time (s) | 1200 | 1200 |
| Z exposure time (s) | 1200 | 1200 |
The WFC images were reduced using standard techniques including de-bias, non-linearity correction, flat fielding and fringe correction (in i’ and Z). Bias frames and twilight flats obtained during the same observing nights were used, but for the fringe correction contemporaneous archival i’ and Z fringe frames were utilised. Information on the WFC pipeline procedures, which performs all these steps can be found under the Cambridge Astronomy Survey Unit333http://www.ast.cam.ac.uk/~wfcsur (CASU) web pages.
The photometric calibration was performed by assuming average extinction constants and archival zero-point constants obtained routinely with the WFC, rather than measuring both from photometric standards.
Astrometric calibration was performed in two different ways. First a 12 parameter plate solution was applied to each one of the 4 CCDs of the WFC independently, by matching sources found in the image to USNO source positions. Residuals were typically found to be of the order of 0.3 arcsec for matched sources. A second astrometric calibration (along the lines of the WFC survey) was performed by a simple 6 parameter plate solution over the whole 4-CCD image, but taking into account the previously calibrated telescope distortion cubic term. In this case the sources found were matched to APM source positions with similar residuals. We found the position of the candidate counterparts to X-ray sources to be consistent in both methods to within arcsec.
3.2 Selection of candidate counterparts
In order to search for candidate counterparts of the X-ray sources, we have used the i’-band WFC image. Optical source lists for these images have been constructed by using the Sextractor algorithm (Bertin & Arnouts 1996). Sources were recorded if a minimum number of 10 connected pixels (of 0.33 arcsec) lay above 2 standard deviations of the background. Indeed some very faint sources escaped this detection algorithm, but the impact on the search for candidate counterparts was very limited.
Counterparts for the X-ray sources were searched for in the optical image lists. Candidate counterparts had to be either within the 5 statistical error or within 5 arcsec from the position of the X-ray source. This last criterion was used to accommodate any residual systematics in the astrometric calibration of the X-ray EPIC images.
The result of this search was very encouraging. Out of the 29 X-ray sources, 24 showed a single candidate counterpart, 4 showed two candidate counterparts and the remaining source showed no or very faint candidate counterpart in the i’-band image. The two basic conclusions to extract from this are that the selection of filter and depth of the images are appropriate to this sample and that the X-ray positional errors provided by XMM-Newton are good enough to single out a unique counterpart for the vast majority of the high-galactic latitude sources.
3.3 Spectroscopic observations
Candidate counterparts were spectroscopically observed with various spectrographs in order to identify the nature of the sources. Table 5 lists the relevant parameters of the spectroscopic instrumental setup used. At the source density we are dealing with () fibre spectrographs are likely to be the most efficient. However, we had a very limited amount of nights with this instrumentation and furthermore the fibres used were too large (2.7 arcsec diameter) to detect the faintest objects. Therefore a significant fraction of the sources were identified with long-slit spectrographs.
| Telescope | Instrument | Spectral | Slit width | Spectral | Comments |
|---|---|---|---|---|---|
| range (Å) | (arcsec) | resolutiona (Å) | |||
| WHT | AUTOFIB2/WYFFOS | 3900-7100 | 2.7b | 6-7 | Fibre |
| WHT | ISIS | 3500-8500 | 1.2-2.0 | 3.0-3.3 | Long slit |
| TNG | DOLORES | 3500-8000 | 1.0-1.5 | 14-15 | Long slit |
a Measured from unsaturated arc lines
b Width of individual fibres
As pointed out before, the vast majority of X-ray sources have a unique candidate counterpart. For the cases where there were two candidate counterparts we observed the brightest one (which happened also to be the closest one to the X-ray source) which invariably turned out to be a plausible identification (i.e. some sort of AGN).
The spectra were reduced using standard IRAF techniques. These included de-biasing, flat fielding, illumination correction (whenever a twilight flat was available), cosmic ray rejection, spectral extraction and background subtraction, arc lamp wavelength calibration and flux calibration by using spectrophotometric standards. The flux calibration does not have to be understood in absolute terms, as significant fractions of the light escaped the corresponding apertures and no attempt has been made to correct for this. Nevertheless the overall spectral shape, if not the normalisation, should be approximately correct. That is especially true for the long-slit spectra which in the majority of the cases were obtained with the slit oriented in parallactic angle.
The case of fibre spectroscopy deserves further comment. The relative fibre throughput was obtained by observing in offset sky positions within the same fibre configuration under use. In the proper on-target observations, the sky was subtracted by combining all the sky fibres that we placed in regions free from bright sources. We applied the same procedure to the offset sky observations, which allowed us to tweak the relative sensitivity of the fibres by making sure that no significant residuals were left in these spectra after the sky was subtracted. In a couple of iterations we found a satisfactory solution for the relative fibre sensitivity and then we used this to sky-subtract the target apertures. It must be stressed that sky lines are very difficult to subtract at this spectral resolution and therefore residuals will unavoidably be present in the fibre spectra.
We must emphasize that fibre spectroscopy, even with the large fibre aperture of 2.7 arcsec, was very efficient in identifying the optically brightest conterparts in the Mkn 205 field. We allocated a total of 26 fibres on optical sources in a single setup, which included several corresponding to X-ray sources below the flux cutoff. We succeeded in identifying 8 X-ray sources above the flux cutoff and a futher 3 below it in a total time of 2.5 hours including all overheads. This is at least twice as efficient as long-slit spectroscopy on the same telescope.
This high efficiency in the fibre spectroscopy relied, however, on two basic facts: the night was dark (so the sky background and noise were as low as possible) and the number of X-ray sources with a single candidate counterpart was very large. It must be pointed out that fibre spectrographs do not usually allow to place fibres within several arcsec at best, and therefore it is not possible to observe different candidate counterparts of the same X-ray source within the same fibre setup.
4 Identification of the X-ray sources
Table 6 lists the optical identification of the sources together with their optical magnitudes. The classification we have chosen includes several source classes: Broad-Line Active Galactic Nuclei (BLAGN), Narrow Emission Line Galaxies (NELG, which invariably turned out to be Narrow-Line AGN), non-emission line galaxies (Gal), Active Coronal stars (AC), stars without signs of activity (STAR) and clusters of galaxies (Clus).
| Source name | RA (J2000) | DEC (J2000) | u | g’ | r’ | i’ | Z | Class | Comments | ||
|---|---|---|---|---|---|---|---|---|---|---|---|
| XMMU J010316.7-065137 | 01:03:16.43 | -06:51:35.83 | 19.85 | 19.23 | 18.74 | 18.57 | BLAGN | 1.914 | 4.221 | CIII], CIV, MgII | |
| XMMU J010327.3-064643 | 01:03:27.41 | -06:46:43.31 | 22.26 | 21.86 | 21.77 | 21.06 | NELG? | 1.010? | 2.036 | CIII]?,[OII]?, [NeV]? | |
| XMMU J010328.7-064633 | 01:03:28.67 | -06:46:32.02 | 20.26 | 19.81 | 19.27 | 19.15 | BLAGN | 1.820 | 4.467 | SiIV, CIV, CIII], MgII | |
| XMMU J010333.8-064016 | 01:03:33.88 | -06:40:16.21 | 22.70 | 21.12 | 19.76 | 19.22 | NELG | 0.692 | 0.597 | [OII],H?,H,[OIII] | |
| XMMU J010339.8-065224 | 01:03:39.89 | -06:52:25.99 | 21.39 | 20.65 | 20.23 | 19.99 | BLAGN | 1.128 | 2.297 | [NIII],CIII], MgII,[OII] | |
| XMMU J010355.6-063710 | 01:03:55.67 | -06:37:10.88 | 21.82 | 21.00 | 20.48 | 20.11 | NELG? | 0.314 | 0.114 | H, [OIII], H, [NeV]? | |
| XMMU J010400.9-064949 | 01:04:01.09 | -06:49:50.89 | 17.08 | 15.52 | 15.24 | 14.16 | AC/dMe | Ca H&K, H, H | |||
| XMMU J010410.5-063926 | 01:04:10.54 | -06:39:26.69 | 19.88 | 19.47 | 19.08 | 19.03 | BLAGN | 0.630 | 0.774 | MgII, H, H, [OIII] | |
| XMMU J010420.9-064701 | 01:04:20.97 | -06:47:01.97 | 19.71 | 18.98 | 18.41 | 18.34 | BLAGN | 1.536 | 2.773 | CIV, CIII], MgII | |
| XMMU J010430.1-064456 | 01:04:30.07 | -06:44:56.60 | 18.77 | 18.27 | 18.06 | 17.96 | BLAGN | 0.910 | 1.937 | CIII], MgII, [OII], H, [NeV] | |
| XMMU J010437.5-064739 | 01:04:37.55 | -06:47:37.23 | 21.19 | 20.71 | 20.24 | 19.76 | BLAGN | 2.511 | 7.248 | Ly, SiIV, CIV?, CIII] | |
| XMMU J010444.6-064833 | 01:04:44.71 | -06:48:33.31 | 20.52 | 20.32 | 19.96 | 19.58 | BLAGN | 2.256 | 10.080 | Ly, CIV, CIII] | |
| XMMU J121819.4+751919 | 12:18:19.06 | +75:19:22.02 | 19.53 | 19.79 | 19.21 | 18.96 | 18.55 | BLAGN | 2.649 | 11.209 | Ly, CIV, CIII] |
| XMMU J122017.9+752212 | 12:20:17.70 | +75:22:18.00 | 12.27c | 11.70c | Gal | 0.0058 | 0.0013 | NGC 4291d | |||
| XMMU J122048.4+751804 | 12:20:48.25 | +75:18:07.29 | 18.41 | 18.97 | 18.47 | 17.96 | 17.83 | BLAGN | 1.687 | 4.181 | CIV, CIII], MgII |
| XMMU J122051.7+752821 | 12:20:51.73 | +75:28:20.67 | 20.90 | 22.05 | 21.33 | 20.80 | BLAGN | 0.181 | 0.030 | H, H, H? OII? | |
| XMMU J122052.0+750529 | 12:20:51.27 | +75:05:31.62 | 18.24 | 18.62 | 18.20 | 17.92 | 17.85 | BLAGN | 0.646 | 7.036 | [OII],MgII |
| XMMU J122111.2+751117 | 12:21:10.62 | +75:11:19.39 | 18.78 | 19.54 | 18.79 | 18.47 | 18.32 | BLAGN | 1.259 | 3.179 | EMSS sourcee |
| XMMU J122120.5+751616 | 12:21:19.90 | +75:16:18.09 | 20.21 | 20.90 | 19.98 | 19.45 | 18.85 | NELG | 0.340 | 0.156 | [OII], [OIII], [NeV] |
| XMMU J122135.5+750914 | 12:21:34.92 | +75:09:15.99 | 19.84 | 20.38 | 19.11 | 18.32 | 17.77 | BLAGN | 0.330 | 0.246 | H, [OIII] |
| XMMU J122143.8+752235 | |||||||||||
| XMMU J122206.4+752613 | 12:22:06.66 | +75:26:15.36 | 20.23 | 20.03 | 18.68 | 17.83 | 17.41 | NELG | 0.238 | 0.975 | [OII],[OIII] |
| XMMU J122242.6+751434 | 12:22:42.69 | +75:14:34.68 | 20.97 | 21.82 | 21.13 | 20.71 | 19.98 | BLAGN | 1.065 | 1.174 | MgII, CIII]? |
| XMMU J122258.1+751934 | 12:22:58.00 | +75:19:34.66 | 22.66 | 21.66 | 21.10 | NELG? | 0.257 | 0.161 | [OII],[OIII] | ||
| XMMU J122318.5+751504 | 12:23:18.11 | +75:15:04.64 | 20.27 | 21.15 | 20.62 | 20.24 | BLAGN | 1.509 | 3.752 | CIII], MgII | |
| XMMU J122344.7+751922 | 12:23:45.65 | +75:19:23.01 | 20.11 | 20.69 | 20.26 | 19.88 | 19.53 | BLAGN | 0.757 | 0.904 | MgII, [NeV]?, [OII] |
| XMMU J122351.0+752227 | 12:23:50.87 | +75:22:28.57 | 19.51 | 19.93 | 19.48 | 18.76 | 18.50 | BLAGN | 0.565 | 1.718 | MgII, [NeV], [OII], H, [OIII] |
| XMMU J122435.7+750812 | 12:24:35.31 | +75:08:10.10 | |||||||||
| XMMU J122445.5+752224 | 12:24:45.42 | +75:22:24.92 | 19.27 | 20.16 | 19.82 | 19.33 | 19.36 | BLAGN | 1.852 | 7.088 | CIV, CIII] |
Notes to Table: a Position of the optical source; b Luminosity in the 0.5-4.5 keV rest frame in units of ; c B and R magnitudes from de Vaucouleurs et al (1991) and Sandage & Visvanathan (1978) quoted under g’ and r’ respectively; d Identification from Humasson, Mayall & Sandage (1956); e Identification from Stocke et al. (1991)
Finding charts and spectra of these sources can be found under the AXIS programme web pages (http://www.ifca.unican.es/x̃ray/AXIS). Here we add some notes on individual objects
XMMU J010327.3-064643 is the faintest optical source (in r’, i’ and Z) with hints of narrow emission lines. We have binned the spectrum into bins of 600 Å each, and applied a photometric redshift technique using a set of galaxy templates as in Fernández-Soto, Lanzetta & Yahil (1999). The minimum happens at , which allows us to interpret an apparently narrow emission line as CIII], and a dubious [OII]. We therefore tentatively classify this source as a NELG, although its high luminosity () would promote it to QSO2. The optical colours of this source do indeed correspond to a QSO or to a starforming galaxy (see fig. 6, where this source is the empty circle at the bottom of the graph). The classification and redshift of this source are at present very uncertain.
XMMU J122258.1+751934 is a faint source, with a detected but weak emission line that we believe to be [OII] and dubious [OIII] doublet at z=0.257. Since the spectrum is very noisy, we applied the photometric redshift technique to the binned spectrum. The minimum is indeed found at .
XMMU J122120.5+751616 appears to have a very blue spectrum, but the H line, which is weak, does not appear to be broad. On the other hand it has strong [NeV], [OII] and [OIII] doublet. Therefore we have classified it as a NELG.
XMMU J010328.7-064633 and XMMU J010316.7-065137 appear to be BAL QSOs. They will be discussed in Sect. 5.4
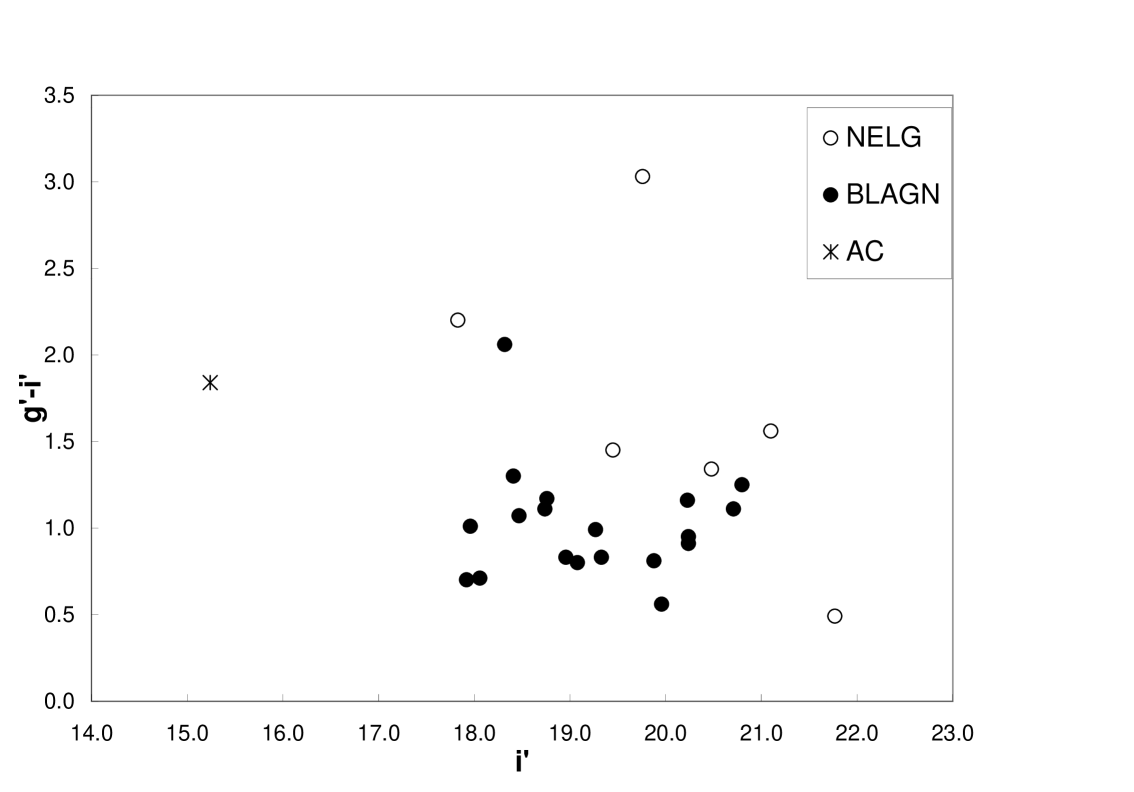
Fig. 5 shows the colour of the identified sources as a function of their i’-magnitude. As expected, BLAGNs are usually bluer than the NELGs where the optical light is dominated by the host galaxy rather than by the active nucleus.
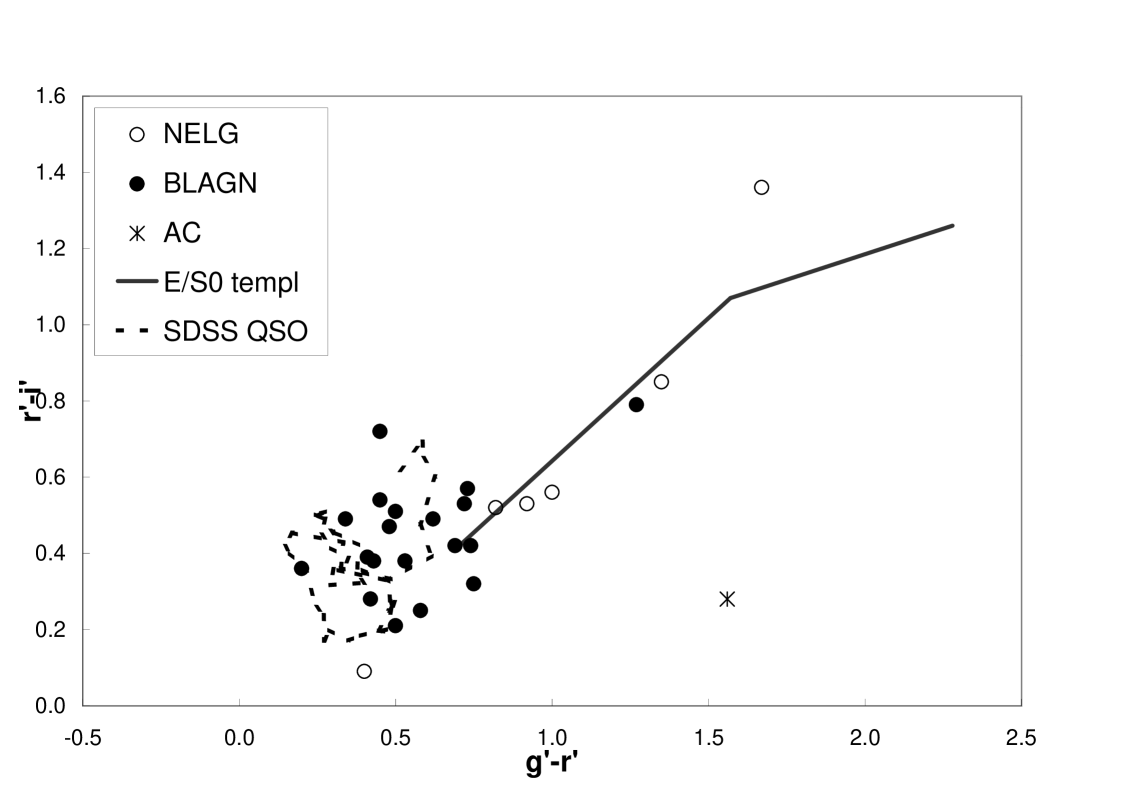
To further explore the optical colours, we plot in fig. 6 the versus optical colour-colour diagram for the identified sources. We overlay median colours for QSOs, as derived from the Sloan Digitized Sky Survey (Richards et al. 2001), in the redshift range and for E/S0 galaxies, as derived from the Coleman, Wu & Weedman (1980) template, in the redshift range . For clarity we do not show the expected colours for starforming galaxies as they are mostly coincident with those of QSOs, but they can follow the track marked by the E/S0 colours by adding increasing amounts of reddening. The influence of cosmological Lyman- absorption has not been included, as it is only relevant in the g’-band for redshifts . Clearly, the X-ray sources classified as BLAGNs have optical colours as expected for QSOs, and the X-ray sources identified as NELGs fall in the region where the galaxies lie (either E/S0 or more likely reddened starforming galaxies). This implies again that in NELGs most of the optical light we see comes from the host galaxy, unlike the X-ray emission which comes from the nucleus.
4.1 Additional identifications
Besides the identifications corresponding to the complete sample of X-ray selected sources down to an X-ray flux of , we have identified a few sources fainter than these. These 10 additional sources are not part of the sample considered here, but still we list their identifications to help other researchers in possible identification work of fainter sources. These identifications are listed in Table 7.
| Source name | RA (J2000) | DEC (J2000) | Perrb | Fluxc | RA (J2000) | DEC (J2000) | i’ | Class | z | |
|---|---|---|---|---|---|---|---|---|---|---|
| XMMU J010311.7-064038 | 01:03:11.79 | -06:40:38.25 | 1.93 | 01:03:11.83 | -06:40:39.14 | 18.98 | NELG | 0.187 | 0.133 | |
| XMMU J010359.8-065318 | 01:03:59.82 | -06:53:18.46 | 1.95 | 01:03:59.87 | -06:53:18.87 | 20.92 | BLAGN | 1.270 | 0.980 | |
| XMMU J010400.9-063027 | 01:04:00.98 | -06:30:27.36 | 2.34 | 01:04:01.15 | -06:30:28.35 | 20.09 | BLAGN | 1.693 | 2.199 | |
| XMMU J010402.9-063600 | 01:04:02.91 | -06:36:00.14 | 1.14 | 01:04:02.84 | -06:35:59.70 | 21.69 | BLAGN | 0.932 | 0.629 | |
| XMMU J010405.5-065359 | 01:04:05.57 | -06:53:59.21 | 2.45 | 01:04:05.33 | -06:53:59.17 | 21.13 | BLAGN | 2.821 | 5.093 | |
| XMMU J010410.0-063012 | 01:04:10.06 | -06:30:12.92 | 1.77 | 01:04:10.13 | -06:30:12.78 | 21.13 | BLAGN | 1.190 | 1.579 | |
| XMMU J010411.5-065209 | 01:04:11.53 | -06:52:09.60 | 2.25 | 01:04:11.40 | -06:52:08.86 | 20.90 | BLAGN | 1.224 | 1.138 | |
| XMMU J010439.3-064629 | 01:04:39.34 | -06:46:29.88 | 1.60 | 01:04:39.33 | -06:46:27.24 | 20.08 | BLAGN | 1.620 | 1.927 | |
| XMMU J121937.5+751042 | 12:19:37.57 | +75:10:42.96 | 1.46 | 12:19:37.34 | +75:10:43.79 | 20.77 | STAR | |||
| XMMU J122425.4+751818 | 12:24:25.46 | +75:18:18.04 | 1.34 | 12:24:25.50 | +75:18:19.74 | 15.72 | AC/dMe |
Notes to Table: a Position of the X-ray source; b Position error (Statistical) of the X-ray source in arcsec; c Flux in the 0.5-4.5 keV band, in units of ; d Position of the optical source; e Luminosity in the 0.5-4.5 keV band;
5 Discussion
5.1 Astrometric accuracy in the X-ray source list
With the sample of X-ray sources whose optical counterparts have been positively identified (including the ones below our flux limit), we check how good the astrometry of the XMM-Newton data was. We then analyzed the offsets of the optical position with respect to the X-ray position. These are shown in Fig. 7, where error bars are just the X-ray positional errors, which by far dominate over the optical position ones.

An obvious feature to note is that, apart from the source XMMU J122017.9+752212 which is extended both in X-rays and in the optical (NGC 4291), there is no obvious trend of offsets being larger for any source class. In particular the sources classified as NELGs (which in fact are all AGNs) are unlikely to be chance coincidences, as in that case they would exhibit larger offsets with respect to the X-ray sources.

Fig. 8 shows the histogram of these offsets normalized to their corresponding statistical errors. Assuming that position errors are well reproduced by a gaussian, this normalized offset should be distributed as
| (1) |
where in the absence of systematic shifts . Actually measures the magnitude of systematic residuals in units of statistical errors. An attempt to fit the histogram of fig. 8 without systematics reveals that it can only reproduce the first peak (at around ), but leaves the second peak unexplained. Then we maximum-likelihood fitted the sum of two of the above functions, one with and a second one with the systematic shift as a free parameter, the relative contribution of both terms being also a free parameter. The result (fit shown in fig. 8) is that about 83% of the sources have no significant systematic shifts and the remaining 17% of the sources have systematic shifts of statistical errors (typically arcsec).
A closer inspection of the sources showing residual astrometric systematics shows that all of them are in the Mkn 205 field, all of them are relatively bright and only one of them is relatively close to the centre of the field (but then close enough to the Mkn 205 point-spread function tail). We do not fully understand the reason for this, but perhaps it might be related to the overall astrometric solution being dominated by some spurious matches of X-ray sources fainter than the ones used in our survey. The residuals are, however, so small that they are irrelevant for a high galactic latitude field. Much more care should be taken, however, in galactic plane fields where the density of optical sources is much larger and chance associations might produce a completely wrong astrometric solution. We suggest in this case to use a very limited number of secure identifications to derive a first astrometric correction and then iterate as the number of identified sources grows.
5.2 Overall source populations
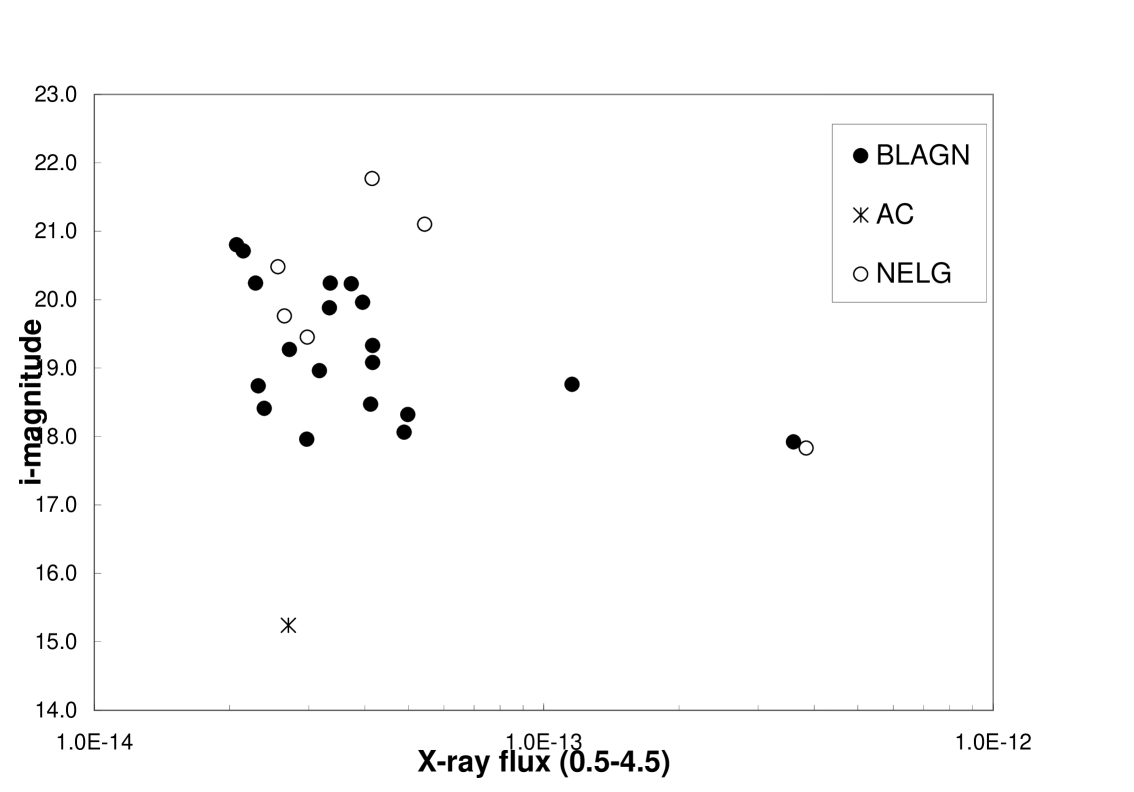
As expected, the majority of the identified X-ray sources are extragalactic (only 1 galactic AC), and in particular AGN. Fig. 9 shows the optical to X-ray relation for the X-ray sources. We see that most, if not all, of the BLAGNs will be identified in the medium sensitivity survey (i.e. at a flux limit of ) down to i’. NELGs and other galaxies are typically fainter, but we expect to identify large fractions of them within the AXIS resources. We can conclude from this pilot study that of the medium sample can be identified with the AXIS programme.
One remarkable feature of this survey is that we have found no clusters of galaxies as counterparts of the identified X-ray sources. Using the source counts from the Deep Cluster Survey (Rosati et al. 1998) we would have expected clusters in our sample. We must further stress that there are no cluster candidates in the unidentified sources, down to the sensitivity limits of the optical images. Actually, the sliding box algorithm used to search for sources in the XMM-Newton images is not optimized for the detection of extended sources. Therefore we do not expect to be complete in groups and clusters. In fact, extended sources in XMM-Newton images are the subject of on-going parallel studies within the XMM-Newton Survey Science Centre activities.
We have cross-correlated the X-ray source positions with the NVSS radio survey (Condon et al. 1998). No coincidences closer than 10 arcsec are found for the flux-limited sample. The only radio source within 30 arcsec of an X-ray source is a faint source of 2.4 mJy, just below the completeness level of NVSS, 14.4 arcsec away from XMMU J010400.9-064949. The NVSS positional uncertainty for a source this faint (rms about 7 arcsec), when combined with the astrometric accuracy of our X-ray sources (Sect. 5.1) make it unlikely that this is a true association. For the full sample of 89 sources found by our source-searching algorithms, the number of coincidences within 30 arcsec increases from zero to one, with a source of 2.7 mJy being found 7.1 arcsec from an unidentified X-ray source of 5.6 . Despite the fact that this is likely to be a true association, preliminary statistics based on about 3000 X-ray sources from the ChaMP survey (Wilkes et al. 2001; Wilkes and Green 2001, private communication) find a radio association with NVSS which increases with X-ray flux, and with which our two XMM-Newton fields disagree at the 95% confidence level. Work is underway to investigate the radio properties of larger samples of sources.
5.3 The extragalactic X-ray sources
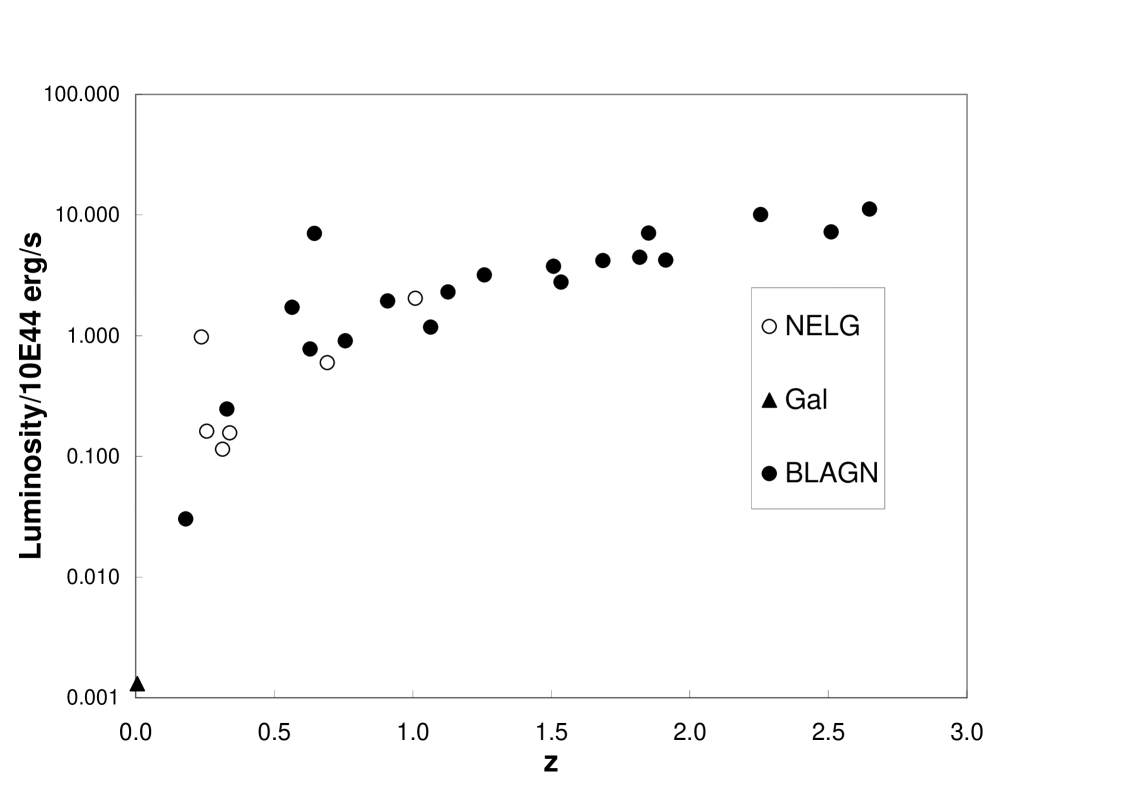
Fig. 10 shows the luminosity-redshift relation for the extragalactic sources identified in our sample. With the exception of NGC 4291, which has a luminosity not far from that of a normal galaxy (), all the remaining extragalactic objects have luminosities higher than , so there is no doubt they host an Active Galactic Nucleus. In particular, all the objects classified as NELGs, should in reality be called Narrow-line AGNs (NLAGNs). Indeed some (if not all of them) exhibit [OIII] lines much stronger than [OII] and/or [NeV] emission lines, all of which are features of a hard non-stellar ionizing continuum in the narrow-line emitting region.
The weighted average hardness ratios for BLAGN are and . It is interesting to note that for a single power-law spectrum, these values correspond to and respectively, i.e., it appears that BLAGN have a hardening in their spectrum towards high photon energies.
It is remarkable, however, that the average spectra of BLAGN do not appear to be consistent with a single power law spectrum. Indeed, while is consistent with an unabsorbed spectrum, at harder photon energies calls for a much flatter X-ray spectrum, with . A similar result has been recently found by Pappa et al (2001) by co-adding and spectra of 21 BLAGN. Our result confirms that this is not due to a mismatch between and calibrations and amphasizes the power of XMM-Newton in broad-band X-ray spectral studies.
The spectral shape that we infer for BLAGN was first empirically proposed by Schwartz & Tucker (1988) in order to reproduce the XRB spectrum. The subsequent discovery of a Compton reflection bump in the X-ray spectrum of Seyfert 1 galaxies (Pounds et al 1990) suggested that reflection-dominated AGN (i.e., AGN where of the observed X-rays would have been reflected in cold/warm material) could contribute the bulk of the X-ray background (Fabian et al 1990). Although no significant population of such sources has been detected, it is likely that we are witnessing the effects of Compton reflection or a similar phenomenon in the average X-ray spectra of the BLAGN in our sample. If the Compton reflection bump entering the 4.5-10 keV band is the ultimate reason for the hard values of , then a trend with redshift should be seen. In fig. 11 we plot both hardness ratios and as a function of redshift for the extragalactic objects. No trend is found in vs z for BLAGN, and at best we can only claim a hint of becoming higher at high redshifts. That, which would be expected if Compton reflection is responsible for the hardening of the spectrum, needs much more data to be confirmed.

We only find marginal evidence for the NLAGN having a harder spectrum than BLAGN (see fig. 3). Such a trend had been found in surveys (Romero-Colmenero et al. 1996; Almaini et al. 1996). The weighted average hardness ratios for these objects are and . agrees with the corresponding value for BLAGNs, but is slightly higher, although only at significance. If we interpret the marginal difference in terms of a power-law spectrum being affected by intrinsic absorption in NLAGN, the inferred column density is at a redshift of where most of the NLAGNs are located.
We must recall that evidence has been accumulated that X-ray photoelectric absorption and optical spectroscopic classification do not appear to have a one-to-one relation. For example hard X-ray sources found in surveys contain large fractions of unobscured type 1 QSOs and Seyferts (Page, Mittaz & Carrera 2001). On the contrary, dusty warm absorbers produce little effect in the X-ray broad-band colours of AGN, but substantially influence their optical appearence. The underlying reason for all these apparent inconsistencies could be the different distributions of atomic gas and dust in the close environment of the AGN central engine (Maiolino et al. 2001), perhaps due to dust sublimation near the center (Granato, Danese & Franceschini 1997).
Source XMMU J122017.9+752212 (NGC 4291) deserves further comment. X-ray emission from this galaxy was detected with (Canizares, Fabbiano & Trinchieri 1987). Roberts & Warwick (2000) analyze HRI images of nearby galaxies and find a nuclear X-ray point source within 6.8 arcsec from the centre of NGC 4291. The extended X-ray emission of this source in the 0.5-4.5 keV XMM-Newton image clearly masks out a part of the sky, which is why we have removed a 1.5 arcmin radius circle around it. However, when this region is examined only in the 2-10 keV band, the diffuse emission disappears. What is then seen is a point source approximately coincident with the nucleus of NGC 4291 and a further 4 sources within the excised region, some of which might possibly be associated with the galaxy. The fact that NGC 4291 presents a point source in its center is a strong suggestion that an active nucleus might be actually hidden in the centre of this optically dull galaxy. A more complete discussion of this interesting galaxy and its environment is beyond the scope of this paper and will be presented elsewhere.
5.4 The Broad-Absorption Line QSOs
Among the sample of BLAGN we find 2 (XMMU J010328.7-064633 at and XMMU J010316.7-065137 at ) Broad-Absorption-Line (BAL) QSO (see figs. 12 and 13). Parameters of the corresponding broad-absorption line systems (based on the CIV line) are listed in Table 8. In particular we have computed the so-called Balnicity index introduced by Weymann et al. (1991) as a way to provide a continuous classification between BAL and non-BAL QSOs. In the context of the sample studied by Weymann et al. (1991) the value of the Balnicity Index is in the low end for XMMU J010316.7-065137 but close to average for XMMU J010328.7-064633.
| Source | BI | ||
|---|---|---|---|
| (Å) | () | () | |
| XMMU J010316.7-065137 | 5 | 19000 | 580 |
| XMMU J010328.7-064633 | 34 | 34000 | 3650 |
BAL QSOs have been practically absent from previous X-ray selected samples. There have been a few exceptions: 1 BAL QSO in the Einstein Medium Sensitivity Survey at (Stocke et al. 1991) and more recently the ELAIS/BeppoSAX survey at (Alexander et al. 2001), the Chandra deep field south at , (Giacconi et al. 2001) and the survey of hard X-ray sources at (Page, Mittaz & Carrera 2001).


The paucity of BAL QSOs in previous X-ray surveys is hardly surprising, as the gas ejected by BAL QSOs which is responsible for the broad absorption lines will efficiently absorb soft X-rays. Previous X-ray missions, mostly sensitive to soft X-rays like and , are expected to have a much reduced sensitivity to BAL QSOs with respect to optical surveys. It is illustrative to notice that the only -discovered BAL QSO was found in a selection of hard X-ray spectrum sources.
We find it intriguing that the BAL QSOs have ‘normal’ values of : for XMMU J010328.7-064633 and for XMMU J010316.7-065137 (the average over all sources in the sample is for ). Indeed, the high redshift of the two objects helps to move the intrinsic photoelectric absorption feature below our detection band (0.5-4.5 keV). Assuming , and an unabsobed power-law spectrum, an intrinsic absorbing column of increases the value of from -0.68 in the absence of intrinsic absorption to -0.61. It is then clear that these objects cannot have intrinsic columns significantly in excess of or otherwise we would see it in their X-ray spectra. However, these are unusually small values for the absorbing columns in BAL QSOs. Gallagher et al. (2001) report on ASCA and observations of several BAL QSOs, and the inferred absorbing columns always exceed and sometimes by a large amount. Here we see that low (neutral) column density BAL QSOs do exist. Perhaps high ionisation and/or partial covering could bring to agreement the apparent small X-ray absorbing column with a sizeable CIV broad absorption line.
A further remarkable fact is that both BAL QSOs lie at the redshift where the distribution of BLAGN peaks. This might be telling us that we are only seeing the tip of the iceberg, i.e., we have only detected BAL QSOs at the redshift where this detection would be more likely (helped indeed by the K-correction discussed above).
What remains to be understood is why BAL QSOs were practically absent in surveys of similar depth (e.g. Boyle et al 1994). The sensitivity to higher X-ray photons of our current survey (0.5-4.5 keV) with respect to the standard 0.5-2 keV band does not make a big difference: for a , intrinsically absorbed () power-law () QSO spectrum, only of the counts from the source fall in the 2-4.5 keV band in EPIC pn. A source with that spectrum at our survey limit, would have a 0.5-2 keV flux slightly above and would have been therefore detectable in the so-called deep survey (Boyle et al 1994).
6 Conclusions
As expected, the majority (25 out of 29 or 86%) of the X-ray sources identified in this sample are AGN. These are divided into 25% Narrow-line AGN and 75% Broad-Line AGN. Narrow-line AGNs have some hints of photoelectric absorption with respect to the BLAGN population, but the effect is less than significant in our small sample. Inferred columns for narrow-line AGNs at would be around .
Perhaps the most remarkable finding is that 2 out of 24 AGN are BAL QSOs, i.e., . This is similar to the fraction of BAL QSOs in optically selected samples. The X-ray spectrum of these BAL QSOs does not show evidence for photoelectric absorption, and the limits we derive for the intrinsic absorption column () tell us that these are unusual objects among the BAL QSO population in their X-ray spectra.
The AXIS high-galactic latitude medium survey is now progressing with X-ray sources spectroscopically identified. Large numbers of sources are needed, not only to study in detail the overall properties of the dominant source population (AGN in this case), but also to find and characterize the rarer populations, e.g., BAL QSOs or optically dull galaxies (Mushotzky et al. 2000; Baldi et al. 2001).
Acknowledgements.
We thank Alberto Fernández-Soto for help with the photometric redshift techniques and the referee Ioannis Georgantopoluos for interesting suggestions. We are grateful to the CCI of the observatories of the Canary Islands for a generous allocation of telescope time, through the International Time Programme scheme. The INT/WHT and TNG telescopes are operated on the island of La Palma by the Isaac Newton Group and the Centro Galileo Galilei respectively in the Spanish Observatorio del Roque de Los Muchachos of the Instituto de Astrofísica de Canarias. XB, FJC, MTC and SM acknowledge financial support by the Spanish MCYT under project AYA2000-1690. RDC and TM acknowledge partial financial support by the Italian Space Agency (ASI) and by the MURST (Cofin00-32-36). This project was supported by the DLR under grants 50 OR 9908 0 (GPS) and 50 OX 9801 3 (HB).References
- Alexander et al. (2001) Alexander, D., LA Franca, F., Fiore, F. et al 2001 ApJ, 554, 18
- Almaini et al. (1996) Almaini, O., Shanks, T., Boyle B.J., et al, 1996 MNRAS, 282, 295
- Baldi et al. (2001) Baldi, A., Molendi, S., Comastri, A. et al, 2001 ApJ, in the press
- Barger et al. (2001) Barger, A.J., Cowie, L.L., Mushotzky, R.F., Richards, E.A., 2001 AJ, 121, 662
- Bertin & Arnouts (1996) Bertin, E., Arnouts, S., 1996 A&AS, 117, 393
- Boyle et al. (1994) Boyle, B.J., Shanks, T., Georgantopoulos, I. et al 1994 MNRAS, 271, 639
- Fabian & Barcons (1992) Fabian, A.C., Barcons, X., 1992 ARAA, 30, 629
- Canizares, Fabbiano & Trinchieri (1987) Canizares, C.R., Fabbiano, G., Trinchieri, G., 1987 ApJ, 312 503
- Coleman, Wu & Weedman (1980) Coleman, G.D., Wu, C.C., Weedman, D.W., 1980 ApJS, 43, 393
- Condon et al. (1998) Condon, J.J., Cotton, W.D., Greisen, E.W., Yin, Q.F., Perley,R.A., Taylor, G.B., & Broderick, J.J. 1998 AJ, 115, 1693
- de Vaucouleurs et al (1991) de Vaucouleurs, G., de Vaucouleurs, A., Corwin, J.R., Buta, R.J., Paturel, G., Fouque, P., 1991. Third Reference Catalogue of Bright galaxies, Version 3.9, Springer-Verlag.
- Fabian et al (1990) Fabian, A.C, George, I.M., Miyoshi, S., Rees, M.J., 1990, MNRAS, 242, P14
- Fernández-Soto, Lanzetta & Yahil (1999) Fernández-Soto, A., Lanzetta, K.M., Yahil, A., 1999 ApJ, 513, 34
- Gallagher et al. (2001) Gallagher, S.C., Brandt, W.N., Chartas, G., Garmire, G.P., 2001 In: Mass outflow in active Galactin Nuclei: new perspectives. Ed: D.M. Crenshaw, S.B. Kraemer, I.M. George. ASP Conf Series (in the press).
- Giacconi et al. (2001) Giacconi, R., Rosati, P., Tozzi, P. et al 2001 ApJ, 551, 624
- Granato, Danese & Franceschini (1997) Granato, G.L., Danese, L., Franceschini, A., 1997 ApJ, 486, 147
- Hasinger et al. (1998) Hasinger, G., Burg, R., Giacconi, R., Schmidt, M., Trümper, Zamorani, G., 1998 A&A, 329, 482
- Hasinger et al. (2001) Hasinger, G., Altieri, B., Arnaud, M., et al, 2001 A&A, 365, L45
- Humasson, Mayall & Sandage (1956) Humasson, M.L., Mayall, N.U., Sandage, A.R. 1956, AJ, 61, 97
- Jansen et al. (2001) Jansen, F.A., Lumb, D., Altieri, B., et al, 2001 A&A, 365, L1
- Maiolino et al. (2001) Maiolino, R., Marconi, A., Salvati, M. et al, 2001 A&A, 365, 28
- Mason et al. (2000) Mason, K.O., Carrera, F.J., Hasinger, G., et al, 2000 MNRAS, 311, 456
- Monet et al. (1998) Monet, D., Canzian, B., Dahn, C. et al, 1998 A Catalog of Astrometric Standards, U.S. Naval Observatory Flagstaff Station (USNOFFS) and Universities Space Research Association (USRA) stationed at USNOFFS.
- Mushotzky et al. (2000) Mushotzky, R.F., Cowie, L.L., Barger, A.J., Arnaud, K.A., 2000 Nat, 404, 459
- Page, Mittaz & Carrera (2001) Page, M.J., Mittaz, J.P.D., Carrera, F.J., 2001 MNRAS, 325, 575
- Pappa et al (2001) Pappa, A., Stewart, G.C., Georgantopoulos, I., Griffiths, R.E., Boyle, B.J., Shanks, T., 2001 MNRAS, 327, 499
- Pounds et al (1990) Pounds, K.A., Nandra, K., Stewart, G.C., George, I.M., Fabian, A.C., 1990, Nat, 344, 132
- Richards et al. (2001) Richards, G.T., Fan, X., Schneider, D.P., et al, 2001 AJ, 121, 2308
- Roberts & Warwick (2000) Roberts, T.P., Warwick, R.S., 2000 MNRAS, 315, 98
- Romero-Colmenero et al. (1996) Romero-Colmenero, E., Branduardi-Raymont, G., Carrera, F.J. et al 1996 MNRAS, 282, 94
- Rosati et al. (1998) Rosati, P., Della Ceca, R., Norman, C., Giacconi, R., 1998 ApJ, 492, L21
- Sandage & Visvanathan (1978) Sandage, A., Visvanathan, N., 1978. ApJ, 223, 707
- Schwartz & Tucker (1988) Schwartz, D.A, Tucker, W.H., 1988, ApJ, 332, 157
- Stocke et al. (1991) Stocke, J.T., Morris, S.L., Gioia, I.M., Maccacaro, T., Schild, R., Wolter, A., Fleming, T.A., Henry, J.P. 1991 APJS, 76, 813
- Strüder et al. (2001) Strüder, L., Briel, U., Dennerl, R., et al, 2001 A&A, 365, L18
- Turner et al. (2001) Turner, M.J.L., Abbey, A., Arnaud, M., et al, 2001 A&A, 365, L27
- Ueda et al. (1999) Ueda, Y., Takahashi, T., Ishisaki, Y., Ohashi, T., Makishima, K., 1999 ApJ, 524, L11
- Watson et al. (2001) Watson, M.G., Auguères, J.-L., Ballet, J., et al, 2001 A&A, 365, L51
- Weymann et al. (1991) Weymann, R.J., Morris, S.L., Foltz, C.B., Hewett, P.C., 1991 ApJ, 373, 23
- Wilkes et al. (2001) Wilkes, B.J. et al. 2001 in ”New Era of Wide Field astronomy” ed R. Clowes, ASP Conf Proc, in press