Effect of the environment on the Fundamental Plane of elliptical galaxies
We present an analysis of the location of interacting E/S0 galaxies on the Fundamental Plane (FP). Using the NEMO package, we performed N-body simulations of close encounters and mergers of two self-gravitating spherical galaxies. Two models for encounting galaxies – Plummer’s and Hernquist’s – were used. The number of particles ranged from 20000 to 50000 per galaxy. The changes of central density, half-mass radius and central velocity dispersion were analysed. It was found that close encounters between galaxies alter noticeably the above parameters within a very short time interval (107–108 years) just before the final merger. The amplitudes of parameter changes strongly depend on the initial mass concentration of a model. In some experiments we considered an encounter of two spherical galaxies with dark matter components. The effect of parameter changes was less pronounced than for the experiments without a dark halo. The results of the simulations were used to discuss the FP for interacting early-type galaxies.
Key Words.:
galaxies; kinematics and dynamics; photometry1 Introduction
The Fundamental Plane (FP) defines one of the most important relationships for early-type galaxies (Djorgovski & Davis 1987, Dressler et al. 1987). The FP combines surface photometry parameters ( – effective radius and – effective surface brightness or – mean surface brightness within ) with spectroscopy characteristics (line-of-sight central velocity dispersion ). The measured values of , and for a sample of E and S0 galaxies do not fill this 3-parameter space entirely but rather a thin plane within it (with scatter 0.1 dex). The FP can be projected onto any two axes. Examples of these projections are the Kormendy relationship (–log), and the Faber-Jackson relationship between luminosity and velocity dispersion.
The interpretation of the FP is still a matter of discussion. The most popular point of view is that the FP is simply a consequence of the Virial theorem and the fact that E/S0 galaxies have similar mass-to-luminosity ratios () and homologous structure at a given luminosity. If elliptical galaxies had perfectly homologous structural and kinematical properties, then the Virial theorem would predict the FP to have the form , where . Under the assumption of a constant , the observed FP should then be . In practice, however, the and coefficients have been determined to lie in the range 1.2-1.6, and 0.30-0.35, respectively. The difference between expected and observed parameters of the FP is generally refered to as the ”tilt” of the FP. This tilt is usually viewed as the product of systematic variations of along the FP (). Among the possible explanations that have been considered for the tilt are: variations in the stellar population along the FP, changes in the dark matter content, and deviations from homology (Hjorth & Madsen 1995, Capelato et al. 1995, Ciotti et al. 1996).
The very existence of the FP has profound implications for the processes that led to the formation and evolution of elliptical galaxies. In particular, its tightness provides a very strong constraint on the evolutionary history of those systems. The FP can be used to study the evolution of galaxies as a function of redshift, to derive redshift independent distance estimates, etc.
However, we must be cautious when using the FP to obtain distances to elliptical galaxies without regard for their environment. The significant environmental effects on the elliptical galaxy correlations prevent their utility as accurate distance indicators. Hence the question of how a galaxy should move in the space of (, , ) as a result of interaction with other galaxies is of a great importance.
Zepf & Whitmore (1992) investigated the environmental dependence of the FP of elliptical galaxies by studying a sample of elliptical galaxies in compact groups. The central velocity dispersions of ellipticals in compact groups appear to be about 20 % lower than those in other environments (galaxies in clusters and in the general field). De la Rosa et al.(2001) re-examined this topic with a better and more homogeneous dataset. They found little or no significant difference between elliptical galaxies in compact groups and comparable galaxies in other environments.
Levine & Aguilar (1996) carried out a few Monte Carlo simulations of the evolution of a number of elliptical galaxies in the core of a very rich cluster. Under two very simple physical assumptions (virial equilibrium and retention of the functional form of the surface brightness and mass density profiles), any change in the galaxy caused by any interaction that satisfies these assumptions will be narrowly constrained within a plane very close to the observed FP of ellipticals, even for large changes in the global ratio. The angle between this plane and the observed FP of ellipticals is less than . So, if a galaxy is in or near the FP, it will remain so after an interaction.
De Carvalho & Djorgovski (1992) found that elliptical galaxies in clusters were best fitted by a slightly different FP than galaxies in the field. However according to Pahre et al. (1998) this difference is naturally explained by errors in estimating dust extinction or estimating distances (and not by any intrinsic differences in the stellar populations among elliptical galaxies that correlates with their environment). There is no clear evidence that either the slope, zero-point or scatter of the FP are dependent on the spatial environment (see discussion in Pahre et al. 1998).
The main purpose of the present work is to explore the possible influence of strong mutual low-velocity encounters of early-type galaxies on their general characteristics and on their location within the FP.
2 Fundamental Plane for Interacting and Merging Galaxies
In order to study the FP for intensively interacting early-type galaxies we have considered several pieces of observational data.
Fig.1 presents the Faber-Jackson relation for E/S0 galaxies belonging to 1) VV (Vorontsov-Velyaminov 1959) or Arp (Arp 1966) systems (28 galaxies, stars), 2) CPG (Karachentsev 1972) or TURNER binary systems (Turner 1976), and 3) Hickson compact groups (Hickson 1982) (circles). The total number of galaxies is 94.

We used from 1) Hypercat, CRAL Observatoire de Lyon (www-obs.univlyon1.fr/hypercat), 2) Davoust & Considere (1995), 3) Simien & Prugniel (1997a), 4) Simien & Prugniel (1997b) and apparent magnitudes from NED111NASA/IPAC Extragalactic Database (NED) operated under the management of the Jet Propulsion Laboratory, CalTech, in accordance with a contract from NASA. The have been corrected for galactic extinction using NED (reddenings derived from HI and galaxy counts: Burstein & Heiles 1982). Absolute magnitudes MB are computed assuming = 75 km s-1 Mpc-1. When estimating galaxy distances, we assigned to each galaxy the heliocentric radial velocity adopted from NED and corrected for the Sun’s motion using the standard relation.
Dashed line in Fig.1 shows the mean relation for 594 E/S0 galaxies according to McElroy (1995): . The slope and the scatter () of the data for interacting galaxies are the same as for normal E/S0.
Triangles in Fig.1 present the characteristics of 14 remnants of disk-disk mergers (Keel & Wu 1995). As one can see, the mergers follow the same relation as early-type galaxies but with small shift () to brighter absolute luminosities. The dashed rhomb shows the mean value () for 9 starbursting infrared-luminous galaxies (Shier & Fischer 1998). All these galaxies are at some stage of merging. Starbursting mergers demonstrate significant brightening () in comparison with normal galaxies. One can expect that relics of disk-disk mergers and infrared-luminous mergers will evolve into normal ellipticals at the FP.
Fig.2 compares the FP location of interacting ellipticals/lenticulars belonging to VV and Arp systems (crosses) with relatively isolated galaxies (points) (the data in the passband are from Djorgovski & Davies 1987, in the filter – Bender et al. 1992). Here we used = 100 km s-1 Mpc-1. The FP is defined as . The FP scatter for interacting galaxies ( in and in ) is the same as (or even smaller than) that of non-interacting objects ( in and in ).
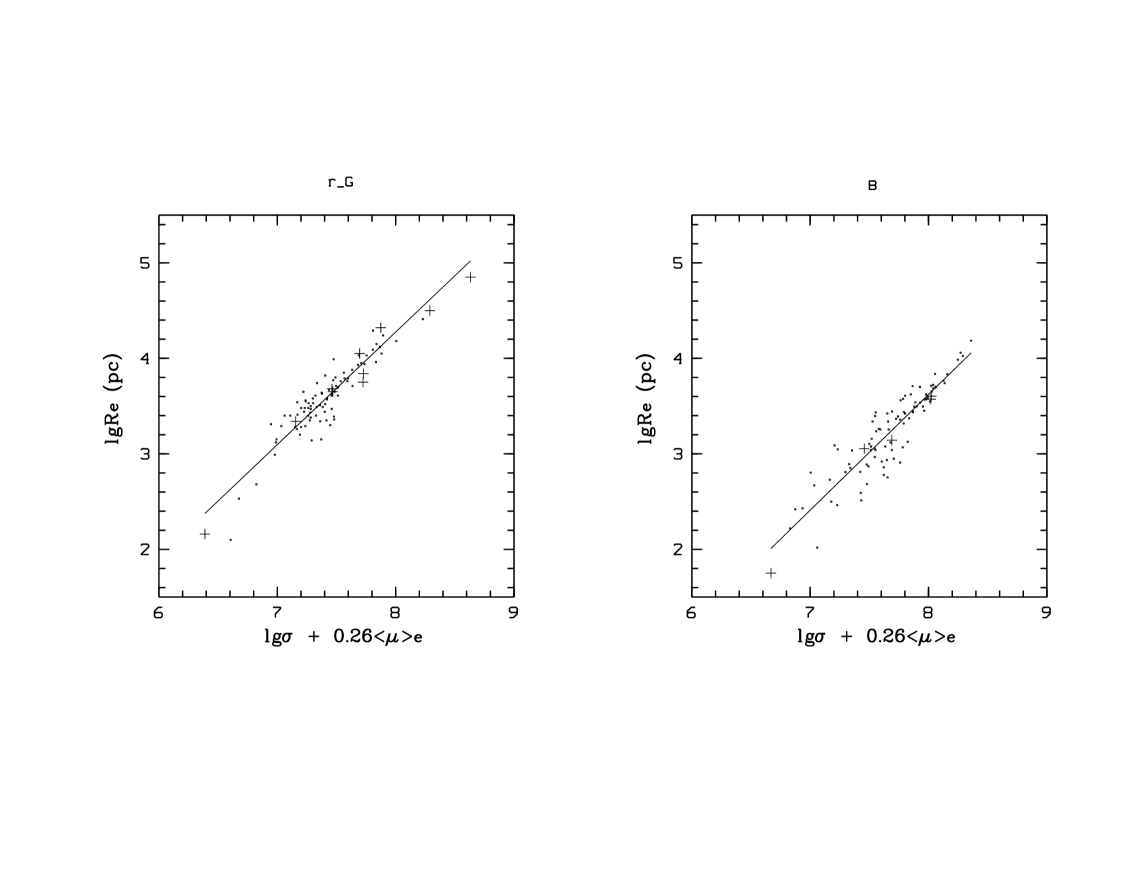
One can conclude that the present observational data about the global characteristics of strongly interacting E/S0 galaxies show that the close environment has no or almost negligible effect on the FP. The only difference we see for forming (or young) ellipticals is that they are significantly brighter (for fixed ) due to superimposed bursts of star formation.
3 Numerical Modeling of Interacting Ellipticals
To check our empirical findings we have performed numerical modeling of close encounters of two ellipticals.
We simulated the evolution of the self-gravitating spherical galaxies by using the NEMO package (http://bima.astro.umd/nemo/, Teuben 1995). This is a freeware package designed to numerically solve gravitational N-body problems. It consists of subroutines for specifying initial configurations of stellar-dynamical systems (including many standard models) and subroutines for simulating the evolution of these systems based on various numerical schemes.
In our computations, we used N-body dynamics with a hierarchical tree algorithm and multipole expansion to compute the forces, as proposed by Barnes & Hut (1986). Multipole expansion is limited by the monopole term. A tolerance parameter (”opening angle”) which controlled the force computation from distant particles was set as 0.7.
We considered only the behavior of the stellar component of galaxies (elliptical galaxies usually contain a small amount of gas). The number of particles used in our numerical simulations ranged from to per galaxy. In this case we managed to substantially suppress the effects of pair relaxation and to trace the evolution of merging galaxies on time scales up to years. The timestep for the simulations used was as years.
The softening length was taken as of the inter-particle distance of the homogoneous state.
We considered two models for encounting galaxies. One of them is Plummer’s spherically-symmetric model
where is the galaxy mass and is a scale length.
In some experiments galaxies are modeled by the potential-density pair proposed by Hernquist (1990) for spherical galaxies
It is well known that both models are described by a distribution function in an analytical form and, in the absence of numerical errors and dynamical instabilities, remain time-stationary.


Results are presented in the following system of units: gravitational constant , the galaxy mass , the total energy of a sphere ( and for Plummer’s sphere; and for Hernquist’s sphere). Scaled to physical values appropriate for a typical elliptical galaxy, i.e. and half-mass radius kpc ( - for Plummer’s sphere, - for Hernquist’s sphere), units of distance, time and velocity are 3.73 kpc, 10.3 Myr, 345.3 km s-1 respectively.
We specified the initial distance between two equal-mass galaxies as kpc and chose the initial relative velocity in the range km s-1.
As a result we had a close encounter with merging (the distance of the first closest approach was 5.2 kpc) and a distant encounter without merging (in this case the minimum galaxy separation was 10.3 kpc).
Fig.3 presents some ”snapshots” of a close encounter, showing the initial condition (), the configuration near the first maximum overlap (), the configuration shortly before the final merger (), and a merger state (). A contour map of two interacting Plummer’s spheres are plotted in Fig.4. Some changes in morphology of model galaxies become noticeable only at the final stages of encounter (). There are real objects which are very similar to these interaction stages of model galaxies, for example NGC 1587/1588, NGC 7236/7237 (Borne & Hoessel 1988).
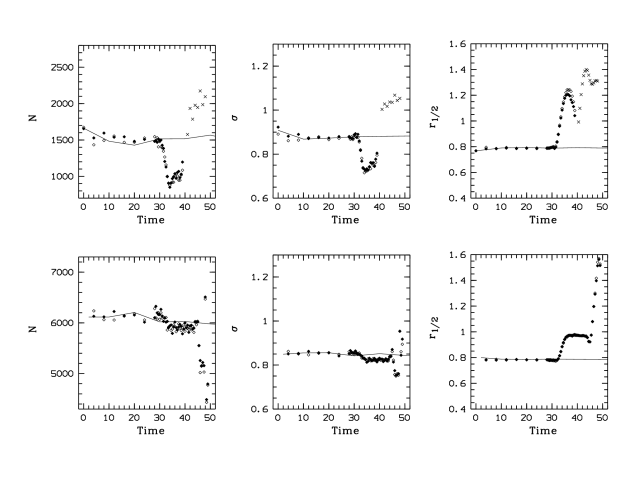
For all models we followed the changes of central density ( – number of particles within 0.2 distance units = 0.75 kpc), half-mass radius ( – within 0.75 kpc) and central velocity dispersion (). During the distant encounter all these parameters were not altered. As to the close encounter, in this case the most drastic changes in parameters were observed at the moment shortly before the final merger (at yrs before merger) – Fig.5.
The range of parameter changes appears to depend on the initial mass concentration of a model. More concentrated Hernquist’s spheres show less pronounced responses than does a less concentrated Plummer’s model (Fig.5).
Amplitudes of relative changes of the parameters for two models are:
Plummer’s sphere –
67, 17,
Hernquist’s sphere –
33, 6.
These amplitudes are comparable with the FP scatter (rms scatter
0.1 – 0.15 dex). Therefore even the close low-velocity
encounters cannot significantly enlarge dispersion of the observed FP.
Moreover the galaxies demonstrate large changes only within a very short time
interval (107–108 years) just before the final merger
(short relative to the evolution time of merging galaxies).
It should be noted that Hernquist’s sphere shows large parameter deviations from initial values (more than the values given above) at the very last stages of the encounter before merger () – Fig.5. We do not discuss these moments because of the short duration of these periods and the difficulty in distinguishing almost merged galaxies.
We have also considered an encounter between two galaxies embedded in dark halos. Each galaxy was composed of a spherical component, represented by a Plummer’s model, and a spherical Plummer’s halo. The mass of dark matter was set equal to the visible mass within the sphere containing 95 % of the stellar mass. The combined potential of both components was used to solve the Jeans equations and to derive the initial velocity dispersion (Hernquist 1993). Each sphere consisted of particles ( per stellar component and per halo).
The addition of an extended dark halo surrounding each galaxy makes the
effect of parameter changes less pronounced than for the experiments without
a dark halo. Amplitudes of relative changes of the parameters are:
Plummer’s sphere –
60, 25,
Plummers’s sphere with halo –
30, 15.
4 Conclusions
Our numerical experiments and observational data have shown that the global parameters of early-type galaxies are rather stable to gravitational perturbation. The FP parameters do change during close encounters but within a very short time interval (107–108 years) just before the final merger. Furthermore, the amplitudes of these changes are comparable to the scatter of the observed FP of ellipticals. There is a very small probability that we observe the system at these interaction stages. Therefore, the FP is still a good method to derive distances, even to the clusters that include a large number of interacting galaxies (e.g. van Dokkum et al. 1999).
Acknowledgements.
We acknowledge support from the ”Integration” programme (A0145). We would like to thank the referee, Dr. R. de Carvalho, for useful comments and suggestions.References
- (1) Arp, H. 1966, Atlas of Peculiar Galaxies, Pasadena
- (2) Barnes, J. & Hut, P. 1986, Nature, 324, 446
- (3) Bender, R., Burstein, D. & Faber, S.M. 1992, ApJ, 399, 462
- (4) Borne, K.D. & Hoessel, J.D. 1988, ApJ, 330, 51
- (5) Burstein, D. & Heiles, C. 1982, AJ, 87, 1165
- (6) Capelato, H.V., de Carvalho, R.R. & Carlberg, R.G. 1995, ApJ, 451, 525
- (7) Ciotti, L., Lanzoni, B. & Renzini, A. 1996, MNRAS, 282, 1
- (8) Davoust, E. & Considere, S. 1995, A&AS, 110, 19
- (9) de Carvalho, R.R. & Djorgovski, S. 1992, ApJ, 389, L49
- (10) de la Rosa, I.G., de Carvalho, R.R. & Zepf, S.E. 2001, AJ, in press (astro-ph/0104324)
- (11) Djorgovski, S. & Davis, M. 1987, ApJ, 313, 59
- (12) Dressler, A., Linden-Bell, D., Burstein, D., et al. 1987, ApJ, 313, 42
- (13) Hernquist, L. 1990, ApJ, 356, 359
- (14) Hernquist, L. 1993, ApJ, 86, 389
- (15) Hickson, P. 1982, ApJ, 255, 382
- (16) Hjorth, J. & Madsen, J. 1995, ApJ, 445, 55
- (17) Karachentsev, I.D. 1972, Catalogue of isolated pairs of galaxies in the northern hemisphere, Soobshch. Spets. Astrof. Obs 7, 1
- (18) Keel, W.C. & Wu, W. 1995, AJ, 110, 129
- (19) Levine, S.E. & Aguilar, L.A. 1996, MNRAS, 280, 13
- (20) McElroy, D.B. 1995, ApJS, 100, 105
- (21) Pahre, M.A., de Carvalho, R.R. & Djorgovski, S.G. 1998, AJ, 116, 1606
- (22) Shier, L.M. & Fischer, J. 1998, ApJ, 497, 163
- (23) Simien, F. & Prugniel, Ph. 1997a, A&AS, 122, 521
- (24) Simien F. & Prugniel, Ph. 1997b, A&AS 1126, 15
- (25) Teuben, P. 1995, ASP Conf. Ser., 77, 398
- (26) Turner, E.L. 1976, ApJ, 208, 20
- (27) van Dokkum, P.G., Franx, M., Fabricant, D. et al. 1999, ApJ, 520, L95
- (28) Vorontsov-Velyaminov, B.A. 1959, Atlas and catalogue of interacting galaxies, Sternberg Institute, Moscow State University
- (29) Zepf, S.E. & Whitmore, B.C. 1993, ApJ, 418, 72