GMRT observations of four suspected supernova remnants near the Galactic Centre
Abstract
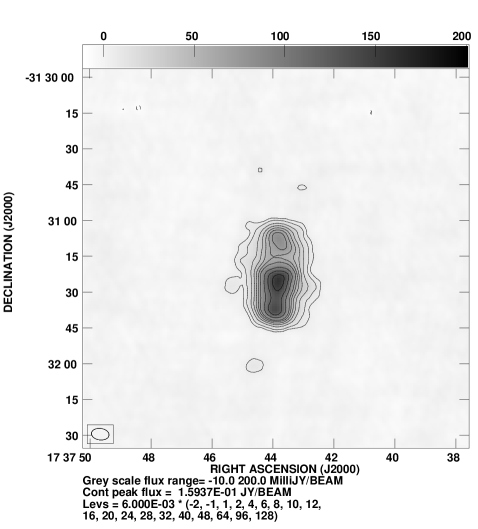
We have observed two fields - Field I (l=3.2∘, b=1.0∘) and Field II (l=356.8∘, b=0.1∘) with the Giant Metrewave Radio Telescope (GMRT) at 330 MHz. In the first field, we have studied the candidate supernova remnant (SNR) G3.10.6 and based on its observed morphology, spectral index and polarisation confirmed it to be an SNR. We find this supernova to have a double ring appearance with a strip of emission on it’s western side passing through it’s centre.
We have discovered two extended curved objects in the second field, which appears to be part of a large shell like structure. It is possibly the remains of an old supernova in the region. Three suspected supernova remnants, G356.30.3, G356.6+0.1 and G357.10.2 detected in the MOST 843 MHz survey of the Galactic Centre region appears to be located on this shell like structure. While both G356.30.3 and G356.6+0.1 seem to be parts of this shell, G357.10.2 which has a steeper spectrum above 1 GHz, could be a background SNR seen through the region. Our HI absorption observation towards the candidate SNR G357.10.2 indicates that it is at a distance of more than 6 kpc from us.
keywords:
Galaxy: center — radio lines: ISM — supernova remnants: individual (G3.10.6, G356.30.3, G356.6+0.1, G357.10.2) — techniques: interferometric1 Introduction:
Since present catalogues of SNRs are thought to be incomplete due to different sensitivities and angular resolutions of various telescopes used for surveys, the distribution of SNRs in our Galaxy is not well constrained. This problem is further compounded in the Galactic Centre (GC) region, where, there is a very complex distribution of sources. 13 SNRs had been identified within 355, region of the Galaxy before the MOST Galactic Centre survey (MGCS). The MGCS (Gray 1994b) detected another 17 candidate SNRs in the region. These detections, if confirmed, indicate the number density of SNRs in the GC region to be twice than that in the rest of the Galaxy (Gray 1994a). Confirming the SNRs from the MGCS is important as it suggests a possible correlation between the dense environment in the GC region and higher SNR density.
Shell type SNRs can be distinguished from other diffuse sources in our galaxy by their ring like morphology and non-thermal synchrotron emission which is characterised by a steep power law and polarised emission. The other class of SNRs, known as the plerions, are characterised by their filled centre or blob-like morphology, a comparatively flat spectrum and at high radio frequencies, can show a much higher linear polarisation fraction than the shell type SNRs. However, due to changing orientation of the magnetic field and large Faraday depolarisations within the sources, polarised emission is not detectable for many SNRs and therefore measurements of their low frequency flux and spectral indices are often the only way to detect synchrotron emission. The Giant Metrewave Radio-Telescope (GMRT) (Swarup et al. 1991) with it’s large collecting area and high resolution at low radio-frequencies is an ideal instrument for such studies. Systematic GMRT studies of SNRs in the Galactic Centre region are in progress (e.g., Bhatnagar 2000); and in this paper, we discuss the observations of four suspected SNRs G3.10.6, G356.30.3, G356.6+0.1 and G357.10.2 which were selected from the MGCS.
In 2 of this paper, we discuss observational strategy and calibration. The results of our observations have been described in 3, and in 4, we discuss about the morphology, spectral index, distance and other physical properties of the candidate SNRs observed by us. In 5, we present a list of compact sources seen within the field-of-view and also an estimate of their flux at various radio frequencies. We draw the conclusions in 6.
2 Observations and data reduction :
The GMRT consists of thirty antennas, each of diameter 45 metre, distributed over a region of about 25 kilometres, with fourteen of the antennas placed within a diameter of about one kilometre and the remaining arranged in 3 arms each of length 14 km, shaped as an irregular Y. This arrangement provides the necessary uv coverage for mapping both compact and extended sources. The ratio of the longest to the shortest baseline is around 500 with the shortest projected baseline being about 50 metres.
The present observations were made when the GMRT was still being commissioned and often all the 30 antennas were not available. Table 1 give details of our observations. The centre of Field II was set at l=356.8∘, b=0.1∘ so that all the 3 objects, G356.30.3, G356.6+0.1 and G357.10.2 were observed within the primary beam of the antennas (FWHM=88′ at 330 MHz). We have also carried out an HI absorption study towards G357.10.2. All the observations were carried out in the spectral line mode with 128 frequency channels, which is the default for the GMRT correlator. For the 330 MHz observations, a bandwidth of 16 MHz was used while for the 21 cm spectral line observations, which needed better frequency resolution, the total bandwidth was reduced to 4 and 2 MHz, giving a frequency resolution of 32 and 16 kHz respectively. For the 330 MHz observations, 183036 was observed initially for 20 minutes as a flux and bandpass calibrator. Long term monitoring of this calibrator at 843 MHz using MOST has shown the modulation index (ratio of the standard deviation to the mean value of the flux density from the different epochs) to be 0.016 (Gaensler & Hunstead 2000) which is well within the expected uncertainty of 15% in determining our absolute flux scale (Baars et al. 1977). From the VLA calibrator manual (Perley 2001) we have taken the flux density of this calibrator as 28 Jy at 330 MHz and 6.9 Jy at 1420 MHz. The amplitude and phase calibrators were observed every 30 minutes. For Field I, the source 183021 was used as both phase and amplitude calibrator. For Field II, the source 1822096 was observed as the amplitude calibrator and 1701299 which was nearby at the same declination as the field being observed, was used as phase calibrator. Since, at the time of these observations, automatic measurements of system temperature () were not implemented, the towards the calibrators and the SNR fields were estimated using the 408 MHz all sky map (Haslam et al. 1982) and then scaled to 330 MHz assuming a spectral index of 2.6. The measured visibilities were corrected for this variations towards various sources (the typical correction factors between the target source and the secondary calibrator was 3). In this paper, we follow the convention of F(, i.e., for steep spectral index, the magnitude of will be negative.
| Galactic coord. | RA | Dec | Frequency | Date | Observing | Available |
|---|---|---|---|---|---|---|
| of the pointing | (J2000) | (J2000) | (MHz) | time (hours) | antennas | |
| Centre (l, b) | ||||||
| 003.21.0 | 17 57 00.1 | 26 40 01 | 330 | 1999 Jun 25 | 6 | 27 |
| 356.80.1 | 17 38 11.4 | 31 42 26 | 330 | 1999 Aug 01 | 3.5 | 24 |
| 357.20.2 | 17 39 40.6 | 31 28 01 | 1420.6 | 2000 Feb 26 | 3.5 | 15 |
| 356.9+0.1 | 17 37 44.2 | 31 31 15 | 1420.3 | 2000 Oct 07 | 0.5 | 26 |
2.1 Calibration
The data were processed within AIPS using standard programs. Bad data (interference in some frequency channels, spikes and drop outs due to the electronics, etc) were identified and flagged using FLGIT. The data were also checked for bad antennas or baseline based problems which were also flagged. The spectral visibility data were bandpass calibrated. For the 330 MHz data, a pseudo-continuum database of 4 frequency channels (each of width 2 MHz) were made from the central 64 frequency channels of the observed 16 MHz band. This was adequate to avoid bandwidth smearing within the primary beam. Images of the fields were formed by Fourier inversion and Cleaning (IMAGR). The initial images were improved by self-calibration. CLEAN maps of the compact sources in the field made by using only the data with uv-distance greater than 150 were used to self-calibrate the data using CALIB with a uv-range of 0.815 k.
For a better imaging of the extended structure in the field G3.21.0, we made a high resolution map with a lower cutoff of the uv range at 400 wavelengths. The Fourier transform of the CLEAN components of the sources in this map was then subtracted from the uv data and one more map was made with no lower cutoff in the uv range. This map was then deconvolved using MEM. The CLEAN components which were subtracted earlier were added back to the resulting image to produce the final image of the SNR. This technique has typically yielded an RMS noise one and half times smaller than that obtained using the standard CLEAN. To minimise the effect of non-coplanar baselines, the high resolution CLEAN images were made for both the fields at 330 MHz using the multi-facet technique available in the newer versions of the AIPS task ’IMAGR’. However, to make the images of the field-II, the above procedure was not required and we used standard CLEAN to remove the side-lobes of the synthesised beam. All the GMRT maps presented in this paper have been corrected for the primary beam pattern of the antennas.
We have also performed an HI absorption study with the GMRT towards the candidate SNR G357.10.2 and the compact source G356.9+0.1. 1748253 was used as the phase calibrator and 3C287 as the bandpass calibrator. The bandpass pattern of the antennas change appreciably as a function of frequency. Therefore, we have not used frequency switching for the bandpass calibration, but, have chosen a bandpass calibrator (3C287) with a high Galactic latitude, so that the effect of Galactic HI absorption on it’s spectra is less than 1% (Dickey, Terzian & Salpeter 1978). We observed 183036 as the flux calibrator. The HI absorption profiles towards G357.10.2 and G356.9+0.1 were obtained using 128 frequency channels over a bandwidth of 4 and 2 MHz respectively. The resultant velocity resolution is 6.6 km.s-1 towards G357.10.2 and 3.3 km.s-1 towards G356.9+0.1. To make the channel maps, standard AIPS task (UVLSF) was used to subtract a DC term corresponding to the continuum from the visibility data. The GMRT has an FX correlator, for which ’Gibbs ringing’ due to any sharp feature in the spectrum dies away much faster (sinc2 response to a sharp pattern, which has a peak side-lobe of 5%) as compared to an XF correlator. Therefore, we have not applied any spectral smoothing to our data. Also, the variation of the line frequency introduced by the earth’s rotation during the observing period being much smaller than the frequency channel width, we have not applied any Doppler corrections.
3 Results

3.1 Field I:
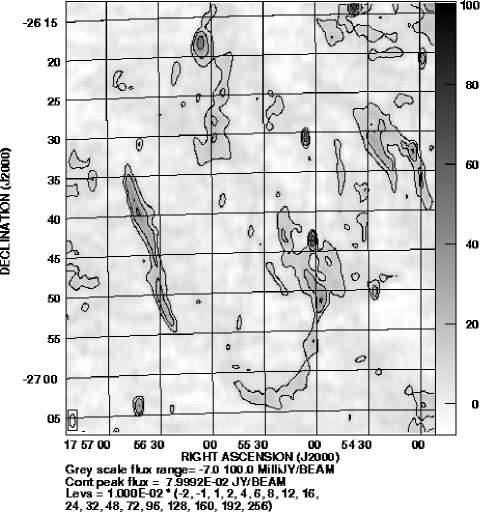
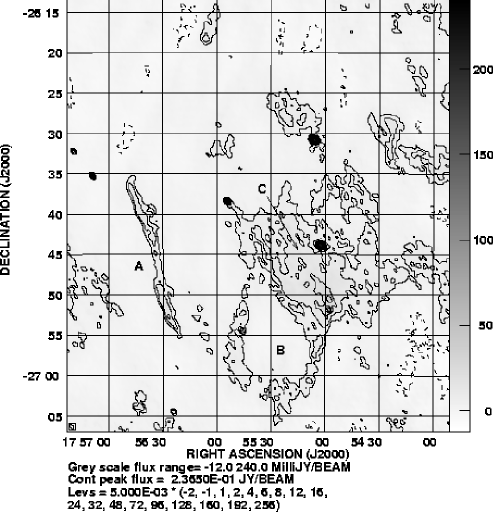
The candidate SNR G3.10.6 identified during the MOST 843 MHz survey is located in this field. In the MOST (Fig. 1) and NVSS maps (Fig. 2), which are at higher frequencies, the source appears as a collection of filamentary structures, but, in the GMRT maps at 330 MHz (Figs. 3 and 4) extended emission that connects up the filaments which form part of a shell is clearly seen even in the high resolution maps. The overall shape of the SNR is best seen in the GMRT low resolution map in Fig. 4 which shows that the radio shell is visible all around except in the northeast of the object. There is general agreement between the structures seen in the MOST and GMRT maps. However, the 330 MHz map also shows appreciable diffuse emission towards the west (feature marked C in Fig. 3). The eastern part of the shell as evident in the low resolution image (Fig. 4), seems to be quite narrow and appears like a filament in our high resolution image (feature marked A in Fig. 3). This filamentary structure is also seen in the NVSS (Condon et al. 1998) map (Fig. 2). However, the NVSS maps are produced from snapshot observations and due to a comparatively poor uv-coverage in their data, the extended structures were not properly imaged in their map. The GMRT 330 MHz maps indicate an additional small shell like feature at the southern part of the larger shell that can be clearly seen in Fig. 3 (feature marked B).
From the GMRT image, the total flux density of this object at 330 MHz is 14 3 Jy, while at 843 MHz, the flux density is reported to be 6.5 Jy (Gray 1994b). However, flux estimated from both maps can suffer from zero-spacing problems due to the large size of (28) of G3.10.6. However, the filamentary structure near the eastern side is sufficiently small (Fig. 3), so as not to suffer from any significant zero-spacing problem. The spectral index estimated for the filamentary structure is 0.620.12, which is relatively steep for an SNR. This structure shows about 20% polarisation in the NVSS map. The diffuse emission at the western part of the remnant also has a steep spectral index. We have examined the 8.35 GHz NRAO single dish map (Langston et al., 2000) of this region. Since we could not identify it, we can place an upper limit of 2 Jy for this object. Hence, the spectral index of the object is steeper than 0.64. We summarise the observed parameters of G3.10.6 in Table 2. It should be noted that the co-ordinate of this object in Table 2 is different from Gray (1994b). GMRT maps indicate that the centre of this object is located further south of the co-ordinate given for this object in Gray (1994b). From Table 2, its estimated Galactic Co-ordinate is, l=3.1∘, b=. However, as the object has already been designated as G3.10.6, following the IAU convention, we do not intend to rename it and will continue to use it’s name as G3.10.6 in the rest of this paper.
| Object | RA | Dec | Size | Type | S843MHz | S330MHz | Spectral index |
|---|---|---|---|---|---|---|---|
| name (Glb) | (J2000) | (J2000) | (′) | (Jy) | (Jy) | ||
| G3.10.6 | 17 55 40 | 26 39 30 | 2849 | Shell | 6.5 | 14 | 0.64 |
| G356.80.0 | 17 38 00 | 31 37 41 | 5272(?) | Shell | – | 30 | 0.34 |
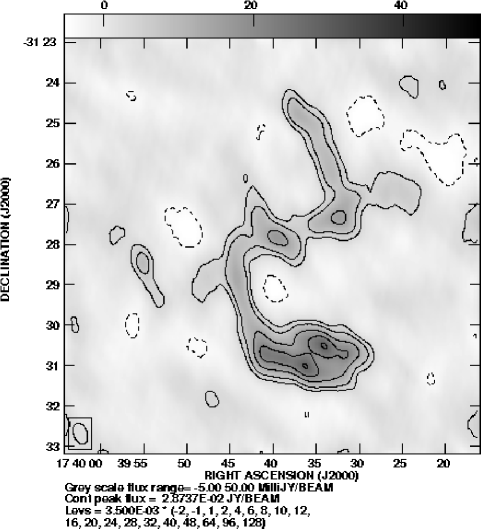
3.2 Field II:
This region has been investigated previously by Gray (1994b) using the MOST at 843 MHz. Three candidate SNRs, G356.30.3, G356.6+0.1 and G357.10.2 were reported and the MOST image of these objects are shown in Fig. 5. This field is much more complex than Field I and further there are a number of complications due to the proximity of the ’Tornado nebula’ which has a large flux density. The GMRT low resolution map of this field at 330 MHz is shown in Fig. 6. The prominent features of this field are (a) the strong source at the northeastern edge of the map which is identified with the Tornado Nebula, (b) a strong unresolved source G356.9+0.1 (RA=17h37m44.0s, Dec=31∘31′14′′ (J2000)) which with higher resolution has three components (Fig. 10) and shows a non-thermal spectrum (Table 5), indicative of a background extragalactic source and (c) two extended objects which have considerable fine structure. The large extended emission is located to the south of the extragalactic source G356.9+0.1, which appears to be curved has been detected for the first time. The other extended emission to the east of the extragalactic source coincides with the MOST candidate SNR G357.10.2, though the extent of its emission at 330 MHz is larger than that in the MOST maps This second extended source almost touches the southern emission, and they appear to be part of a single large shell, the northern part of which is missing.
It should be noted that interferometric observations which lack zero and short-spacings, can preferentially pick-up small scale structures from extended Galactic emission and hence can show structures in the map which are not genuine entities. These small scale variations in the Galactic background emission generally create structures with both positive and negative flux-densities in the map plane, which finally increases the RMS noise in the map. However, in Fig. 6, the first contour level is 0.1 Jy/beam, 5 times higher than the RMS noise and at that level, no extended region of negative flux-density can be seen. Therefore, we believe that the two extended objects seen in our map are genuine in nature.
In the absence of the northern part of the shell, we can only speculate about it’s actual extent to the north. If the conceived shell is formed by the line joining G357.10.2 with G356.6+0.1, then, the shell has a size of . However, it appears to us that the northern extent of the shell is upto the object seen at RA=17h38m00s, Dec=31∘05′, and consequently the shell has a size of centred at G356.80.0. We designate this conceived shell by its galactic co-ordinate of G356.80.0. The flux density calculated over the two extended objects at 330 MHz is 30Jy. However, this should be taken with caution since we are likely to underestimate its flux due to missing short spacings.
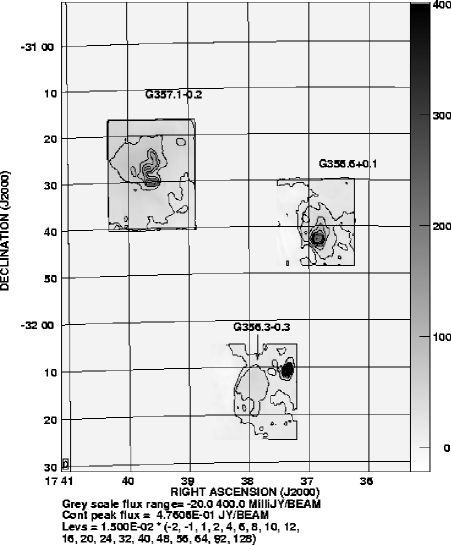
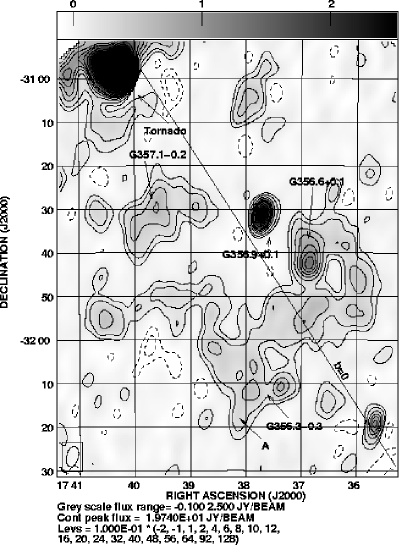
A composite of the MOST maps within this field is given in Fig. 5, along with the NVSS map of this region (Fig. 7). The MOST suffer from zero-spacing problems for objects larger than half a degree which, coupled with further dynamic range limitations due to the nearby strong source (Tornado nebula) could have resulted in their inability to image the large extended structure (G356.80.0) and to identify smaller scale structures within the extended emission as separate SNR candidates (equivalent to a ’high frequency spatial filtering’). The NVSS map of the field has serious short spacing problems and it is not surprising that the extended emission is not seen in it. Single dish maps at high frequencies do not have this problem, but since the extended emission has low surface brightness, it is often difficult to detect it. The extended emission is not seen in the 8.35 and 14.35 GHz NRAO single dish maps (Langston et al. 2000), from which we set an upper limit on the flux density of 9.4 Jy at 14.35 GHz and 10Jy at 8.35 GHz. It should be noted that Langston et al. used a median filter of size 67′ to remove the extended background emission. However, since the area enclosed by the shell is significantly smaller than the filter diameter, removing the extended background is not expected to cause any appreciable underestimation of the flux density. If we combine the 330 MHz results with the upper limits from Langston et al., we find that the spectral index of the shell like structure is steeper than 0.34. Based on the above, we suggest that G356.80.0 could be an old SNR shell, which has started breaking up near G357.10.2, possibly due to interaction with the surrounding ISM.
The observed parameters of this shell have been summarised in Table 2. We compare the observed properties of these sources at different frequencies in the discussion below.
(i) G356.30.3:
In the MOST image, this SNR
candidate appears as a circular object of size 10′.
However, the GMRT map as shown in Fig. 8,
there is no discrete source at this position. In the GMRT
low resolution map (Fig. 6), this object is located on the
extended structure, which we have interpreted as part of a
larger shell.
In the NVSS map, a small partial shell structure can be
identified (not clear in Fig. 7) near the eastern boundary
of G356.30.3 (RA=17h38m and Dec=-32∘15′), which
also coincides with the southern edge of
G356.80.0 (feature marked ’A’ in Fig. 6) in the 330 MHz
map. We suggest that the partial shell structure in the
NVSS map is due to a lack of short uv-spacings, which
results in a ’high frequency spatial filtering’ of the
feature ’A’ shown in Fig. 6.
Based on the above, we conclude that G356.30.3 is
likely to be part of the larger shell (G356.80.0) like
structure. The total flux density calculated for this object
from the MOST image after background subtraction is 2 Jy.
From the same region, the estimated flux density at 330 MHz (Fig.
6) is 1.5 Jy, and is 0.1 0.02 Jy at 1.4 GHz
(Fig. 7).
(ii) G356.6+0.1 :
This suspected SNR candidate
(Gray 1994b) appears as a
featureless elliptical emission with a central compact HII
region in the MOST image. As the extended emission
surrounding the HII region is not visible in the IRAS
images, this was classified as an SNR candidate. The GMRT
image also is similar but the extended emission seems
associated with the large shell like structure discussed
before. After excluding the HII region, we estimate a flux
density of 2.2 Jy for this source at 330 MHz. From the MOST
image, the corresponding flux density is 1.7 Jy. In NVSS,
the central HII region is visible, but the extended emission
has stripes due to the lack of shorter uv spacing
required to image it. The flux density of the central HII
region as estimated from the NVSS, the MOST and the GMRT
image do agree to within 20%, the estimated flux
density being 1.20.2 Jy at 330 MHz. As the extended
emission around the HII region has a non-thermal spectrum
and appears to be part of the large shell like structure
G356.80.0, we suggest it to be a smaller-scale structure
within G356.80.0 and not a discrete SNR. The central HII
region can well be an unrelated background object.
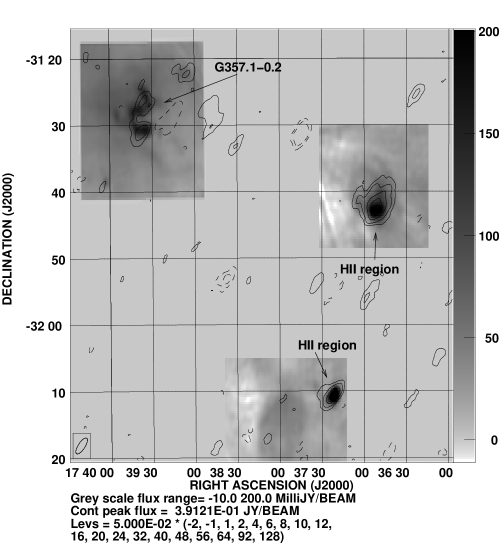
(iii) G357.10.2:
In the 843 MHz map, G357.10.2 shows a
bi-annular structure of a few arc-minutes with a halo of
emission surrounding it. In the 330 MHz low resolution
map shown in Fig. 6, the bi-annular structure is not
distinguishable, but there is an extended emission of
size 15′ at the same place. To search for this
structure, we first subtracted the strong sources in
the region from the uv data and resolved out the
extended emission by using a lower uv cutoff of 230
, while re-imaging the region. The resultant
contour map is shown in Fig. 8, where, the MOST map has
been overlaid on it in gray scale. There is indeed
seen some emission at the position of the bi-annular
structure of the MOST image (The nearby negative is the
result of missing zero-spacing flux density resulted
from our attempt of resolving out the extended emission
of size 15′). From the GMRT image, we estimate a
flux density of 0.49 0.15 Jy for this object.
From the MOST image, we estimate a flux density of 1.2
Jy at 843 MHz for this object after background
subtraction.
As noted by Gray (1994b), this region of the MOST image is suspected to be affected by the base-level fluctuations caused by the nearby strong source (Tornado nebula). As a check, we have estimated the flux density of the surrounding 15′ halo region from their 843 MHz map to be about 10 Jy. But, from the GMRT image, the estimated flux density is only 5.01.0 Jy at 330 MHz (Fig. 6). Further, the upper limit of the flux density measured from the 8.35 GHz NRAO single dish map (Langston et al. 2000) is 1.0 Jy for this region. The above measurements clearly indicate that there is a problem in explaining the flux density as measured at 843 MHz, as, neither an HII region (any significant free-free absorption at 330 MHz can be ruled out) nor a mixture of thermal and non-thermal emission can explain the estimated flux density at 843 MHz. Therefore, it seems that the flux density measurements of this region from the MOST image is badly affected by the background uncertainty and hence we have not used the flux density of 1.2 Jy calculated for the bi-annular structure at 843 MHz any further in this paper.
From our HI data of this source we have made a continuum map using the line free channels (Fig. 9) which gives us a flux density of 0.670.1 Jy for this object at 1.4 GHz. From the NVSS map at 1.4 GHz (Condon et al. 1998), the estimated flux density is 0.450.03 Jy. To resolve this difference, we re-mapped the same region by using the calibrated uv data of the NVSS (available in the web). The estimated flux density for this object after applying the primary beam correction is found to be 0.7 0.1 Jy, in agreement with our measurement.
This source has also been observed by Gray (1996) using the VLA at 5 GHz (DnC array) and 1.4 GHz (CnB array). This object shows several filamentary structures. Between 5 and 1.4 GHz, most parts of the structure show a spectral index of 0.5, though, there is a variation of spectral index from 0.3 to 0.6. The structures seen at 5 GHz are highly polarised and display a polarisation fraction of upto 60% (Gray 1996). Therefore, the emission mechanism from the source is synchrotron in origin. We further discuss it’s properties in the following sections.


3.3 HI absorption towards G357.10.2 :
In Fig. 11 is shown the normalised spectra of the source, where, the y-axis represents the estimated absorption (, where, is the optical depth). Within 20 km.s-1 of the LSR velocity, the RMS noise is 0.07 of the absorption profile (i.e., ), but, for the frequency channels located outside the above LSR velocity range, the RMS noise is 0.035. The HI emission from the Galactic plane increases the system temperature for the frequency channels located within 20 km.s-1 of the LSR velocity, causing an increase in the RMS noise for the frequency channels located in the above range. In our map of G357.10.2, HI emission was also found to increase the confusion limit for the frequency channels located within the above velocity range. To reduce the effect of HI emission from the extended structure along the line-of-sight gas, we applied a lower uv cutoff of 500 before imaging the spectral-line uv data. We have also tried to identify any small scale HI emission associated with this source from our line maps. However, no evidence was found in this regard. The source G357.10.2 is seen in absorption near the LSR velocity 10 and 62 km.s-1. The absorption near the 62 km.s-1 arises from the ’3 kpc arm’ (for which 60 km.s-1) indicating that this source is located at least at a distance of more than 6 kpc from us (The GC is 8.5 kpc away from us). The absorption near the 10 km.s-1 is quite narrow with the velocity width (FWHM) 28 km.s-1 (Fig. 11). For comparison, we have also observed the compact object G356.9+0.1 located near the centre of our 330 MHz map, in HI absorption at 1420 MHz. This object appears to have three components in our high resolution 1.4 GHz continuum map (Fig. 10) and is likely to be an extragalactic source. The absorption spectra towards this source is shown in Fig. 12 (the RMS noise in the spectra is 0.02 for the frequency channels located within , and is 0.01 outside this range.). As expected, this object is seen in absorption against the ’3 kpc arm’. At LSR velocity of 33 km.s-1, one more absorption line can be seen against this source which is not observed towards G357.10.2. The HI absorption profile shows a large velocity width (FWHM 40km.s-1) near the LSR velocity of 0 km.s-1 towards this object.
Similar broad absorption features have been observed for the extragalactic sources seen through the Galactic Centre region, e.g., 1748253, G0.537+0.26 (Dickey et al. 1983) and G359.87+0.18 (Lazio et al. 1999) which are believed to be caused by an anomalous velocity cloud located behind the Galactic Centre. As the absorption FWHM towards G357.10.2 is significantly lower as compared to G356.9+0.1, we think that this object is likely to be a galactic source. However, the full width of absorption towards this object is quite similar to G356.9+0.1, which suggests that G357.10.2 may be embedded within the +ve velocity cloud located behind the Galactic Centre, which gives rise to much deeper absorption profile towards G356.9+0.1 because of the longer line of sight towards this extragalactic source.
4 Discussions:
4.1 G3.10.6 (Field I):
4.1.1 Distance:
From the present observations, only the -D relation can be used to estimate it’s distance. We used the modified -D relation ( W.m-2.Hz-1.sr-1) by Case & Bhattacharya (1998), which is expected to yield distance to individual SNRs with an error 40%. Using a flux density of 6 Jy for this object at 1 GHz and a diameter of 39′, we estimate a distance of 7.7 kpc for this object, which indicates that it can even be located near the Galactic Centre region.
It should be noted that the -D relation is essentially derived by assuming the environments of the SNRs into which expansion occurs are similar. It is believed that the -D relation overestimates the diameter of SNRs located at higher Galactic latitudes (Caswell & Lerche 1979). This phenomenon is thought to be related with intrinsic decrease of the surface brightness of the SNRs due to a lowering of magnetic field at higher Galactic latitudes. However, the magnetic field in the GC region is expected to be much higher than the Galactic disk, which can result in a higher intrinsic surface brightness of the SNRs in the region. Hence, the use of -D relation to estimate the distance or linear-diameter of the SNRs located in the GC region can result in underestimating these parameters. For example, the distance estimated by using the -D relation (Case & Bhattacharya 1998) for the SNR Sgr A East (G0.0+0.0) is 3.3 kpc. However, it is thought to be actually located behind the GC (i.e., at a distance of 8.5 kpc) (Pedlar et al. 1989).
4.1.2 Morphology:
G3.10.6 shows two ring like structure in our high resolution map with the smaller ring being located towards the south. Possible explanations of the observed morphology are (a) the SNR itself is the combination of two separate objects, (b) this morphology could be a result of the expansion of the supernova blast-wave into a cavity having a bi-annular structure created by stellar winds of the progenitor system, (c) the ISM in which the SNR expands has structures which are responsible for such a morphology.
Given the high density of SNRs in the Galactic Centre region, the suggestion that two SNRs lie close to each other is not unreasonable. There are at present 15 known SNRs within the central 50 square degree area of the Galactic Centre region and the probability of the centre of one the SNRs to be within 0.5∘ of another is 7.5%, which is not negligible. This hypothesis can be discarded if the two shells can be shown to have different distances, ages or spectral index. The spectral indices estimated from the 330 MHz and the 843 MHz map for the two shells are not very different and we cannot rule out the two SNR hypothesis, though, we prefer the case of an anisotropic ISM as described below.
It is now known that the slow wind from the red super-giant star (RSG) possess axial symmetry (Blondin, Lundqvist & Chevalier 1996). Manchester (1987) proposed that expansion of an SNR into such a medium can produce a double ringed morphology. Gaensler, Manchester & Green (1998) have shown for the SNR G296.80.3, the asymmetric cavity as created by the RSG wind of the progenitor star has a typical size of 5 pc. However, if G3.10.6 is placed at a distance of 7 kpc, it would have a linear size of 80 pc. Therefore, RSG wind can be ruled out as one of the possible reason for the double ring structure.
Finally, we consider the case of an anisotropic ISM being responsible for the shape of the SNR. It has been argued that the SNRs G166.0+04.3 (VRO 42.05.01) (Pineault, Landecker & Routledge 1987), G350.002.0 (Gaensler 1998) and G296.80.3 (Gaensler et al. 1998) represents the case of a supernova shock re-energising a tunnel and then propagating on to the other side to form a second shell. We find that the morphology of the SNR G3.10.6 can also be explained on the basis of the above model. In order to explain the model, we depict the main two ring structures in a schematic diagram as shown in Fig. 13.
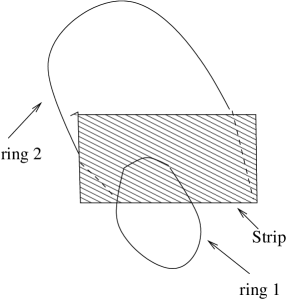
(i) There is a smaller ring of emission (’ring 1’), which in the absence of the other structures would appear as a typical SNR (feature B in Fig. 3.). (ii) A strip of emission running west from the eastern side of the SNR (feature marked C and the weak emission towards the eastern edge of Fig. 3) which, we suggest corresponds to a tunnel of much lower density. On encountering such a region, an expanding shock will energise it, rapidly propagating both across the tube and up and down it’s length. As this process continues, electrons in the walls are shock-accelerated and emit synchrotron radiation (Pineault et al. 1987) giving a linear structure as observed here. This is quite similar to the case of the SNR G296.80.3. (iii) A comparatively larger ring (’ring 2’), located north of ring 1 (corresponding to the large ring structure in Fig. 4). Ring 2 is fainter than ring 1 (as seen in Fig. 3) and extends much beyond the boundary of the ring 1 in the north. This ring has a poorly defined outer edge especially towards the north, which suggests that it represents a region of break-out into an adjacent cavity. This cavity itself could have been created in the past by some other energetic phenomena. In this case, the shock after being re-energised in the low density tunnel, will expand rapidly to take the shape of the cavity (Braun & Strom 1986). For the SNRs G166.0+04.3 (VRO 42.05.01) and G350.002.0, all the above three components are located in the plane of the sky. Whereas for G296.80.3, the explosion site, the low density tunnel and the second shell all lie roughly along the line of sight. We suggest that SNR G3.10.6 may be quite similar to the case of G296.80.3 (Gaensler et al. 1998), where all the three components lie along the line of sight.
4.1.3 Spectral index and polarisation:
Non-thermal steep spectral index, polarised emission and shell morphology clearly identifies G3.10.6 to be a shell type SNR. The detection of polarised emission suggests that the magnetic field in the region is well organised. It also indicates that the maximum rotation measure is less than 1000 rad m-2 towards the SNR along the line of sight of medium.
4.2 G356.80.0 (Field II):
There are two extended curved emission seen in the map of this region. Following the discussion in 3.2, both of these objects appears to be part of a single large shell named as G356.80.0. Its non-thermal spectral index and a partial shell like morphology suggests the large shell like structure to be of an old SNR. However, due to its low surface brightness, its flux density at higher frequencies are poorly determined. As a result, its spectral index () is not well constrained.
With the available data, only the -D relation can be used to estimate it’s distance. With an assumed spectral index of 0.5, the estimated flux density of this object is 20 Jy at 1 GHz. The modified -D relation as developed by Case & Bhattacharya (1998), yields an estimated distance of 4.4 kpc for this SNR candidate. However, due to the short-spacing problem and the inherent uncertainty in the -D relation itself, this distance may be uncertain by as much as a factor of three. The large shell shows kinks at different places and also seems to have broken up near G357.10.2, suggesting it to be an old SNR. Assuming an expansion velocity of 50 km.s-1 and it’s angular size of 60′ at a distance of 4.4 kpc, we use the Chevalier (1974) formula t=1.5 x 10⁵ D v-1 to estimate it’s probable age. The calculated age is 2.4 years.
| Galactic | RA | Dec | Size | S1.4GHz | S330MHz | Spectral | Spectral |
| Coords () | (J2000) | (J2000) | (′) | (Jy) | (Jy) | Index | Index |
| (5/1.4) | (1.4/0.330) | ||||||
| 357.10.2 | 17 39 38 | 31 28 57 | 87 | 0.67 | 0.49 | 0.5 | 0.2 |
4.3 Bi-annular source G357.10.2 (Field II):
The flux density of this object at 330 MHz along with it’s flux density measured at 1.4 GHz shows a slightly inverted spectral index of +0.2 0.2. However, between 5 and 1.4 GHz, it has a spectral index of 0.5. This indicate a break in it’s spectral index near 1 GHz with a difference of 0.7 between it’s high and low frequency spectral index. The peculiar morphology makes it difficult to draw unique identification for this object. Highly polarised emission at 5 GHz, however, shows the emission to be non-thermal in nature. As noted by Gray (1996), this object can be identified with (i) an extragalactic source, (ii) filamentary structure as seen close to the GC or (iii) a Crab like SNR. Compact cores of extragalactic sources often show a flat spectral index, which turns over at low radio-frequencies 100 MHz due to the synchrotron self-absorption. However, the extended components have a steep spectral index and shows relatively low level of absorption only at very low frequencies. As this object is extended, our determination of a turn over of it’s spectra below 1 GHz argues against the object being a typical extragalactic source. Also, it’s HI absorption spectrum suggests it to be galactic. Filaments near the Galactic Centre have not been reported to show any spectral break and therefore, it is unlikely to be a Galactic Centre filament. Within the observational error, this object has a flat or slightly inverted spectrum at low radio frequencies. A slightly inverted spectrum, if correct, can be a result of line of sight free-free absorption by diffuse foreground HII region. We argue below that optical depth () due to free-free absorption can’t be more than 0.2 at 330 MHz towards this object.
(i) Any line of sight structure of size larger than 40′ will get resolved out in our map. However, we can estimate the free-free absorption coefficient by using the 408 MHz map of Haslam et al. (1982), which gives a sky temperature of 440 K in this region at 408 MHz. An extended HII region will typically have an electron temperature (Te) greater than 4000 Kelvin, indicating 0.11 at 408 MHz, which is equivalent to 0.17 at 330 MHz.
(ii) HII region of size 40′ and optical depth 0.001 should be visible in our map above the noise level. As nothing of that sort is visible, we can rule out any perceptible line of sight absorption by a moderate size HII region. (The 15′ extended structure around the bi-annular source shows a non-thermal spectrum and from it’s emission measure at 8.35 GHz, the estimated optical depth due to free-free absorption at 330 MHz is found to be negligible.)
(iii) The bi-annular structure itself is unlikely to have any associated HII region. It was selected as a candidate SNR due to it’s low IR/Radio luminosity (Broadbent, Osborne & Haslam 1989). We estimate a flux density of 400 MJy/sr from the surrounding region at 60 IRAS map. Extended HII region generally shows a ratio of 700 for the IR/Radio luminosity (Broadbent et al. 1989), which also indicate 0.1.
Hence, the change in spectral index for this object seems to be intrinsic in nature. Breaks in spectral indices were earlier observed for a few Galactic SNRs like Cygnus loop and HB9 (Denoyer 1974), S147 (Kundu et al. 1980), G33.20.6 (Reich 1982), 3C58 (Green 1994) G76.9+1.0 (Landecker et al. 1997). However, only S147, G33.20.6 and G76.9+1.0 show break at metre wavelengths. From its irregular morphology and the spectral break, we suggest that G357.10.2 may be a Crab like SNR. The pulsar B1739030 is located 2′ away, but, there is no indication that it is associated with this object.
It is also possible that G357.10.2 is associated with the large suspected SNR which we have named as G356.80.0. G357.10.2 shows HI absorption by the 3 kpc arm. This implies a distance of more than 6 kpc from us for this object. The distance of the large SNR G356.80.0 could also be similar ( 4.4 kpc from -D relation). However, the large SNR apparently being a shell type remnant (expected spectral index 0.5), an association with an object of different spectral type seems unlikely. We suggest that G357.1-0.2 may be a crab like SNR, where the energy transfer from the pulsar has stopped in the past, giving rise to a steeper spectral-index at the higher radio-frequency. The estimated parameters for G357.10.2 are summarised in Table 3.
| Name | RA | DEC | Peak | Total (0.33 GHz) | Total (1.4 GHz) | Distance | Comment |
|---|---|---|---|---|---|---|---|
| (J2000) | (J2000) | (Jy/Beam) | (Jy) | (Jy) | from centre | ||
| (′) | |||||||
| 17 54 02.0 | -27 12 02 | 0.030 | 0.056 | 0.003 | 50.9 | ||
| 17 55 06.6 | -27 13 13 | 0.056 | 0.102 | 0.0137 | 41.6 | ||
| 17 56 38.5 | -27 24 56 | 0.055 | 0.120 | 0.038 | 45.1 | Double | |
| 17 56 46.3 | -27 22 38 | 0.067 | 0.095 | 0.019 | 42.7 | ||
| 17 55 52.6 | -27 15 45 | 0.236 | 0.405 | 0.120 | 38.6 | TX=0.397 | |
| 17 54 40.9 | -27 05 56 | 0.026 | 0.032 | 0.0014 | 40.3 | Pulsar ? | |
| 17 57 54.5 | -27 20 46 | 0.025 | 0.023 | 0.011 | 42.5 | ||
| 17 57 00.7 | -27 12 15 | 0.035 | 0.053 | 0.0086 | 32.2 | ||
| 17 54 26.1 | -26 50 26 | 0.046 | 0.068 | 0.012 | 35.8 | ||
| 17 56 23.8 | -27 04 29 | 0.030 | 0.060 | 0.010 | 25.7 | ||
| 17 56 55.8 | -27 07 26 | 0.057 | 0.070 | 0.021 | 27.4 | ||
| 17 54 57.7 | -26 51 46 | 0.023 | 0.034 | 0.012 | 29.6 | ||
| 17 56 42.6 | -27 03 55 | 0.051 | 0.135 | 0.038 | 24.1 | ||
| 17 55 45.9 | -26 54 15 | 0.019 | 0.021 | 0.007 | 21.7 | ||
| 17 57 28.1 | -27 05 18 | 0.009 | 0.010 | 0.0014 | 26.0 | ||
| 17 53 48.5 | -26 35 49 | 0.033 | 0.059 | 0.008 | 42.9 | ||
| 17 55 02.2 | -26 43 48 | 0.093 | 0.203 | 0.030 | 26.5 | Double | |
| 17 57 36.7 | -27 01 57 | 0.012 | 0.020 | 0.001 | 23.4 | ||
| 17 54 03.8 | -26 32 22 | 0.056 | 0.064 | 0.011 | 40.0 | ||
| 17 58 46.6 | -27 08 34 | 0.019 | 0.032 | 0.014 | 37.1 | ||
| 17 57 14.2 | -26 56 25 | 0.010 | 0.018 | 0.0016 | 16.7 | ||
| 17 57 05.2 | -26 53 59 | 0.007 | 0.005 | 0.004 | 14.0 | ||
| 17 57 26.4 | -26 52 11 | 0.018 | 0.048 | 0.007 | 13.5 | Double | |
| 17 55 53.5 | -26 38 22 | 0.033 | 0.043 | 0.014 | 14.8 | NV=0.004 | |
| 17 55 05.6 | -26 30 39 | 0.136 | 0.157 | 0.026 | 27.1 | NV=0.015 | |
| 17 53 59.1 | -26 20 58 | 0.065 | 0.096 | 0.003 | 44.7 | Pulsar ? | |
| 17 57 08.8 | -26 35 10 | 0.030 | 0.028 | 0.004 | 5.43 | ||
| 17 54 37.6 | -26 13 47 | 0.099 | 0.240 | 0.042 | 41.2 | Double, NV=0.019 | |
| 17 57 19.2 | -26 32 13 | 0.016 | 0.018 | 0.003 | 8.93 | ||
| 17 57 43.8 | -26 31 59 | 0.055 | 0.072 | 0.024 | 12.7 | ||
| 17 58 02.5 | -26 29 27 | 0.070 | 0.105 | 0.031 | 17.5 | ||
| 17 57 45.7 | -26 23 08 | 0.010 | 0.013 | 0.002 | 19.7 | ||
| 17 59 52.6 | -26 38 59 | 0.013 | 0.016 | 0.001 | 38.6 | Pulsar ? | |
| 17 59 59.1 | -26 38 12 | 0.038 | 0.058 | 0.020 | 40.1 | ||
| 17 59 12.0 | -26 30 22 | 0.015 | 0.019 | 0.048 | 31.1 | ||
| 17 58 13.1 | -26 22 10 | 0.178 | 0.210 | 0.054 | 24.2 | ||
| 17 55 19.4 | -25 57 17 | 0.040 | 0.120 | 0.050 | 48.3 | Double, NV=0.005 | |
| 17 57 49.4 | -26 13 06 | 0.013 | 0.010 | 0.002 | 29.1 | ||
| 17 57 27.5 | -26 09 59 | 0.011 | 0.022 | 0.001 | 30.6 | ||
| 17 55 09.6 | -25 51 34 | 0.029 | 0.039 | 0.0015 | 54.3 | Pulsar ? | |
| 17 58 59.2 | -26 20 05 | 0.091 | 0.174 | 0.058 | 33.3 | Double | |
| 17 57 22.1 | -26 07 23 | 0.018 | 0.026 | 0.003 | 33.0 | ||
| 17 58 55.1 | -26 09 40 | 0.016 | 0.025 | 0.007 | 39.8 | ||
| 17 59 54.9 | -26 07 49 | 0.026 | 0.027 | 0.012 | 50.7 |
| Name | RA | DEC | Peak | Total | Total | Total | Distance from | Comment |
|---|---|---|---|---|---|---|---|---|
| (J2000) | (J2000) | (0.33 GHz) | (1.4 GHz) | (5 GHz) | Centre | |||
| (Jy/beam) | (Jy) | (Jy) | (Jy) | (′) | ||||
| 17 35 40.4 | -32 18 54 | 0.606 | 1.31 | 0.397(NV) | 0.114 | 48.5 | TX=1.01 | |
| 17 34 06.2 | -32 04 52 | 0.129 | 0.26 | 0.032 | 0.0062 | 56.5 | TX=0.286 | |
| 17 36 42.5 | -32 00 23 | 0.076 | 0.139 | 0.005 | 0.005 | 26.2 | Double | |
| 17 35 25.2 | -31 48 49 | 0.140 | 0.184 | 0.061 | 0.015 | 35.9 | ||
| 17 37 02.2 | -31 59 12 | 0.033 | 0.055 | 0.0015 | — | 22.2 | ||
| 17 36 59.5 | -31 56 43 | 0.073 | 0.16 | 0.21(NV) | 0.0083 | 20.7 | Double | |
| 17 34 59.3 | -31 32 00 | 0.042 | 0.073 | 0.031 | — | 42.0 | ||
| 17 40 13.4 | -32 13 08 | 0.206 | 0.33 | 0.042 | — | 40.2 | ||
| 17 38 01.6 | -31 51 26 | 0.069 | 0.081 | 0.047 | 14.4 | 9.37 | ||
| 17 39 02.0 | -31 48 53 | 0.035 | 0.065 | 0.001(NV) | — | 12.6 | ||
| 17 36 26.3 | -31 26 05 | 0.295 | 0.415 | 0.18 | 0.026 | 27.5 | TX=0.739 | |
| 17 36 23.0 | -31 25 09 | 0.046 | 0.067 | 0.0185 | — | 28.7 | ||
| 17 36 09.6 | -31 19 58 | 0.084 | 0.102 | 0.028 | — | 34.3 | ||
| 17 37 44.0 | -31 31 14 | 1.837 | 3.75 | 2.24 (NV) | 0.487 | 12.5 | TX=3.50 | |
| 17 38 29.7 | -31 33 12 | 0.044 | 0.043 | 0.002 | — | 10.0 | Pulsar ? | |
| 17 40 36.2 | -31 45 06 | 0.098 | 0.140 | 0.043 | — | 30.9 | ||
| 17 40 03.0 | -31 38 29 | 0.033 | 0.042 | 0.002 | — | 24.1 | ||
| 17 39 24.5 | -31 31 07 | 0.069 | 0.060 | 0.0015 | — | 19.2 | Pulsar | |
| 17 37 22.6 | -31 12 07 | 0.043 | 0.046 | 0.018 | 0.005 | 31.9 | ||
| 17 38 09.4 | -31 08 06 | 0.206 | 0.301 | 0.154 | 0.02 | 34.2 | ||
| 17 41 26.4 | -31 23 25 | 0.312 | 0.470 | 0.222 | — | 45.6 | TX=0.369 | |
| 17 41 47.3 | -31 25 07 | 0.144 | 0.201 | 0.047 | — | 49.0 | ||
| 17 41 29.2 | -30 57 29 | 0.093 | 0.12 | 0.085 | 0.020 | 61.7 |
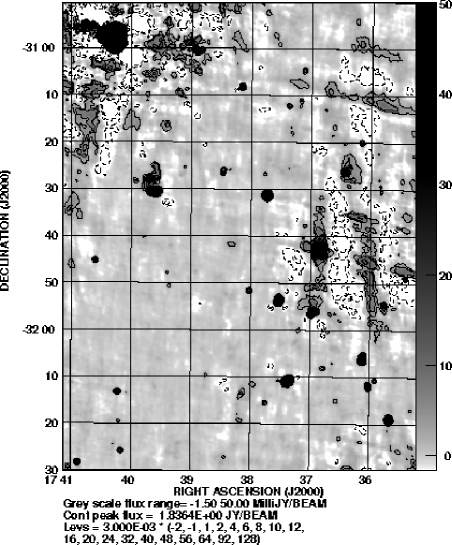
5 Compact sources in the field of view:
Our 330 MHz maps allow us to image compact sources in the field of view. The sources were searched from our high resolution (beam-size ) maps of the two fields. A total of 44 sources have been identified from the field G3.21.0, and 23 sources from the field G356.80.1. Due to twice better sensitivity in the map of the first field, we could detect almost a factor of two higher number of sources in the field G3.21.0. We have presented the parameters for the sources in Table 4 for the field G3.21.0 and in Table 5 for the field G356.80.1. In Table 4, (Field centred at l=3.2, b=1.0) column-1 shows the Galactic Co-ordinate of the object, columns 2 and 3 give the Right Ascension and Declination (J2000) of the object respectively and columns 4 and 5 give the peak and total flux density at 330 MHz. Column 6 gives the total flux density of the object at 1.4 GHz. Column-7 lists the distance of the object from the pointing centre of the fields and column-8 gives any comments about the source. In the last column (Comments), ’TX’ denotes the flux of the object as measured by the Texas Survey at 365 MHz. The flux density of these sources at 1.4 and 5 GHz have been quoted from the VLA Galactic plane survey (Becker et al. 1994; Helfand et al. 1992; Zoonematkermani et al. 1990), along with the NVSS map at 1.4 GHz. NVSS observations being of much higher sensitivity than the Galactic Plane survey, many sources from our map which are absent in the Galactic Plane survey were found to have counterpart in the NVSS map. Also, to estimate flux density for the extended sources, we have preferred the NVSS maps to minimise any zero-spacing problem. The sources for which the 1.4 GHz flux is quoted from the NVSS, an entry of ’(NV)’ is given beside the numerical value of the total flux density. For Table 5 (field centred at l=356.8, b=0.0), the columns 1 to 6 have the same meaning as above. However, column-7 indicates the source flux density at 5 GHz and column-8 indicates the distance of the object from the pointing Centre. Column-9 shows any comments about the objects. In Table 5, the 1.4 GHz flux is estimated for most of the objects from the NVSS map. The sources for which the 1.4 GHz flux density have been quoted from the Galactic plane survey, the corresponding NVSS flux has been given in the last column (Comments) by ’NV=flux’. The Galactic plane survey being of intrinsically higher resolution, we have compared the source positions in both of our 330 MHz maps with respect to the above survey. The typical positional error of the sources were found to be 4-5, part of which is caused by systematic offset for all the sources.
The flux density quoted for the sources in our list can be affected by two kinds of errors. The first is due to an error in the absolute flux density scale, where, all the sources will be affected by this error. We expect, the error in our flux density scale to be within . The second kind of error in the flux of the objects can be caused by the primary beam pattern of the antennas. Though, our maps have been corrected by multiplying the maps by the inverse of the primary beam pattern, any error in pointing and in determining the primary beam pattern will persist. Only the sources which are located near the FWHM (88′ at 330 MHz) or beyond will get seriously affected by this type of an error. In our list of sources, the objects which are located close or beyond the FWHM of the antennas can have an estimated flux density which may be off even by 2040% of their absolute flux due to this error. Hence, the flux density for these sources should be treated with caution.
Most of the sources in our list show a non-thermal steep spectral index and is expected to be background extragalactic sources. A few sources having non-thermal spectra also have a double-lobed morphology. These sources are almost certainly to be extragalactic. Four sources from Field I (G2.6030.774, G3.1700.260, G3.5721.551 and G3.7270.240) (Table 4) and one source from Field II (G356.9650.074) (Table 5) appears to be compact and have a spectral index steeper than 1.9. We classify these sources as possible pulsar candidates.
6 Conclusions
Our observations of four suspected supernova remnants close to the Galactic Centre region have resulted in:
(a) Confirmation that G3.10.6 (Gray 1994b) is supernova remnant. This was the largest suspected SNR (28) detected during the Molonglo Galactic Centre survey. We estimate a steep spectral index of 0.64 for this object. In the NVSS map, the narrow filamentary part at the eastern region of the shell is found to be polarised upto a level of 20%. This indicate an ordered magnetic field in the region and also implies a limit on the RM along the line-of-sight medium to be 1000 rad m-2. The -D relation indicates a probable distance of 7.7 kpc from us for this object. The object has a two shell morphology which we interpret as due to expansion of the SNR into an anisotropic ISM.
(b) The detection of two curved extended structures in the Field II, which appears to be part of a large shell like structure (size ) centred at G356.80.0, and having a total flux density of 30 Jy at 330 MHz. A comparison of our map with single dish maps at 8.35 and 14.35 GHz constrains it’s spectral index to be steeper than 0.34. The shell type morphology and a non-thermal spectral index suggest it to be a supernova remnant. Observations at even lower frequency is recommended to better constrain it’s spectral index. Using -D relation, a probable distance of 4.4 kpc has been estimated for this object. It appears to be a very old supernova remnant.
(c) We find that the three previously suspected supernova remnants, G356.6+0.1, G356.30.3 and G357.10.2 (Gray 1994b) are located on an extended object, which appears to be part of a large shell as described above. We suggest that G356.6+0.1 and G356.30.3 are actually parts of this large shell which were accidentally identified as separate objects in the MOST survey.
(d) The peculiar morphology and the spectral index of the object G357.10.2 suggests that it is a separate supernova remnant along the same line of sight of the large shell (G356.80.0). It appears to be a plerionic type of supernova remnant with a spectral break around 1 GHz and is located at a distance of more than 6 kpc from us.
Acknowledgements
We thank Andrew Gray and Sanjay Bhatnagar for useful discussions. Andrew Gray provided us the MOST images of the four suspected SNRs. We also thank Govind Swarup and Jayaram Chengalur who read the manuscript of this paper and made useful comments. Finally, we thank the staff of the GMRT that made these observations possible. GMRT is run by the National Centre for Radio Astrophysics of the Tata Institute of Fundamental Research.