NEW RESULTS FROM CHANDRA
We discuss two themes from Chandra observations of galaxies and clusters. First, we describe the effects of radio-emitting plasmas or “bubbles”, inflated by active galactic nuclei, on the hot X-ray emitting gaseous atmospheres in galaxies and clusters. We describe the interaction of the “bubbles” and the X-ray emitting gas as the buoyant bubbles rise through the hot gas. Second, we describe sharp, edge-like surface brightness structures in clusters. Chandra observations show that these features are not shock fronts as was originally thought, but “cold fronts”, most likely the boundaries of the remaining cores of merger components. Finally, we present recent observations of M86 and NGC507 which show similar sharp features around galaxies. For M86, the sharp edge is the boundary between the galaxy’s X-ray corona and the Virgo cluster gas. The structures around NGC507, the central galaxy in a group, could be relics of galaxy formation or may reflect the motion of NGC507 in the larger potential of the group.
1 Introduction
Like a hell-broth boil and bubble
Fire burn and cauldron bubble
Macbeth – Act 4 Scene 1
With its first images, the Einstein Observatory changed our view of clusters and galaxies. In clusters we saw rich substructure reflecting complex gravitational potentials and double clusters, systems in the process of merging on a time scale of yrs. Elliptical galaxies, rather than being gas poor, were found to have significant and extensive hot atmospheres. ROSAT and ASCA continued the revolution with studies of cluster merging and substructure including Coma, A2256, A754, Cygnus A, Centaurus, A1367,and Virgo, to mention just a few.
Chandra’s high angular resolution has brought us a new view of old friends – early type galaxies and clusters of galaxies – that we thought we knew pretty well. We are familiar with the ingredients, galaxies, radio emitting plasma, hot gas, and dark matter. The recipe is simple – mix vigorously. With these simple instructions we find new and unexpected phenomena in the Chandra observations.
2 The Radio—X-ray Connection – or Bubbles, Bubbles Everywhere
Prior to the launch of Chandra, ROSAT observations of NGC1275 and M87 provided hints of complex interactions between radio emitting plasmas ejected from AGN within the nuclei of dominant, central cluster galaxies. With the launch of Chandra, the interaction between the radio emitting plasma and the hot intracluster medium (ICM) has been observed in many systems and now can be studied in detail.
2.1 Hot Plasma Bubbles in Cluster Atmospheres
One of the first, and clearest, examples of the effect of plasma bubbles on the hot intracluster medium was found in the Perseus cluster around the bright active, central galaxy NGC1275 (3C84). First studied in ROSAT images, the radio emitting cavities to the north and south of NGC1275 are clearly seen in the Chandra images with bright X-ray emitting rims surrounding the cavities that coincide with the inner radio lobes. For NGC1275/Perseus, the radio lobes are in approximate pressure equilibrium with the ambient, denser and cooler gas and the bright X-ray rims surrounding the cavities are softer than the ambient gas. Therefore, the radio cavities are not likely to be a major source of shock heating and hence, energy input. The central galaxy in the Hydra A cluster also harbors X-ray cavities associated with radio lobes that also show no evidence for shock heating. Both sets of radio bubbles, being of lower density than the ambient gas, must be buoyant.
The Chandra images of Perseus/NGC1275 also suggest the presence of older bubbles produced by earlier outbursts. These older bubbles appear as X-ray surface brightness “holes”, but unlike the inner bubbles, these outer holes show no detectable radio emission, suggesting that the synchrotron emitting electrons may have decayed away leaving a heated, plasma bubble. Such bubbles, with no attendant radio emission, are seen by Chandra in the galaxy groups HCG62 and MKW3s.
2.2 Bubbles In A Galaxy Atmosphere – M84
The examples above focus on the radio–X-ray connection around central galaxies in clusters and groups. These galaxies are clearly the brightest cluster members and occupy a special position in the cluster gravitational potential. However, a notable example of the influence of radio plasma on the X-ray emitting gas in a more typical early-type galaxy is M84 (NGC4374), an E1 galaxy, within, but not at the center, of the core of the Virgo cluster.
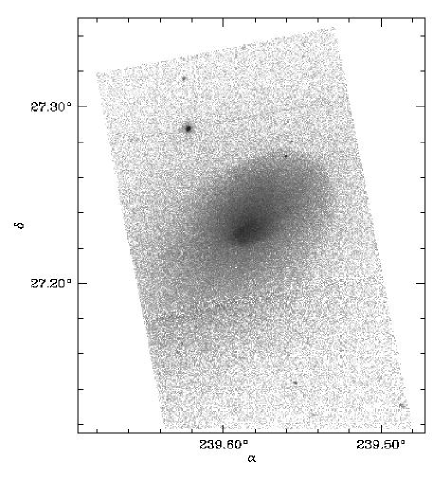
Finoguenov & Jones found a very complex structure in the X-ray emitting gas around the Virgo galaxy M84 (NGC4374) whose unusual X-ray morphology is explained by the effect of the radio lobes on the hot gas. Fig. 1 shows the strong influence of radio bubbles on the X-ray emitting gas distribution. The X-ray emission appears -shaped, with a bar extending east-west with two nearly parallel filaments perpendicular to this bar. The complex X-ray surface brightness distribution arises from the presence of two radio lobes (approximately north and south of the galaxy) that produce two low density regions surrounded by higher density X-ray filaments. As with Perseus/NGC1275 and Hydra A, the filaments, defining the -shaped emission, have gas temperatures comparable to the gas in the central and outer regions of the galaxy and hence argue against any strong shock heating of the galaxy atmosphere by the radio plasma. By determining the gas density surrounding the radio lobes, Finoguenov & Jones determined the strength of the magnetic field using the observed Faraday rotation. They inferred a line-of-sight magnetic field of Gauss.
In summary, the high resolution Chandra image of M84 shows the remarkable interaction between the radio plasma and the X-ray emitting interstellar medium (ISM) in a “normal” early type galaxy. The radio lobes have created cavities in the ISM that are surrounded by higher density shells and allow a calculation of the magnetic field overlying the radio bubbles.
2.3 Evolution of Buoyant Plasma Bubbles in Hot Gaseous Atmospheres
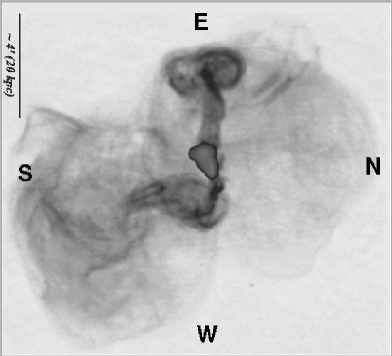
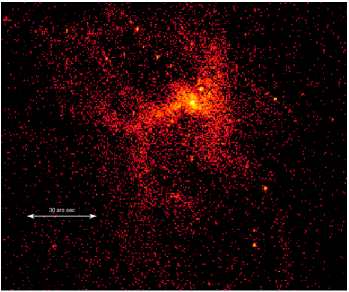
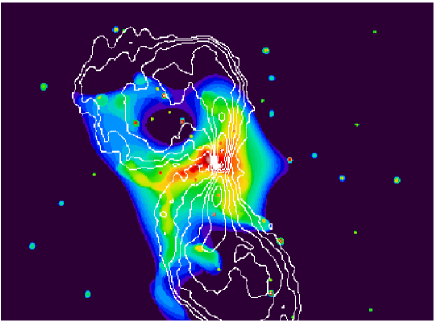
The new 327 MHz high resolution, high dynamic range radio map of M87 is shown in Fig. 2 (left panel). The high surface brightness center is the inner lobe structure (oriented approximately north-south) with the famous jet pointing west north-west (approximately bottom–right for the orientation of images adopted in Fig. 2). Surrounding this, the highly structured outer halo is much fainter and consists of the torus-like eastern bubble, the much less well-defined western bubble, both of which are connected to the central emission by a column, and the two very faint almost circular emission regions northeast and southwest of the center. The correlation between X–ray and radio emitting features has been remarked by several authors. The simplest explanation for this correlation, that the excess X–ray emission is produced by inverse Compton scattering of cosmic microwave background photons by the same relativistic electrons that produce the synchrotron radio emission, is not supported by the more recent observations. In particular, the ROSAT PSPC observations show that the excess emission has a thermal spectrum and the X–ray emitting gas in these regions has a lower temperature than that in the surrounding regions.
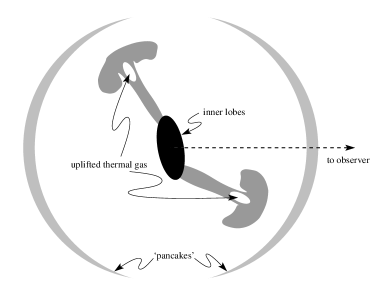
Churazov et al. proposed an alternative explanation utilizing buoyant bubbles. The “torus–like” radio features are strikingly similar to hot buoyant bubbles formed by powerful nuclear atmospheric explosions. Initially a spherical bubble is formed which transforms into a torus and appears as a characteristic “mushroom” cloud as the bubble rises in the ambient medium. Another property of powerful atmospheric explosions and buoyant bubbles is that, as the bubble transforms to a torus, the rising bubble/torus entrains and uplifts gas. This may qualitatively explain the correlation of the radio and X–ray emitting plasmas and naturally accounts for the thermal nature of the excess emission. Finally, in the last evolutionary phase of an atmospheric explosion, the bubble reaches a height at which the ambient gas density equals that of the bubble. The bubble then expands to form a thin layer (a “pancake”). The large low surface brightness features in the radio map could be just such pancakes – the final evolutionary phase of the bubbles (see Fig. 2). A sketch of a possible overall source structure of M87, based on the evolution of buoyant bubbles, is shown in Fig. 2.
Churazov et al. simulated their qualitative picture described above. A spherical bubble was inflated in an atmosphere defined by the gravitational potential of M87. The bubble density is 1/100 of the ambient density, making the bubble buoyant, and the bubble temperature was 100 times the ambient value, establishing pressure equilibrium. The simulations showed that buoyant bubbles behaved just as expected and did produce the features observed in both X-rays and radio for M87. Although the exact form of the rising bubbles was sensitive to initial conditions, the toroidal structures were a common feature. Ambient gas was uplifted in the cluster atmosphere reducing the effects of gas cooling and flowing to the center and producing the “stem” of the mushroom that is brighter than the surrounding regions.
Further detailed study of the X-ray and radio interaction will show how widely the buoyant bubble scenario applies. More detailed simulations will provide models for more sophisticated comparisons of theory and observation.
3 A New Aspect of Cluster Mergers – Cold Fronts
For many years clusters were thought to be dynamically relaxed systems evolving slowly after an initial, short-lived episode of violent relaxation. However, in a prescient paper, Gunn and Gott argued that, while the dynamical timescale for the Coma cluster, the prototype of a relaxed cluster, was comfortably less than the Hubble time, other less dense clusters had dynamical timescales comparable to or longer than the age of the Universe. Gunn and Gott concluded that “The present is the epoch of cluster formation”. With the launch of the Einstein Observatory came the ability to “image” the gravitational potential around clusters. Many papers in the 1980’s, exploited the imaging capability of the Einstein Observatory and showed the rich and complex structure of galaxy clusters.
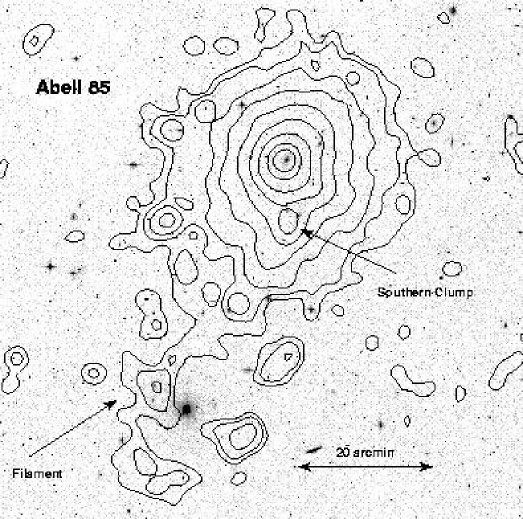
The X-ray observations supported the now prevalent idea that structure in the Universe has grown through gravitational amplification of small scale instabilities or hierarchical clustering. At one extreme, some clusters grow, in their final phase, through mergers of nearly equal mass components. Such mergers can be spectacular events involving kinetic energies as large as ergs, the most energetic events since the Big Bang. More common are smaller mergers and accretion of material from large scale filaments. An example showing the relationship between large scale structure and cluster merging is seen in the ROSAT image of A85. Fig.3 shows A85 with several small groups and a merging component (small concentration due south of the main peak). A85 exhibits common alignments on scales from 100 kpc to 25 Mpc that are expected if clusters form through accretion of matter from filaments. The central cluster galaxy, the bright cluster galaxies, X-ray filamentary structure (see Fig. 3), and nearby groups and clusters all show a common alignment at a position angle of about .
Chandra’s high angular resolution has further illuminated the merging process and the complexity of the X-ray emitting intracluster medium (ICM). Prior to the launch of Chandra, sharp gas density discontinuities had been observed in the ROSAT images of A3667 and in A2142 (unpublished). Since both clusters exhibited characteristics of major mergers, these features were expected to be shock fronts. However, the first Chandra observations showed that these were not shocks, but a new kind of structure – cold fronts. Their study has provided new and detailed insights into the physics of the ICM..
3.1 Multiple Cold Fronts in A2142
A2142 is a hot ( keV), X-ray-luminous cluster at a redshift of . Two bright elliptical galaxies, whose velocities differ by km s-1 lie near the center and are aligned in the general direction of the X-ray brightness elongation. All these properties suggest an unrelaxed cluster.
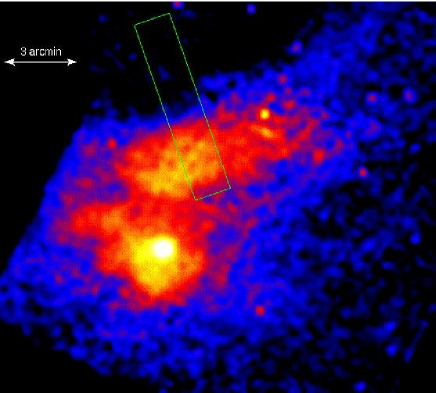
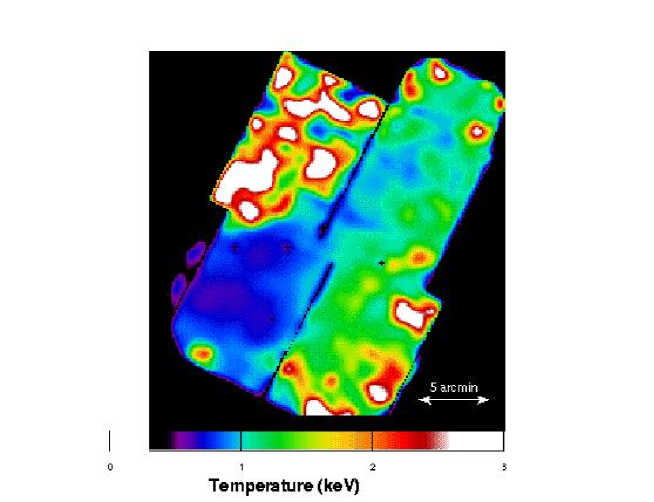
The Chandra 0.3-10 keV band ACIS image of A2142, shown in Fig. 4, exhibits two sharp surface brightness edges – one lies northwest of the cluster center (seen earlier in the ROSAT image) and a second lies south of the center. Markevitch et al. derived the gas density, gas temperature, and gas pressure distributions across the edges in the cluster. The gas temperature distribution shows a sharp and significant increase as the surface brightness (gas density) decreases. For the southern edge, the gas temperature rises by about a factor of 2 from keV to keV. For the northwestern edge, the surface brightness is lower and the uncertainties are larger, but the temperature change is comparable. The gas density changes across the edges compensate, within the uncertainties, for the temperature increases so that the gas pressures across the edges are equal.
One conclusion from the Chandra observation of A2142 in unambiguous. The edges in A2142 do not arise from shocks. If these edges were shocks, the gas temperature in front of the shock (i.e. away from the cluster center) would be lower than that behind the shock. This is exactly the opposite of what is found. The observed features are called “cold fronts”.
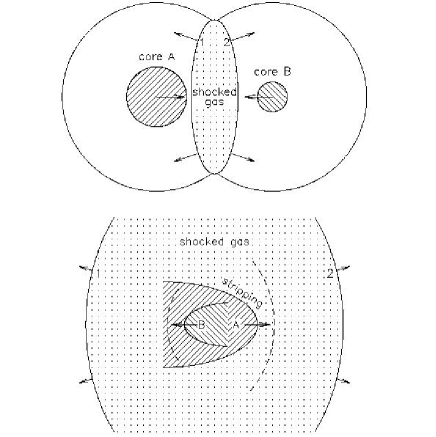
One suggestion for the origin of the A2142 structures is that they arise from the merger of two systems and that the dense cores have survived the merger. We observe A2142 as it would appear after the shock fronts have passed by each of the dense cores (see Fig. 4). The outer, lower density gas has been shock heated, but the dense cores remain “cold”. Each sharp edge is then a boundary of a ram pressure-stripped subcluster remnant.
3.2 Cluster Physics and Edges
A3667, a moderately distant cluster ( ; 1.46 kpc per arcsec), was a second candidate system with an edge, seen by ROSAT, that was expected to exhibit a shock front. However, as with A2142, this feature also is the boundary of a dense cold cloud, a merger remnant, as it traverses the ICM.

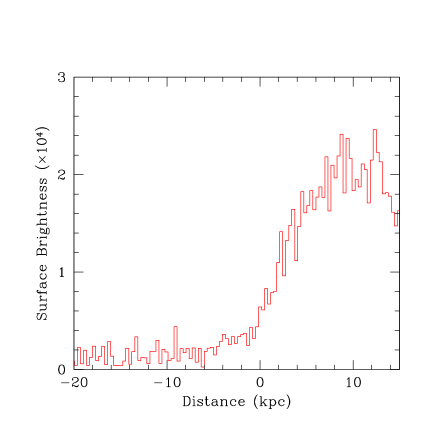
As Vikhlinin et al. showed, the edge is accurately modeled as a spheroid (see left panel of Fig. 5). From the surface brightness profile, converted to gas density, and precise gas temperatures, the gas pressure on both sides of the cold front can be accurately calculated . The difference between the two pressures is a measure of the ram pressure of the ICM on the moving cold front. Hence, the precise measurement of the gas parameters yields the cloud velocity. Using the ratio of the pressures in the free streaming region and the stagnation point (immediately in front of the cold front), the factor of two difference in pressure across the front yields a Mach number of the cloud of ( km s-1).
In addition to the edge, a genuine weak shock is detected, consistent with the above calculated velocity. The distance between the cold front and the weak shock ( kpc) and the observed gas density jump at the shock (a factor of 1.1-1.2) yield the shock’s propagation velocity, km s-1, consistent with that derived independently for the cold front.
The A3667 observation provides important information on the efficiency of transport processes in clusters. As the temperature and surface brightness profiles show (see Fig. 5), the edge is quite sharp. Quantitatively, Vikhlinin et al. found that the width of the front was less than (5 kpc). This sharp edge requires that transport processes across the edge be suppressed, presumably by magnetic fields. Without such suppression, the edge should be broader since the relevant Coulomb mean free path for electrons is about 13 kpc, several times the width of the cold front.
Finally, Vikhlinin et al. observed that the cold front appears sharp only over a sector of about centered on the direction of motion, while at larger angles, the sharp boundary disappears. The disappearance can be explained by the onset of Kelvin-Helmholtz instabilities, as the ambient gas flows past the moving cold front. To explain the observed extent of the sharp boundary, the instability must be partially suppressed, e.g., by a magnetic field parallel to the boundary. Its required strength is G. Such a parallel magnetic field may be drawn out by the flow along the front. This measured value of the magnetic field in the cold front implies that the pressure from magnetic fields is small (only 10-20% of that of the thermal pressure) and, hence, supports the accuracy of cluster gravitating mass estimates derived from X-ray measurements that assume that the X-ray emitting gas is in hydrostatic equilibrium and supported by thermal pressure.
4 The Realm of Galaxies
Chandra observations of early type galaxies have brought new data and some surprises. We first discuss M86, the prototype of a galaxy undergoing ram pressure stripping of its hot gaseous corona as the galaxy crosses the core of the Virgo cluster. Second we summarize the Chandra observations of NGC507, the central galaxy in a group whose image shows both the effects of plasma bubbles on its gaseous atmosphere and sharp edges of unknown origin.
4.1 M86=NGC4406
X-ray emission from M86 was first observed with the Einstein Observatory and subsequently by ROSAT. Its unusual “plume” was explained as a ram pressure stripped galactic corona. The Chandra observation shows a remarkably sharp boundary between the ram pressure stripped corona and the hotter Virgo cluster. As Fig. 6 shows, the cool ( keV) corona is separated from the hot ( keV) Virgo ICM by less than about 5 kpc, comparable to the width of the cold front in A3667. The “edge” here differs from that in A3667 since M86 is traversing the Virgo ICM at supersonic velocity and the edge lies to the rear or side of M86 as it moves towards us and to the southeast.
The precise origin for the structure of M86 remains unclear. As was pointed out by Toniazzo & Schindler none of their simulations viewed from any orientation exactly matched the morphology of M86. Perhaps there is physics that must be added to the simulations and, as in clusters, magnetic fields play an important role in shaping the gas and temperature distribution.
4.2 NGC507 - the central galaxy in a group
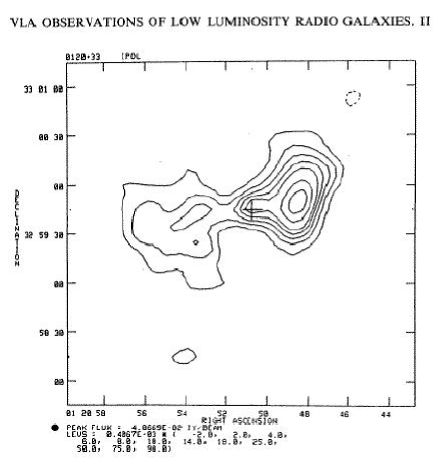
NGC507 is the central galaxy in a rather nearby (), group that has been studied extensively in X-rays. The galaxy is the site of a weak B2 radio source (luminosity of about ergs s-1). The Chandra X-ray image, shown in Fig. 8 (top left), covers only the central, high surface brightness region of the group around NGC507. The 0.5-2.0 keV surface brightness distribution shows sharp edges to the southwest, southeast and north, reminiscent of those in the clusters A2142 and A3667. In addition to the edges, there are two X-ray peaks. The first, to the east, coincides with the nucleus of NGC507 (see X-ray contours overlayed on the optical image in the lower left panel of Fig. 8). A second peak, to the west has no optical counterpart. However, comparing the X-ray and the radio map (upper right panel of Fig. 8) shows that the western radio lobe lies precisely in the surface brightness trough between the nucleus and the peak to the west. Thus, it seems likely that the radio lobe, possibly a buoyant bubble, has displaced X-ray emitting gas generating a trough in the X-ray surface brightness distribution.
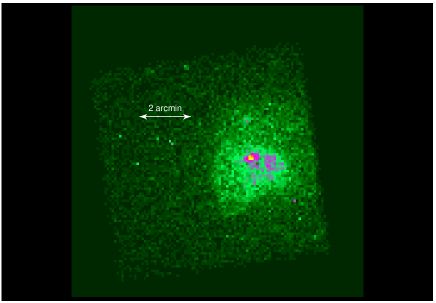
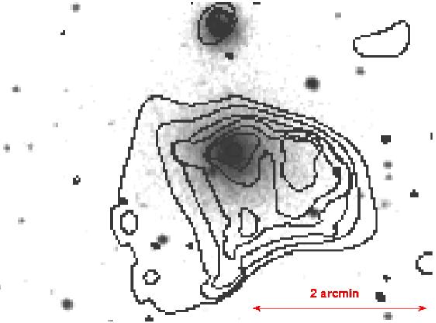
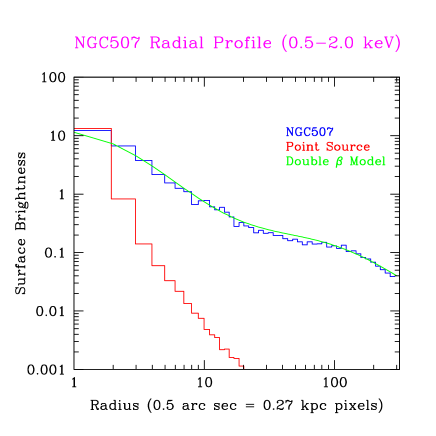
The origin of the peculiar sharp surface brightness discontinuities around NGC507 is unclear. The bright emission is well fit by a thermal model with gas temperatures near 1 keV, consistent with the mean ASCA temperature of keV. The emission from the central region is resolved and hence the contribution from a central AGN is relatively small (see Fig. 8 bottom right panel). Perhaps the X-ray surface brightness features arise either from motion of NGC507 and its dark halo within the larger group potential as suggested for the multiple edges in clusters. Alternatively, perhaps the edges are relics of the merger process in a group as dynamical friction causes the merging of smaller galaxies with the central dominant NGC507. Thus we could be observing tracers of the process that forms fossil groups and OLEGS, systems near the end points of their dynamical evolution that contain a single optically bright galaxy.
5 Conclusions
We did not anticipate surprises from Chandra’s high angular resolution observations of clusters and early type galaxies. Instead of confirming our prejudices, Chandra has brought us a wealth of new information on the interaction of radio sources with the hot gas in both galaxy and cluster atmospheres. We see “edges” in many systems with hot and cold gas in close proximity and have been able to extract important new parameters of the ICM from their study. We have only barely begun to digest the import of the Chandra cluster and galaxy observations. We can only expect the unexpected as Chandra observations continue and as our understanding of how best to use this new observatory matures.
We acknowledge support from NASA contract NAS8 39073, NASA grants NAG5-3065 and NAG5-6749 and the Smithsonian Institution.
References
References
- [1] Jones, C. et al. 1979, ApJL, 234, 21
- [2] Jones, C. & Forman, W. ApJ, 276, 38
- [3] Forman, W., Bechtold, J., Blair, W., Giacconi, W., van Speybroeck, L., Jones, C. 1981, ApJL, 243, 133
- [4] Forman, W., Jones, C., Tucker, W. 1985, 293, 102
- [5] Briel, U. et al. 1991, A&A, 246, L10
- [6] Briel, U. & Henry, J. P. H. 1992, A&A, 259, L31
- [7] Bohringer H., Briel U.G., Schwarz R.A., Voges W., Hartner G., Trumper J., 1994, Nature, 368, 828
- [8] Vikhlinin, A., Forman, W., Jones, C. 1994, ApJ, 435, 162
- [9] Henry, J. P. H. & Briel, U. 1995, ApJL, 443, 9
- [10] Honda, H. et al. 1996, ApJL, 473, 71
- [11] Henriksen, M., & Markevitch, M. 1996, ApJ, 466, L79
- [12] Vikhlinin, A., Forman, W., Jones, C. 1997, ApJL, 474, 7
- [13] Churazov, E. et al. 1999, ApJ, 520, 105
- [14] Markevitch, M., Sarazin, C., Vikhlinin, A. 1999, ApJ, 521, 526
- [15] Donnelly, R. H. et al. 1998, ApJ, 500, 138
- [16] Schindler, S., Binggeli, B., Bohringer, H. 1999, A&A 343, 420
- [17] Bohringer, H. et al. 1993, MNRAS, 264, L25
- [18] Bohringer, H., Nulsen, P., Braun, R., Fabian, A. 1995, MNRAS, 274, L67
- [19] Churazov, E., Forman, W., Jones, C., Bohringer, H. 2000a, A&A, 356, 788
- [20] Fabian, A. et al. 2000 MNRAS, 318, L65
- [21] McNamara, B. et al. 2000, ApJL, 534, 135
- [22] Vrtilek et al. 2001, in preparation and IAP 2000 Workshop
- [23] Mazzotta, P. et al. 2001, ApJL submitted
- [24] Finoguenov, A., Jones, C. 2001, ApJL, 547, L107
- [25] Owen, F., Eilek, J, Kassim, N. 2000, ApJ in press (astro-ph/0006150)
- [26] Feigelson, E. D., Wood, P., Schreier, E., Harris, D., Reid, M. 1987, ApJ, 312, 101
- [27] Harris D.E.,Owen F.N.,Biretta J.A., Junor W. 1999, Diffuse Thermal and Relativistic Plasma in Galaxy Clusters eds. H.Böhringer, L.Feretti, P. Schuecker, MPE Report 271, 111
- [28] Churazov, E. et al. 2000b, submitted to ApJ (astro-ph/0008215)
- [29] Gunn, J. & Gott, R. 1972, ApJ, 176, 1
- [30] Durret, F. et al. 1998, A&A, 335, 41
- [31] Van Haarlem, M. & Van de Weygaert, R. 1993, ApJ, 418, 544
- [32] Markevitch, M. et al. 2000, ApJ, 541, 542
- [33] Vikhlinin, A., Markevitch, M., Murray, S. 2000a, ApJ, 551 160
- [34] Vikhlinin, A., Markevitch, M., Murray, S. 2000b, ApJL, 549, L47
- [35] Forman, W., Schwarz, J., Jones, C., Liller, W., Fabian, A. 1979, ApJL, 234, 27
- [36] Fabian, A. Schwarz, J., Forman, W. MNRAS, 192, 135
- [37] White, D., Fabian, A., Forman, W., Jones, C., Stern, C. 1991, ApJ, 375, 35
- [38] Rangarajan, F. V. N., White, D., Ebeling, H., Fabian, A. 1995 MNRAS, 277, 1047
- [39] Toniazzo, T. & Schindler, S. 2001, MNRAS, in press (astro-ph/0102204
- [40] Kim, D. & Fabbiano, G. 1995, ApJ, 441, 182
- [41] Matsumoto, H. et al. 1997, ApJ, 482, 133
- [42] Buote, D. & Fabian, A. 1998, MNRAS, 296, 977
- [43] Fukazawa, Y. et al. 1998, PASJ, 50, 187
- [44] de Ruiter, H. R., Parma, P., Fanti, C., Fanti, R. 1986, A&AS, 65, 111
- [45] Markevitch, M. 2001 talk at this XXI Moriond Astrophysics Meeting
- [46] Ponman, T. et al. 1994, Nature, 369, 462
- [47] Vikhlinin, A. et al. 1999, ApJL, 520, 1