11email: vdkruit@astro.rug.nl, jjimenez@astro.rug.nl, kregel@astro.rug.nl 22institutetext: Research School of Astronomy and Astrophysics, Mount Stromlo and Siding Spring Observatories, Australian National University, Private Bag, Weston Creek, 2611 Canberra, Australia
22email: kcf@mso.anu.edu.au
Kinematics and dynamics of the “superthin” edge-on disk galaxy IC 5249
We present spectroscopic observations of the stellar motions in the disk
of the superthin edge-on spiral galaxy IC 5249 and re-analyse
synthesis observations of the HI.
We find that the HI rotation curve
rises initially to about 90-100 km/s, but contrary to the conclusion of Abe
et al. (1999) flattens well before the edge of the optical disk. Over most
part of the optical disk we have been able to establish that the
(tangential) stellar velocity dispersion is 25-30 km/s. We argue that
the central light concentration in the disk is not a bulge in the
classical Population II sense, but most likely represents structure in
the disk component. From earlier surface photometry we adopt a value for
the radial scalelength of the disk of kpc, a vertical
scaleheight of kpc and a disk truncation radius of kpc. The HI disk has a measurable thickness but from our analysis
we conclude that this is due to a small inclination away from
perfectly edge-on.
The very thin appearance of IC 5249 on the sky is the result of a
combination of a low (face-on) surface brightness, a long scalelength
and a a sharp truncation at only about 2.5 scalelengths. In terms of the
ratio of the radial scalelength and the vertical scaleheight of the
disk, IC 5249 is not very flat; in fact it is slightly fatter than the
disk of our Galaxy. From various arguments we derive the stellar
velocity dispersions at a position one radial scalelength
out in the disk ( kpc) as respectively
35 km/s, 30 km/s and
20 km/s. This is comparable to the values for
the disk of our Galaxy in the solar neighborhood. Near the edge of the
disk the ratio of radial to vertical velocity dispersion is probably higher.
Presumably the angular momentum distribution of the gas that formed the disk in
IC 5249 was such that, compared to the Galaxy,
a much more extended distribution resulted in spite of
the lower overall rotation and mass. The low surface density that arose from
that resulted in a thicker HI layer in which star formation proceeded at
a much slower rate, but disk heating proceeded at a similar pace.
Key Words.:
Galaxies: individual: IC5249 – Galaxies: Kinematics and dynamics – Galaxies: photometry – Galaxies: spiral – Galaxies: structure1 Introduction
The stellar disks of spiral galaxies have a thickness that is thought to arise from the secular evolution of the random velocities of the stars. In the course of time the vertical (and other) velocity dispersions increase (but level off when the stars spend most of their time outside the gas-layer where much of the vertical scattering is thought to occur) and consequently the stellar disk thickens. When for the Galaxy we consider the solar neighborhood we find that the -velocity dispersion of the old disk stars is of order 20 km/s (e.g. Dehnen & Binney, 1998), while the vertical distribution of the old disk stars can be described (at least at larger distances ) by an exponential with an -folding (the scaleheight over which it drops by a factor ) of about 0.325 kpc (Gilmore & Reid, 1983). On the other hand, the radial distribution of light in galaxy disks is also exponential but with a much larger e-folding (now called the scalelength). For the Galaxy the value of the disk scalelength is under dispute, but is in the range of 2.5 to 4.5 kpc (for a recent discussion see van der Kruit, 2000). For the majority of galaxies the ratio of the two scale parameters is in the range 5 to 10 (van der Kruit & Searle, 1981, 1982; de Grijs, 1998, Kregel et al., 2001).
The random velocities of the stars in a disk are anisotropic; e.g. in the solar neighborhood the radial, tangential and vertical dispersions are in the ratio 2.2 to 1.4 to 1.0 (Dehnen & Binney, 1998). This ratio contains information on the processes by which stars are being scattered (Jenkins & Binney, 1990; Jenkins, 1992). Furthermore, while the scaleheight and scalelength of a disk are presumably determined independently (the scalelength from the angular momentum distribution in whatever the galaxy formed out of and the scaleheight as a result of secular evolution of stellar motions) the radial-to-vertical axis ratio of the velocity ellipsoid is related to the flattening of the stellar disks (van der Kruit & de Grijs, 1999), because the radial velocity dispersion can be related to the disk scalelength through Toomre’s (1964) criterion for local stability 1 (for the definition of see eq. 17 below). In fact, if as is often found in numerical experiments, eq. 17 in van der Kruit & de Grijs (1999) gives a ratio of vertical to radial velocity dispersion from 0.62 to 0.88 for the scalelength to scaleheight ratio in the range 10 to 5.
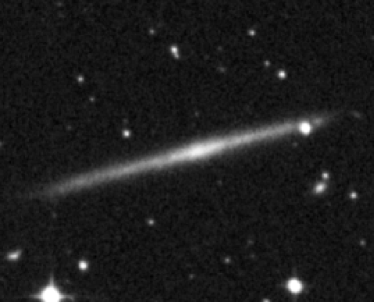
Although the most common flattening of edge-on galaxies on the sky is of order 5 to 10 in the ratio of the scale parameters and consequently also in observed isophotes, there remains a class of so-called “superthin” galaxies, in which the axis ratio on the sky surveys appears much larger. A beautiful example of such a system is IC 5249, which has an axis ratio of about 20 on the Digital Sky Survey (see Fig. 1). If indeed the ratio of the scalelength and the scaleheight would be that large, the axis ratio of the stellar velocity ellipsoid can still be of the order 0.45 according to the equation referred to above, but it would seriously constrain the models for secular evolution that would have to be much more efficient in the radial than in the vertical direction.
Photometry of IC 5249 has been performed by Carignan (1983) in the optical (-band) and by Wainscoat (1986) in the near-infrared (, and ). Carignan interpreted his photometry as that IC 5249 has two distinct components, an inner one with a 18 kpc scalelength and an outer with 2.5 kpc, which suggest a long scalength disk with a shallow cut-off. Wainscoat’s photometry confirmed this and showed that the optical structure is not a result of absorption by dust. He concluded that the flatness on the sky results from the long apparent scalelength, since the vertical scaleheight was not unusually small.
More detailed photometry was published by Byun (1998) in , and (and also for ESO 404-G18). The disks turned out to have quite normal (even somewhat large) scaleheights, but exceptionally large scalelengths accompanied with relatively sharp disk truncations. Also the photometry indicated that these are examples of Low-Surface Brightness (LSB) galaxies seen edge-on. Further photometry has been published by Abe et al. (1999) who drew attention to a very sharp truncation of the stellar disk at less than two scalelengths. Together with the apparent LSB-nature of the galaxy this gives rise to a appearance on the sky of a very high axis ratio disk (see van der Kruit, 1999).
In the mean time more “superthin” galaxies have been studied, such as UGC 7321 (Matthews et al., 1999; Matthews, 2000) and UGC 711 (Mendelowitz, 2000). Especially the thorough study of UGC 7321 by Matthews and co-workers is interesting in that it gives values for the ratio of the scale parameters from 14 in the inner regions to 10 further out. It also provides the smallest measured value for a scaleheight (140-150 pc) in a stellar disk. UGC 7321 appears to be a superthin galaxy in the real sense. The radial scalelength is 2 kpc at the reddest wavelength measured () and the disk shows a truncation feature at about 7 kpc. We will return to the differences and similarities between UGC 7321 and IC 5249 below.
In this paper we re-analyse the HI data used by Abe et al. (1999) in more detail. We also present measurements of the stellar motions from a long slit spectrum along the disk of the galaxy. In this paper we will use a distance of 36 Mpc, based on the radial velocity of about 2360 km/s. At this distance 1 arcmin corresponds to 10.47 kpc. The appearance of IC 5249 and surface brightness contour maps (Byun, 1998) show a central bright area. Byun interpreted this as a weak bulge. It also appears to coincide with the rotation center of the galaxy. Unless stated otherwise we have used this position as that of the center of the galaxy. We will discuss the nature of this central area below.
2 The ATCA HI observations
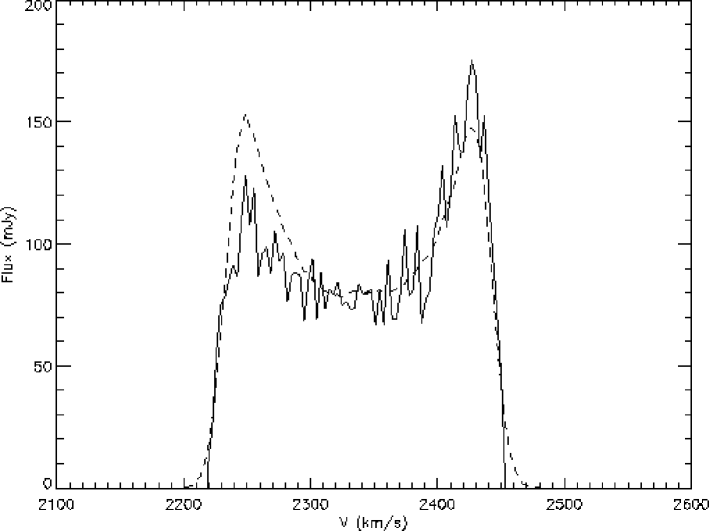
The observations used were the ones presented in Abe et al. (1999). They have been obtained on October 18, 1992 by P. Levasseur, C. Carignan and Y.-I. Byun with the Australia Telescope Compact Array (ATCA) during about 12 hours and were extracted for us from the ATCA public archive and made available for analysis. We were particularly interested in these observations for two reasons. The first was the fact that we had some doubt about the analysis in Abe et al. concerning the derived rotation curve (van der Kruit, 1999). Although realising the pitfalls (and describing these in their footnote 16) they derived a rotation curve from a first moment analysis in velocity at positions along the major axis. The integrated profile (Mathewson et al., 1992) with a clear two-horned signature and the published HI map by Abe et al. with fairly constant HI surface density on the sky along the plane seemed inconsistent with their monotonically rising rotation curve. We have therefore used the achival data to fully analyse the position - velocity diagram. Our second interest was to see whether the HI disk was resolved in the -direction or whether useful limits could be obtained from the data.

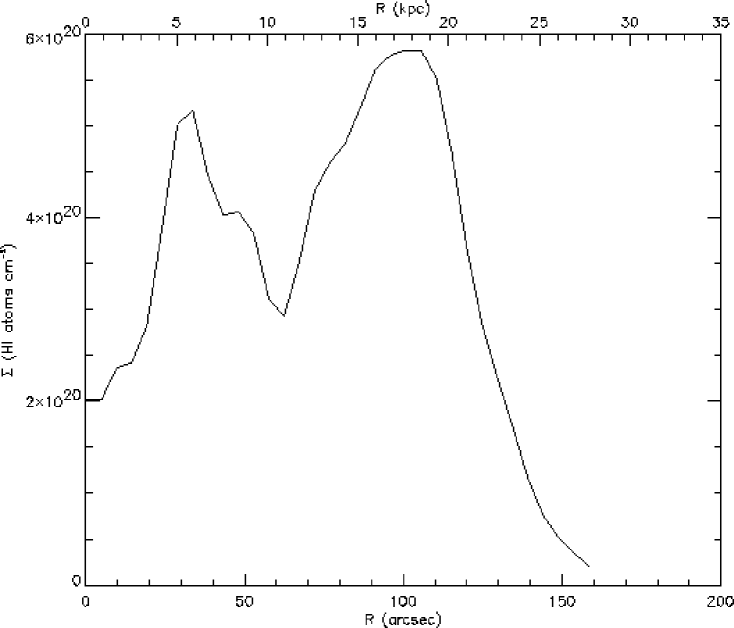
This analysis proceeded along the usual lines. First the data were transformed into a single -diagram ( measured along the disk, the observed radial velocity) by intergrating at each over all . Then the observed profile of HI surface density with distance from the center was unfolded into a radial HI surface density profile under the assumption of circular symmetry. Before this both sides of the galaxy were averaged. The resulting density profile is shown in Fig. 2. As noted by Abe et al., the ATCA data add up to only (20 Jy km/s), while the single dish measurements of Mathewson et al.(1992) imply (27.85 Jy km/s). It is possible that some emission is missing as a result of the absense of short interferometer spacings. This then must be emission over relatively large angular scale.

Next the -diagram was used to make a first estimate for the rotation curve and this was then used with the distribution in Fig. 2 to derive the corresponding distribution of HI emission in the -diagram. In order to improve the sensitivity without degrading the quality of the result, we have first smoothed the data to a resolution (FWHM of the beam) of 20.20″26.18″. Also the resulting integrated HI profile was generated and compared to the observed one (in the synthesis observations). This was repeated with an improved estimate of the rotation curve until the best correspondence between model and observations was achieved. This resulted in the rotation curve of Fig. 3. The corresponding observed and calculated distribution in the -diagram are compared in Fig. 4, while Fig. 5 shows the observed and calculated integrated profiles. The procedure was repeated for a few values for the velocity dispersion of the HI. The best fit of the data were obtained with an HI velocity dispersion of 7 km/s. A value of 8 km/s would also be consistent with the observations, but 10 km/s gave a significantly worse fit.
It can be seen that our rotation curve rises faster than the one by Abe et al., in broad terms reaching a flat part at some 105 km/s at about 60″ (10 kpc) out to the edge of the observed HI at about 120″ (21 kpc). The rotation curve derived by Abe et al. rises linearly from the center to about 100 km/s at 100″ ( kpc). Along the major axis the beam (FWHM) is about 25″, so the initial rise within 5 kpc may be affected by beam-smearing, since there the velocity gradient across the beam is appreciable.
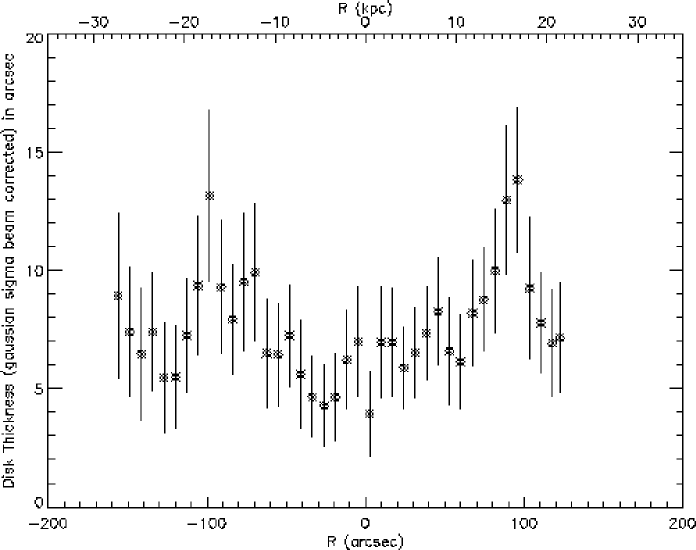
Our second concern was the thickness of the HI layer. In order to investigate this we of course used high-resolution data, which means a beam of 10.9″12.5″ (FWHM). In the direction perpendicular to the disk the beam is then 12.4″. This is slightly larger then the full resolution data would allow, but the latter were too noisy for a reliable determination. The HI data were then fitted to Gaussians in the -direction and these were then corrected for the beam. The result of this is in Fig. 6.
The disk is clearly resolved in the -direction. When fitted with Gaussians we find that the average Gaussian dispersion of the HI layer is ″ ( kpc). Over most part of the optical disk the HI layer has a reasonably constant thickness (again Gaussian dispersion) with a mean and r.m.s. scatter of ″ ( kpc). This is remarkably thick for a gas layer and comparable to the stellar disk! It is of course possible that the HI consists of two components with different -distributions (and also velocity dispersions!), but we feel we would have seen the latter in our analysis of the -diagram since a more extended component would (if substantially contributing to the observations) probably have had velocity dispersion larger than the canonical 7 km/s.
It should be noted, however, that the observed thickness may be the result of a small inclination away from perfectly edge-on. We therefore also looked at the individual channel maps, but because of the lower signal to noise we have not been able to find any convincing indications for a measurable thickness of the HI disk in those data. A further test would be to look at HI profiles in the disk and just below/above this. In the case of a significant inclination one would expect in the latter positions velocities closer to the systemic velocity. The effect cannot expected to be easily seen in the IC 5249 measurements, since the data are noisy and we can only take positions about half a beam away from the disk. However, we see absolutely no such effect.
3 Observations of the stellar kinematics
A spectrum was obtained with the Double Beam Spectropgraph at the 2.3 meter telescope of the Mount Stromlo and Siding Spring Observatories, located at Siding Spring. In total 8 separate exposures of 2000 seconds each were obtained on April 15 and 16 and May 14 and 16, 1999. The spectrograph slit was oriented along the major axis of IC 5249. The blue arm was set to register the wavelength range 4785 to 5752Å, which would include the Mgb-triplet and Fe-lines such as at 5270Å, and the red arm the range 6005 to 6958Å, which would include H and the [NII] and [SII] lines. After logarithmic binning of the data the pixels were 31.61 km/s in the blue arm and 25.28 km/s in the red arm (original pixels were about 0.5Å). As template star for the stellar velocity measurements HD132667 was used. The reduction took place along the lines of the crosscorrelation analysis method of Statler (1995). Tests with broadening of the spectrum of HD132667 and adding noise according to a signal-to-noise ratio of 15 showed that on our data the method worked reliably down to a velocity dispersion of 20 km/s.
The basic results are in Fig. 7. The data have been binned along the slit before crosscorrelation until a signal-to-noise ratio of 15 was reached. The central bins were re-analysed after allowing for the gradient in velocity (0.8 velocity pixels per spatial pixel) in order to make the velocity dispersion free of radial velocity gradients accross the final bin. Fig. 7 shows clear effects of rotation with a flattening of the apparent rotation at about 70 km/s at 40 - 50″ (8 kpc). The center from which the offset has been measured is the brightest spot along the disk (the possible bulge). The observed velocity dispersions are consistent with a value of 30 km/s at all radii covered.
In order to improve the signal-to-noise further the data were binned in only three ranges of distance from the presumable center. Over the region A, roughly the central spike or bulge, from offsets -23″ to +23″ (4 kpc) the velocity dispersion (after allowing for the change in radial velocity along this interval) was km/s (formal error). For region B (to the south between -23″ and -90″ or 4 to 16 kpc) the velocity dispersion was km/s and on the corresponding northern side (region C between +23″ and +63″ or 4 to 11 kpc) the velocity dispersion came out as km/s. Taking the regions B and C together (and shifting to the same radial velocity before adding) gives a velocity dispersion of km/s.
Before we can use these data we need to concern ourselves first with two line-of-sight (l.o.s.) effects. The first is absorption along the l.o.s., which would prevent us from seeing the full range of possible radial velocities, which we will need to assume for our correction of the observed velocity dispersions for l.o.s. integration. This is the reason why we took the H spectrum on the red arm. This spectrum showed H, [NII] and [SII] all along the disk with a few bright spots. In particular the central area (around the possible bulge) is relatively bright in emission lines.

Fig. 8 shows the H line along the slit. Superimposed on this is the HI rotation curve from Fig. 3. It is obvious that we see the full amplitude of the HI rotation curve in the H line as well. This means that we can at these wavelengths (H as well as the MgH triplet – our stellar spectra are not too far apart in wavelength) we are looking at least to the point where the full amplitude of the rotation comes along the line of sight, or in other words at least (but presumably further than) half way through the galaxy. We also note that from the absence of a measurable color change with in his photometry, Byun (1998) concludes that there is little absorption in the plane of IC 5249. In particular, Byun noted the absense of a dust lane in photographs or photometry (a dip in vertical profiles). Wainscoat (1983) also concluded from his near-infrared observations and the agreement with optical photometry that the effects of dust absorption in the optical are small.
The H line in Fig 8 has an observed dispersion ranging from about 30 km s-1 in the center to about 15 km s-1 at the edges. This is similar to the HI data and is therefore probably dominated by line of sight effects. It is likely that the H and HI velocity dispersions are similar, but the resolution of the H data is too coarse to do an analysis similar to that on the HI data and determine the H velocity dispersion reliably.

Having established that dust absorption is probably not a serious problem, we can consider the effects of the line of sight integration on the derived stellar radial velocities and dispersions. This has been investigated for an average galaxy by Bottema et al. (1987) and the effect was found to be small. The reason for that is that along the path, the parts closest to the center contribute most to the integral along the line of sight and the observed values are therefore quite typical for what applies to these parts (both radial velocity and velocity dispersion). However, in IC 5249 the situation might be different. This is so, because the scalelength is very long and the truncation radius only a few scalelengths, so that the contribution along the line of sight is decreasing only slowly while a smaller and smaller component of the rotation comes into the line of sight.
The effect has been simulated for the following case: distance from the center 8.5 kpc (50″), scalelength 11 kpc (the one used by Abe et al.), truncation radius 17 kpc, velocity dispersion constant along the line of sight (this is likely in view of the large scalelength) and mean stellar tangential velocity 100 km/s. Then it is found that for the range 20 to 30 km/s for the velocity dispersion along the line of sight the observed velocity dispersion is about 5 km/s lower than the actual one at that radius from the center and the mean tangential stellar velocity about 15 to 20 km/s lower. The first correction is comparable to the error, but the one in tangential velocity is substantial.
We therefore conclude that the stellar rotation curve rises from the center to a value of about 90-100 km/s at 50″, and that the (tangential) velocity dispersion is within the uncertainties everywhere 25-30 km/s.
4 The parameters of IC 5249
4.1 Is the central light concentration a small bulge?
We first need to discuss whether or not the central part of the image of IC 5249 constitutes a small bulge or a structure in the disk. Probably the most important argument against it being a bulge, is that the -profile of the galaxy at this position is indistinguishable from those at other radii and well-described by an exponential (except at small ). Exponential profiles for bulges along their minor axes are not uncommon (Andredakis & Sanders, 1994), but it is not clear what a bulge means in practice when its vertical distribution is the same as that of the rest of the disk. A bulge is indicated when the observed central surface brightness is well above that of the extrapolated exponential disk. In IC 5249 this argument cannot be used, since the disk extends over only a few scalelengths so that both fits with or without a bulge in this sense are possible. The stellar velocity dispersion measured at the central position is no different from what we find elsewhere in the disk as would be expected if the central bright area is part of the disk.
At the central position there is an increase in the brightness of the emission lines, but that could also be the result of the longer line of sight through the galaxy. We conclude that the central bright concentration is certainly not a bulge in the classical sense of a Population II component and most likely represents structure in the disk. One possibility would be a bar, but we have no way at this stage to address that possibility with more confidence.
4.2 The scaleheight, scalelength and truncation radius of the stellar disk
For our analysis we first need to decide on the best values for the scale parameters of the disk and its radius.
Byuan (1998) measured the scaleheight in three color bands and found from his fits (after correcting to the distance used in this paper) kpc in , kpc in and kpc in . The Abe et al. (1999) photometry was performed in the - and -bands. They finally arrive at a value of kpc. Both sets of data show no evidence whatsoever for a change in the scaleheight with distance from the center (although Byun does have some evidence for a flaring just before the edge). For the analysis below we will use a value of kpc.
The scalelength is more problematic, since the outcome depends on whether the central bright concentration is ignored (if it is a bulge) or not (if it is part of the structure in the disk). The first possibility is taken by Abe et al. and by Byun and they arrive respectively at values for of kpc and 13 kpc. If we would include the light near the center a more appropriate value would be kpc (as adopted in van der Kruit, 1999). We will choose here for the latter value on the basis of our discussion above.
The possibility should be considered that IC 5249 is not perfectly edge-on and that this is the cause of the relatively large stellar scaleheight and thickness of the HI layer. An inclination of 5∘ or so would project the stellar disk scalelength of 7 kpc onto an apparent scaleheight as observed on the minor axis. The problem with that possibility is that the radial HI distribution of Fig. 2 would then result in an apparent HI thickness (Fig. 6) that is larger at the center than near the edges, while the opposite is observed. Also for the optical disk the apparent scaleheight should then decrease from the center outward and this is also not observed. If the vertical light distribution is dominated by inclination effects, that is if the inclination would be of order 5∘, then all contours (even the brightests) would have axis ratios 1:10. But the bright contours have an axis ratio of 1:20 or so. At smaller inclinations the observed stellar disk scaleheight is not affected by the projected scalelength (see also van der Kruit & Searle, 1981a, their Fig. 3a).
There is little question that the observed radial surface brightness profile shows a clear and sharp truncation in all measurements. The northern side is more pronounced, but there is no doubt that the truncation is symmetric in location. The radius is kpc.
We can compare these results to other edge-on galaxies, for example the sample of de Grijs (1998), recently re-analysed by Kregel et al. (2001). First we note that a scaleheight of 0.65 kpc is somewhat, but not excessively high for a galaxy with a rotation velocity of about 100 km/s. However, the radial scalelength of 7 kpc is about twice what is found for such systems in the de Grijs sample (and 11 or 13 kpc would be even more extraordinary). The value for of about 11 does occur in other systems, but those all have higher rotation velocities. For a of about 100 km/s the usual value is about 6 or 7, although a few systems have ratios closer to 10. The conclusion is that in terms of flattening , IC 5249 is somewhat unusual in being flatter than galaxies with the same rotation velocities.
The truncation radius gives . This is very low compared to other edge-on galaxies. The mean values found by Schwarzkopf & Dettmar (2000) and Kregel et al. (2001) are of the order of (for a review see van der Kruit, 2001). Comparison of the structural parameters in samples of edge-on galaxies (Kregel et al., 2001) show that for its rotation velocity IC 5249 has reasonably normal and , but an anomalously large .
5 Dynamics of IC 5249
Our interest in this section will be to calculate various dynamical parameters from the observed stellar kinematical data (tangential velocity and velocity dispersion) and the HI data (HI rotation curve, the HI surface density and the HI layer thickness). The galactocentric distance where we have most complete information is at about 40″ (7 kpc, or about 1 radial scalelength). The other region, where we have information is around 100″ (17 kpc, near the optical truncation). These regions coincide with radial peaks in the HI distribution, ensuring that we have the most accurate information on the HI rotation curve and layer thickness.
First we look at kpc. The HI rotation curve is still rising there. We take km/s and km/s kpc-1. Then the local Oort constants and are
| (1) |
| (2) |
and the epicyclic frequency is
| (3) |
The epicyclic period is then years compared to a rotation period of about years, or more if there is a significant asymmetric drift.
The ratio of the tangential versus radial velocity dispersion becomes
| (4) |
Our observed velocity dispersion of km/s is mostly in the tangential direction, so we estimate km/s.
Now, let us first check that this is consistent with the asymmetric drift equation for an exponential density distribution
where is the tangential velocity of the stars. We don’t know the second term in the righthand part, but it is often thought that it is of order (van der Kruit & Freeman, 1986). With our values this equation gives an asymmetric drift km/s, which is consistent with our measurements.
The values that we find for the thickness of the HI layer (the Gaussian dispersion) and the stellar exponential scaleheight are comparable. At face value we would have to conclude that the gas-layer is thicker than the stellar disk; this is difficult to fit into any scenario that we can imagine. We will first assume that the vertical distribution of the gas and the stars is the same. Then both gas and stars will have the same (vertical) velocity dispersion, so that very little dynamical evolution can have occured in the stellar disk at least in the -direction.
A general case for the -distribution of matter that is useful for our treatment is (van der Kruit, 1988)
| (6) |
De Grijs et al. (1997) have found from fits to actual (edge-on) galaxies that
| (7) |
Now if we allow for the range of density laws from (a sech dependence) to the exponential case (an exp dependence) and integrate the vertical velocity dispersion (weighed by the density) we obtain (van der Kruit, 1988, eq. (23) - (25))
| (8) |
where is the disk surface density at radius and the gravitational constant. If the stars and the gas have the same vertical distribution, they should also have the same velocity dispersion. So we take km/s, which then gives with kpc
| (9) |
From Fig. 2, we see that at the relevant radius the HI surface density is of order 3.2 M⊙ pc-2 ( HI atoms cm-2). However, adding another third to allow for helium and keeping in mind that in the observations ATCA missed probably a not insignificant amount of the 21-cm line flux, we see that this mass surface density estimate is already accounted for by the gas alone.
Abe et al. fit the disk with a radial scalelength of 11 kpc and for that fit quote a central, face-on surface brightness for IC 5249 of 24.3 mag arcsec-2 in the -band. This corresponds to 4.3 L⊙ pc-2. In our preferred fit with = 7 kpc, the central value has become 7.6 L⊙ pc-2. In both cases at kpc the surface brightness is about 2.5 L⊙ pc-2. For any reasonable mass-to-light ratio we expect a few M⊙ pc-2 in stars.
So we see that we do not get a consistent result if indeed the HI disk is resolved by the ATCA observations. However, if the apparent thickness of the HI layer is affected by the inclination, the HI layer must be thinner than the stellar disk and the value derived for the surface density becomes a lower limit. This seems to make more sense.
At this point it is useful to set an upper limit on the disk mass surface density from the rotation curve. We use the simple case of an self-gravitating exponential disk, for which the rotation curve reaches a maximum at about 2.2 of
| (10) |
(Freeman, 1970) and require that this is at most equal to the observed maximum rotation of km/s. Then the upper limit on the central surface density is
| (11) |
At kpc or one scalelength this gives an upper limit
| (12) |
Further estimates of the surface densities can be made in two ways. First, we can use the global stability criterion of Efstathiou et al. (1982)
| (13) |
to make another estimate of the disk mass. In this criterion an exponential disk is assumed with mass , which is stabilised by a dark halo ( is the maximum velocity in the rotation curve). We then find
| (14) |
and taking account of the truncation radius this translates into
| (15) |
| (16) |
Secondly, we can use the local stability criterion 1 of Toomre (1964) to estimate the disk surface density by rewriting the definition of as
| (17) |
where we can assume that (Bottema, 1993, 1997; van der Kruit, 1999). Doing this with our values we get
| (18) |
On the basis of the above we adopt at kpc a surface density of 25 M⊙pc-2 (which would then be dominated by the stars). This would imply a vertical stellar velocity dispersion of
| (19) |
We can then also use the relation between the FWHM of the HI layer (van der Kruit, 1981) and the stellar disk parameters
| (20) |
where the constant again has been adapted to allow for a density distribution between a sech and an exponential exp dependence. Then
| (21) |
We repeat this analysis for the radius = 17 kpc. There are two important changes here. Following Byun (1998) we see that there is a possibility that at this radius there is a sudden flaring of the stellar disk with the scaleheight increasing to about kpc. Secondly the HI disk might here not be affected by inclination effects (for an illustration of this see the simulations in van der Kruit, 1981, especially his Fig. 6) and it is a real possibility that the HI layer and the stellar disk do have the same thickness. We now observe a essentially flat rotation curve and adopt km/s and km/s kpc-1.
The dynamical properties then become at = 17 kpc:
| (22) |
| (23) |
The period in the epicycle now is years, compared to a rotation period of about years.
| (24) |
We cannot calculate here the asymmetric drift. Assuming that the gas and the stars have the same vertical distribution we find
| (25) |
The observed surface density of HI is about 4.8 M⊙pc-2, again showing an inconsistency if the gas and the stars have a similar -distribution.
For the maximum disk estimate we now get
| (26) |
and from the global stability parameter
| (27) |
We cannot use the local stability criterion, since we do not know the stellar radial velocity dispersion. However, above we adopted a surface density of 25 M⊙pc-2 at =7 kpc, and if our exponential disk has a constant mass-to-light ratio this also implies a surface density at =17 kpc of about 6 M⊙pc-2. Taking a surface density of 6 M⊙pc-2, we get
| (28) |
| (29) |
| (30) |
So, we conclude from this section that the stellar radial velocity dispersion at R = 7 kpc is about 35 km/s from actual measurements and we infer that the vertical velocity dispersion is about 20 km/s. Near the disk edge we infer a radial velocity dispersion of about 25 km/s and a vertical one of about 10 km/s. The observed thickness of the HI layer in the total HI map is a result of a small deviation of the plane of IC 5249 away from perfectly edge-on.
6 Discussion
From the photometric data on IC 5249 is it clear that its very thin appearance on the sky is the result of a combination of a number of circumstances. These are the fact that the galaxy has a low surface brightness disk (when seen face-on) plus the rather long scalelength and the sharp truncation at only a little more than 2 scalelengths. As a result of this only the peak in the -profiles reaches above sky brightness and this peak varies then little with distance from the center before ending abruptly.
Remarkable is that in spite of its special nature, IC 5249 falls close to the relations that Bottema (1993) found between a fiducial velocity dispersion (here the radial one at one scalelength, which we found to be about 35 km/s) and the integrated luminosity of the disk and the maximum rotation velocity. These Bottema relations are most easily understood, if the product of central face-on surface brightness, mass-to-light ratio and Toomre are constant between galaxies (see e.g. van der Kruit & de Grijs, 1999). The derivation of that result makes use of the Tully-Fisher relation (it needs to have an exponent 4).
We already noted that in terms of flattening (), IC 5249 is slightly unusual compared to the sample studied in Kregel et al. (2001), where at a rotation velocity of 100 km/s this ratio ranges between 7 and 10. For IC 5249 it is just above 10 for our scalelength of 7 kpc, but would be larger if the central bright region really is a bulge and the scalelength is more like 11 or 13 kpc. Both the scalelength and in particular the scaleheight are significantly larger than in classical edge-on galaxies as in van der Kruit & Searle (1981, 1982) or our Galaxy.
It is interesting to note that the stellar velocity dispersions at =7 kpc ( 35 km/s, 30 km/s and 20 km/s) are comparable to those in the solar neighborhood, as reported by Dehnen & Binney (1998) for the redder stars (and therefore the old disk population). This means that in IC 5249 with a smaller surface density as much dynamical evolution has occured as in the Galaxy. It seems that in IC 5249 the star formation has proceeded slower: as far as we can tell a relatively large fraction of the disk mass is still in the form of gas (at least 3.2 M⊙ pc-2 in HI depending on where the HI missed by the interferometer is, multiplied by 1.33 to allow for helium and some more ionized and possibly molecular gas, compared to our adopted surface density of 25 M⊙ pc-2).
While at =7 kpc the axis ratio of the velocity ellipsoid () is comparable to the solar neightborhood, it seems to be more extreme at the outer boundaries of the disk. These are inferred values and should be treated with caution.
|
In Table 1 we compare some properties of IC 5249 and UGC 7321, where for the latter we took the analysis of Matthews et al. (1999) and Matthews (2000). The disk mass is the one estimated from the global stability criterion, which was also done by Matthews. We notice that these two “superthin” galaxies have –apart from this appearance and the fact that face-on they would be low surface brightness galaxies– very little in common; in fact the only remarkable similarity is the rotation velocity. In fact UGC 7321 is indeed very thin is absolute measure, while IC 5249 should in that respect be seen as relatively thick. However, UGC 7321 is a small galaxy in the sense of the linear size, while IC 5249 is not. Matthews (2000), using quite similar arguments as here, estimates that at one scalelength the vertical velocity dispersion of the stars is only of the order of 12 km/s or so. This is larger than that of cold HI and relatively little dynamical evolution must have occured. This is not the case in IC 5249. It would be of much interest to measure the radial stellar velocity dispersion in UGC 7321.
In conclusion, we have shown that IC 5249 is a large linear size low surface brightness galaxy in which the dynamical evolution of the velocity dispersions of the stars –at one scalelength from the center– has proceeded to similar values as in the solar neighborhood. Apparently, the angular momentum distribution of the gas that formed the disk in IC 5249 was such that, compared to the Galaxy, a much more extended distribution resulted in spite of the lower overall rotation and mass. The low surface density that arose from that gave rise to a thicker HI layer in which star formation proceeded at a much slower rate (a considerable fraction of the disk mass is probably still in the form of gas). In spite of that, disk heating proceeded at a similar pace. It is possible that this dynamical evolution resulted from strong (in a gravitational sense) spiral structure and it would be interesting to know what IC 5249 would look like face-on. We have not been able to find the means or travel funds to perform that observation.
Acknowledgements.
We thank the Australia Telescope Compact Array archive for providing us with the HI observations of IC 5249. We are grateful to the director of Mount Stromlo and Siding Spring Observatories for observing time on the 2.3 meter telescope. PCK thanks the Space Telescope Science Institute for hospitality and support during a period when most of this paper was written. JJ-V would like to thank R. Bottema and I. Garcia-Ruiz for their help with the reduction and analysis of the radio data. The Area Board for Exact Sciences of the Netherlands Organisation for Scientific Research (NWO) supported the travel of PCK and (partly) MK.References
- (1) Abe, F., Bond, I.A., Carter, B.S., et al., 1999, AJ 118, 261
- (2) Andredakis, Y.C., Sanders, R.H., 1994, MNRAS 267, 283
- (3) Bottema, R., 1993, A&A 275, 16
- (4) Bottema, R., 1997, A&A 328, 517
- (5) Bottema, R., van der Kruit, P.C., Freeman, K.C., 1987, A&A 178, 77
- (6) Byun, Y.-I., 1998, Chin. J. Phys. 36, 677
- (7) Carignan, C., 1983, Ph.D. Thesis, Australian National University
- (8) de Grijs, R., 1998, MNRAS 299, 595
- (9) de Grijs, R., Peletier, R.F., van der Kruit, P.C., 1997, A&A 327, 966
- (10) Dehnen, W., Binney, J.J., 1998, MNRAS 298, 387
- (11) Efstathiou, G., Lake, G., Negroponte, J., 1982, MNRAS 199, 1069
- (12) Freeman, K.C., 1970, ApJ 160, 811
- (13) Gilmore, G., Reid, N., 1983, MNRAS 202, 1022
- (14) Jenkins, A., 1992, MNRAS 257, 620
- (15) Jenkins, A., Binney, J.J., 1990, MNRAS 245, 305
- (16) Kregel, M., van der Kruit, P.C., de Grijs, R. 2001, MNRAS (submitted)
- (17) Mathewson. D.S., Ford, V.L., Buchhorn, M., 1992, ApJS 81, 413
- (18) Matthews, L.D., 2000, AJ 120, 1764
- (19) Matthews, L.D., Gallagher III, J.S., van Driel, W., 1999, AJ 118, 2751
-
(20)
Mendelowitz, C., 2000, NROA Student Project,
http://www.cv.nrao.edu/jhibbart/students/CMendelowitz/caylin.html - (21) Schwarzkopf, U., Dettmar, R.-J., 2000, A&A 361, 451
- (22) Statler, T.S., 1995, AJ 109, 1371
- (23) Toomre, A., 1964, ApJ 139, 1217
- (24) van der Kruit, P.C., 1981, A&A 99, 298
- (25) van der Kruit, P.C., 1988, A&A 192, 117
- (26) van der Kruit, P.C., 1999, Ap&SS 269/270, 139
- (27) van der Kruit, P.C., 2000, in: The Legacy of J.C. Kapteyn, eds. P.C. van der Kruit and K. van Berkel (Dordrecht: Kluwer), 299
- (28) van der Kruit, P.C., 2001, in: Galaxy Disks and Disk Galaxies, eds. J.G. Funes S.J. and E.M. Corsini, ASP Conf. Series (in press).
- (29) van der Kruit, P.C., de Grijs, R., 1999, A&A 352, 129
- (30) van der Kruit, P.C., Freeman, K.C., 1986, ApJ 303, 556
- (31) van der Kruit, P.C., Searle, L., 1981, A&A 95, 105
- (32) van der Kruit, P.C., Searle, L., 1982, A&A 110, 61
- (33) Wainscoat, R.J., 1986, Ph.D. Thesis, Australian National University